4311
A new qMRI approach for mapping microscopic water populations and tissue relaxivity in the in-vivo human brain1The Edmond and Lily Safra Center for Brain Science, The Hebrew University of Jerusalem, Jerusalem, Israel
Synopsis
Keywords: Microstructure, Magnetization transfer
We present an array of new quantitative maps, highlighting different aspects of the tissue’s water. Furthermore, our technique allows to calculate the voxel-wise tissue relaxivity, associated with the molecular composition of the brain. Our approach is based on the pioneering two-site exchange model. We implemented it for magnetization-transfer weighted water content mapping of brain tissue for the first time. The new in-vivo MRI measurements conform well with the theory. They can be easily acquired with the standard quantitative MRI protocol and do not require complex data fitting. Therefore, the proposed technique may further advance human brain research and diagnosis.Introduction
The quantitative MRI (qMRI) estimation of the tissue’s water content (WC) provides a unique opportunity to detect various processes in the human brain such as maturation, aging, inflammation and edema1–3. Furthermore, the effect of changes in the tissue’s WC on the longitudinal relaxation (R1), defined as the tissue relaxivity, was shown to be sensitive to the molecular composition of the tissue4.Standard WC mapping approaches consider the water to be homogeneous. But in fact, brain tissue is characterized by several distinct water environments. Most cellular water is relatively free, but some is bound and exchanges energy with macromolecular protons5.
Here we present a new qMRI approach for direct imaging of different microscopic water populations and tissue relaxivity in the in-vivo human brain.
Theory
For the biophysical modeling of our approach, we revisited the pioneering magnetization transfer (MT) model of Forsén and Hoffman6, presenting a two-site exchange system. Based on this model, assuming full saturation of the macromolecular spins and no direct effect on the liquid spins, the system can be described by the Ernst equation7. This MT-system has higher R1 (R1sat) compared to the standard R1, and less available equilibrium magnetization8. While more complex MT models were later introduced9,10, the implementation of this framework for WC mapping was neglected.Here we established an MT-weighted WC mapping technique for the first time. We hypothesized the observed WC should be lower following MT saturation (WCsat), due to bound water suppression. Moreover, based on the theory11:
$$(1)\;\;\;\;\;\;\;\;R_1=R1_{sat}*\frac{WC_{sat}}{WC}$$
To measure WCsat and R1sat, we modified the standard variable flip-angle technique3, by incorporating MT irradiation for each flip-angle.
Methods
WC, R1, B1 and Gains mapping: four SPGR scans (TE/TR=3.34/19, FA=4,10,20,30, 1X1X1 mm) and four SEIR scans (TE/TR= 49/2920, TI=200,400,1200,2400, 2X2X3 mm), processed with mrQ2.R1sat and WCsat mapping: four MT-weighted SPGR scans (TE/TR=3.34/27, FA=4,10,20,30, 1X1X1 mm), processed with a modified version of mrQ, and with the bias maps from mrQ2. To account for the direct effect, WCsat maps were calibrated to have the same median value as WC in the CSF (where we assume there is only direct effects).
We scanned three healthy human subjects on a 3T Siemens MAGNETOM Skyra scanner.
Results
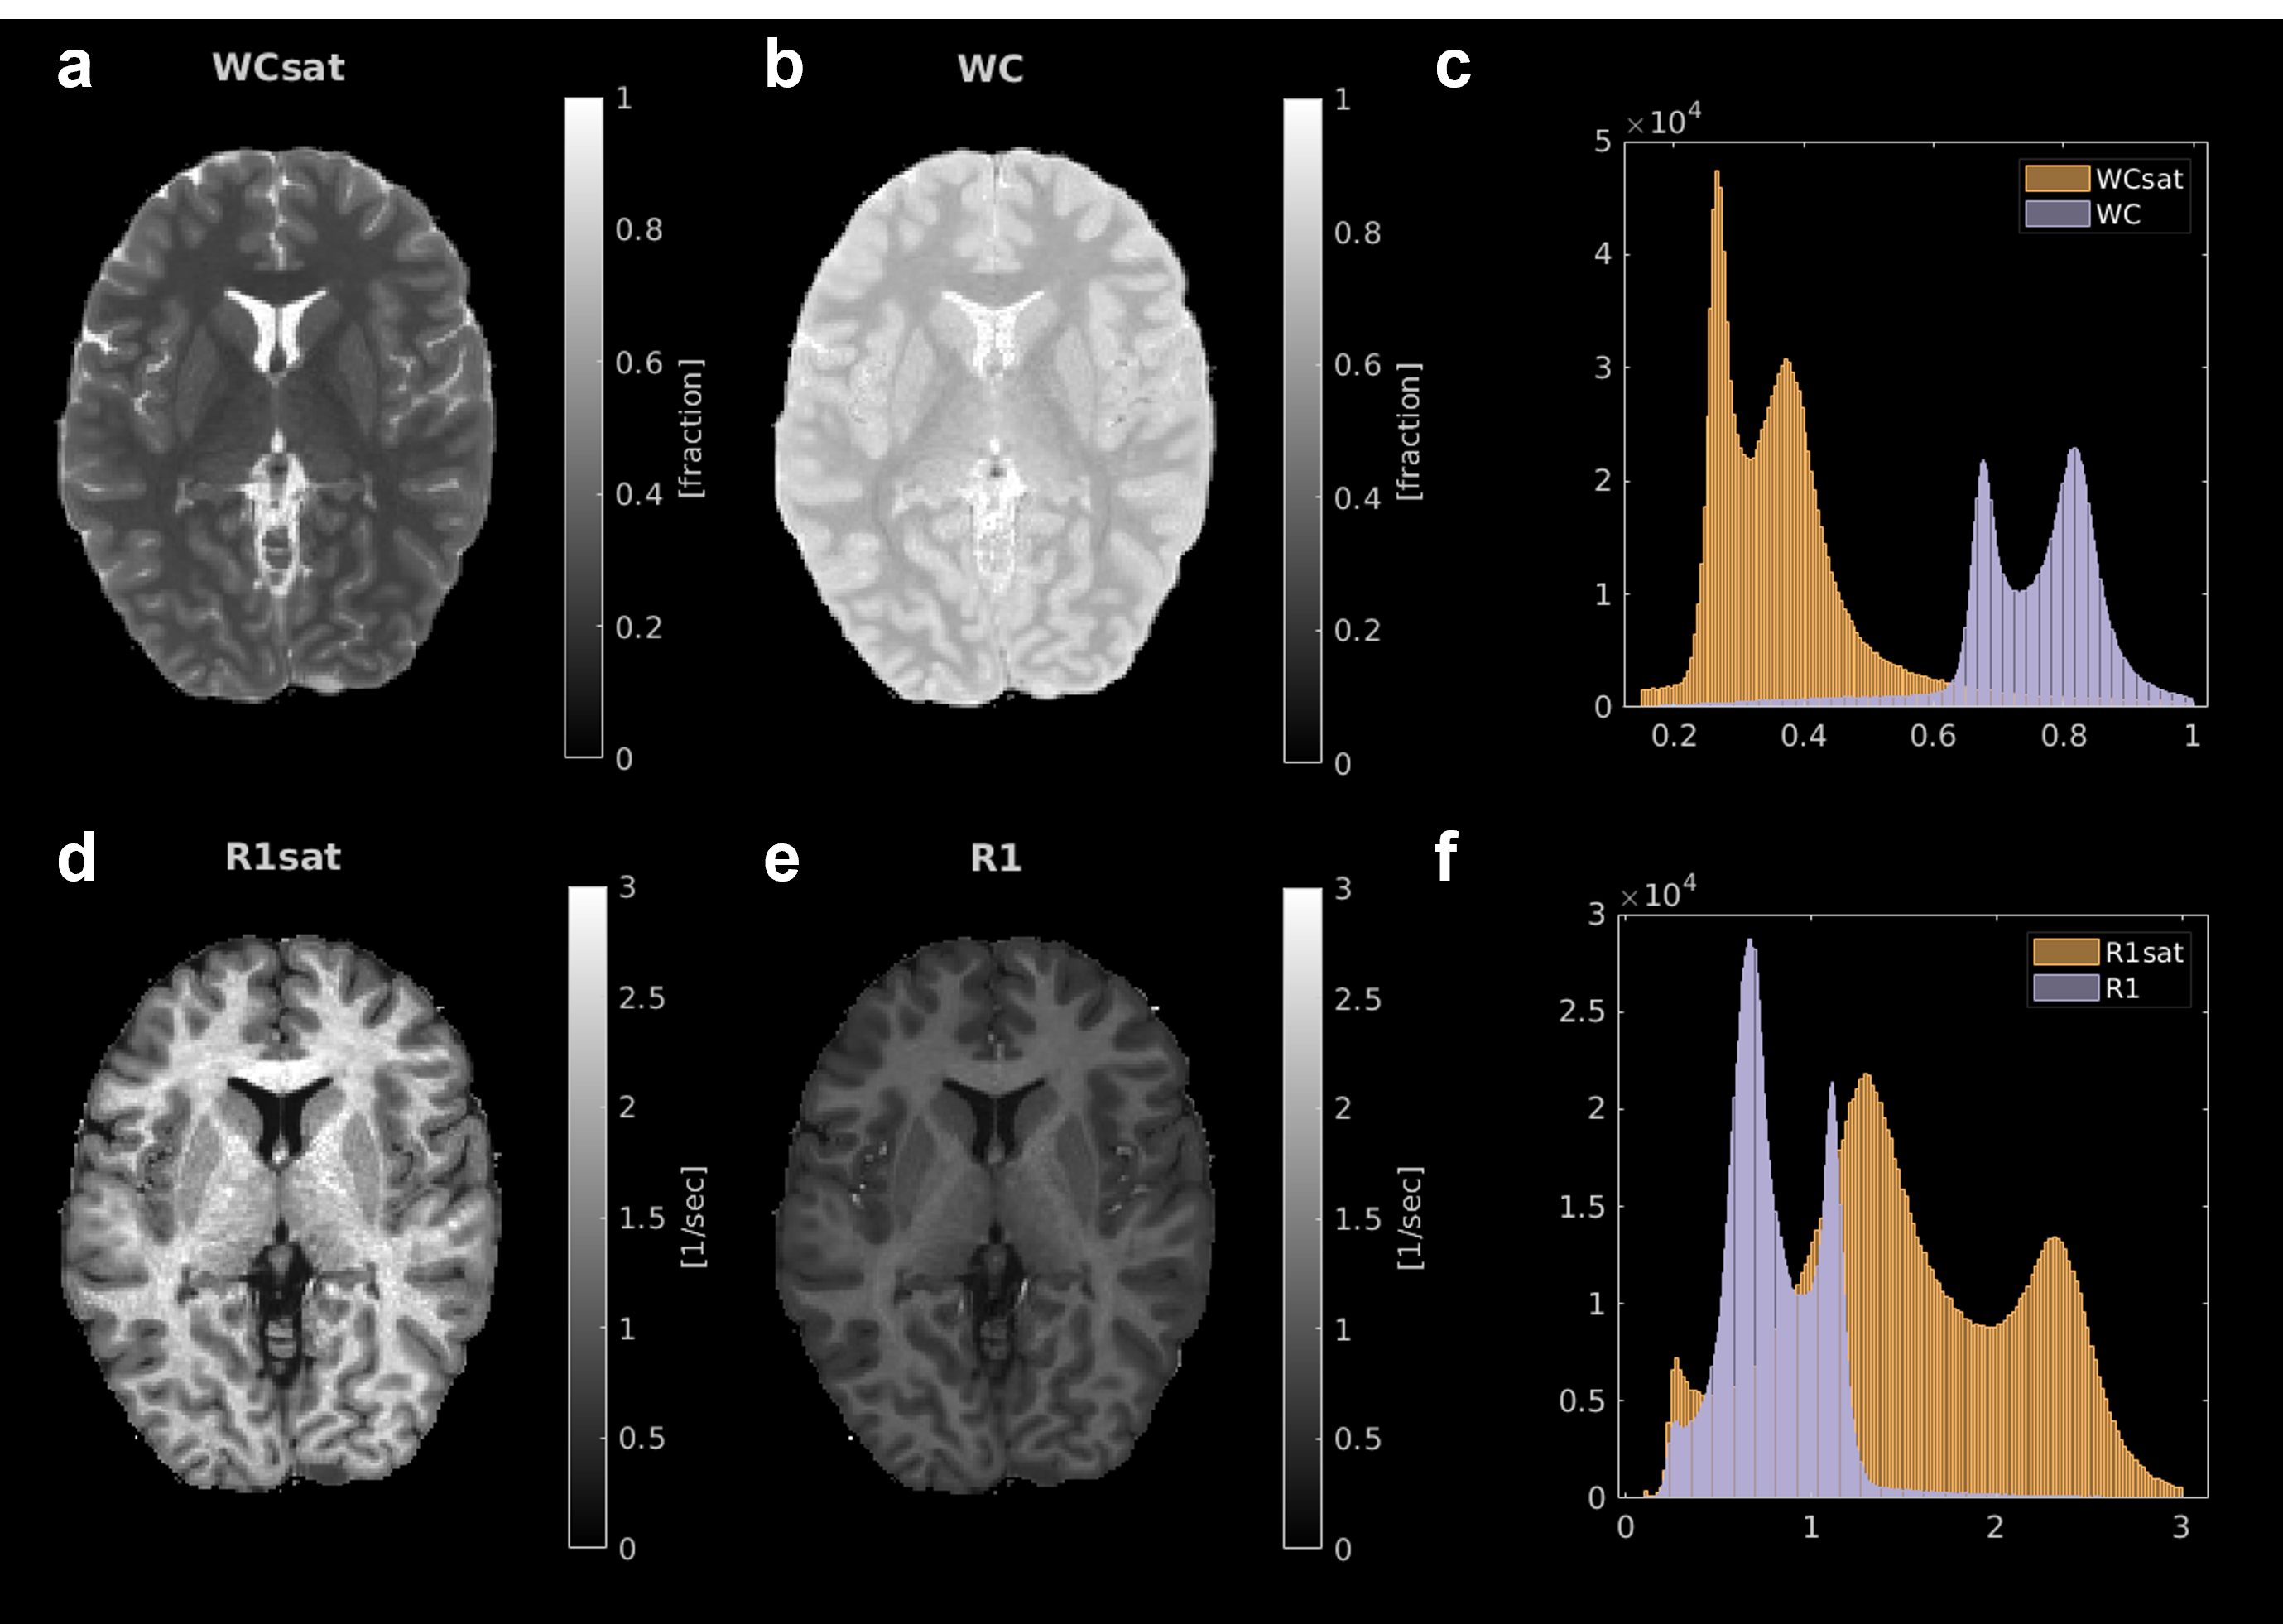
As predicted by the two-site exchange model6,8,11, the measured WCsat (WC with MT-weighting) is smaller than the total WC, indicating that some of the bound water were suppressed and eliminated from the signal (Fig. 1a-c). Furthermore, as expected from the theory, R1sat (R1 with MT-weighting) is higher than R1 (Fig. 1d-f). We find that WCsat and R1sat values have distinct contrasts within the brain (Fig. 1c,f), implying for their ability to expose novel microstructural information.While the theoretical formulation we rely on assumes full saturation and no direct effect, these conditions are usually not satisfied in standard in-vivo MRI scans9. We therefore assessed the effect of these simplifying assumptions (Fig. 2a). Interestingly, we find great compliance between the theoretical R1 (equation 1) and the measured R1 in the in-vivo brain (median MEA=0.14, n(subjects)=3). This result was further improved by the CSF calibration, which accounted for the direct effect (Fig. 2b, median MAE=0.095, n(subjects)=3). Hence, although some of the assumptions are imprecise, we verified the biophysical relationship in equation 1, relating R1, R1sat, WC and WCsat. This equation allows to reduce the number of unknown parameters in the fitting process of our new technique. Therefore, by adding only a single MT-weighted SPGR scan to the standard water content mapping protocol, both WCsat and R1sat can be evaluated, together with WC and R1 (Fig. 2c, median MAE=0.03, n(subjects)=3). This “fast WCsat” implementation makes our approach applicable to standard multi-parametric mapping (MPM)12 and MT-SPGR13,14 datasets.
Measuring WCsat and WC provides access to two different water populations within the imaging voxel. The new qMRI maps of the saturated and unsaturated water, along with the water saturation ratio, are presented in figure 3. Importantly, these quantifications may vary with the strength of the MT pulse.
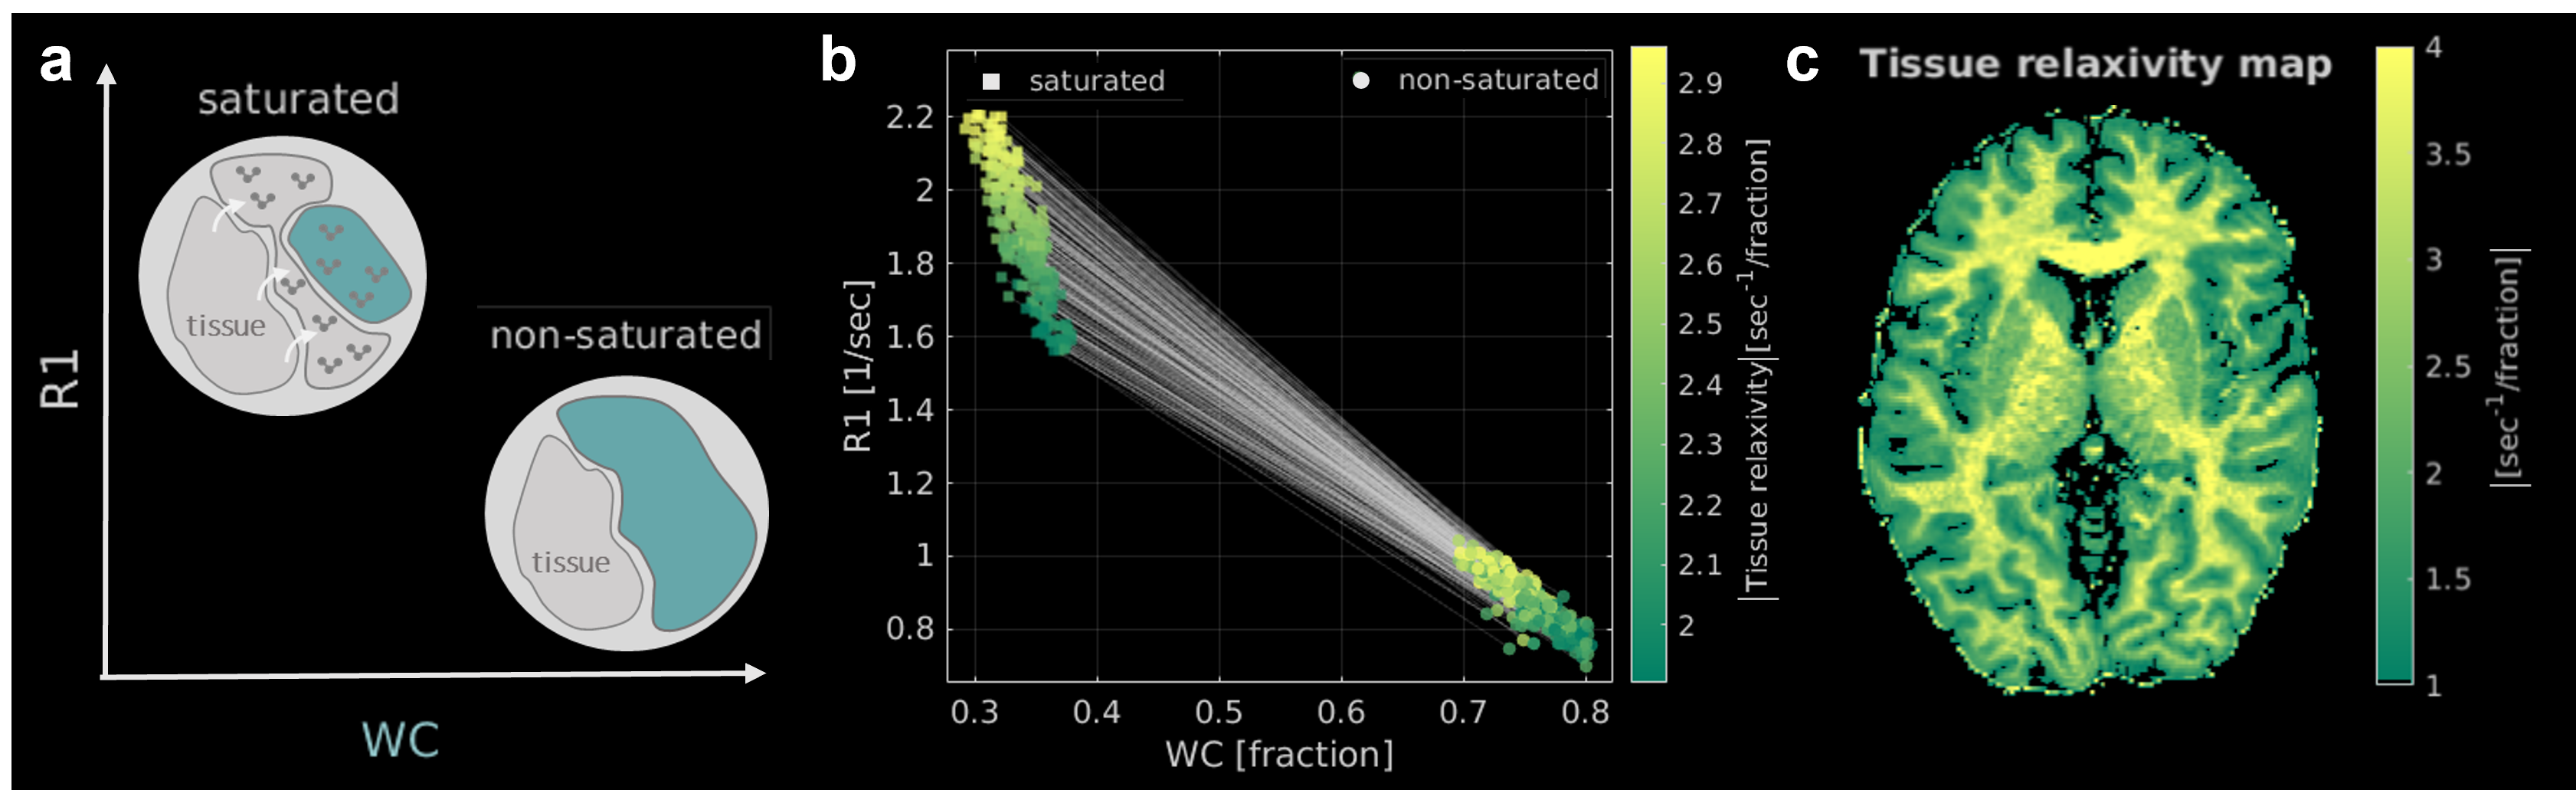
Current tissue relaxivity measurements are based on the variability in WC across voxels, thereby limiting the resolution of this measurement to whole ROIs4. Interestingly, the MT water saturation changes the observed WC within voxels. Measuring two WC and R1 values within each voxel, allows to estimate the dependency of R1 on the WC (i.e., the tissue relaxivity) on a voxel-wise resolution (Fig. 4a-b). We exploit this observation to quantify an additional map of the local tissue relaxivity (Fig. 4c).
Conclusions
We revisited the pioneering two-site exchange model and implemented it for MT-weighted WC mapping for the first time. We show that our new in-vivo MRI measurements conform well with theory, and are relatively stable against partial and direct saturations effects. Moreover, these measurements can be easily acquired with the standard MPM or MT-SPGR protocols and do not require complex data fitting. Importantly, our technique provides an array of new qMRI maps, highlighting different aspects of the tissue’s water. Furthermore, it allows to calculate the voxel-wise tissue relaxivity, associated with the molecular composition of the brain. Therefore, the proposed technique offers a novel in-vivo characterization of different water microenvironments within each voxel and may have great implications for the study and diagnosis of the in-vivo human brain.Acknowledgements
No acknowledgement found.References
1. Mezer, A., Rokem, A., Berman, S., Hastie, T. & Wandell, B. A. Evaluating quantitative proton-density-mapping methods. Hum. Brain Mapp. 37, 3623–3635 (2016).
2. Mezer, A. et al. Quantifying the local tissue volume and composition in individual brains with magnetic resonance imaging. Nat. Med. 19, 1667–72 (2013).
3. Filo, S. & Mezer, A. A. PD: Proton Density of Tissue Water. in Quantitative MRI of the Brain : Principles of Physical Measurement (eds. Cercignani, M., Dowell, N. G. & Tofts, P. S.) 55–72 (CRC Press, 2018). doi:10.1201/B21837-4.
4. Filo, S. et al. Disentangling molecular alterations from water-content changes in the aging human brain using quantitative MRI. Nat. Commun. 10, (2019).
5. Fullerton, G. D., Cameron, I. L. & Ord, V. A. Frequency dependence of magnetic resonance spin-lattice relaxation of protons in biological materials. Radiology 151, 135–138 (1984).
6. Forsén, S., Hoffman, R. A. & Forsen, S. Study of Moderately Rapid Chemical Exchange Reactions by Means of Nuclear Magnetic Double Resonance. Cit. J. Chem. Phys. 39, 2892 (1963).
7. Ernst, R. R. & Anderson, W. A. Application of Fourier Transform Spectroscopy to Magnetic Resonance. Rev. Sci. Instrum. 37, 93 (2004).
8. Boer, R. W. Magnetization transfer contrast Part 1 : MR physics. Medicamundi. 1995;40:64-73
9. Henkelman, R. M., Stanisz, G. J. & Graham, S. J. Magnetization transfer in MRI: A review. NMR in Biomedicine vol. 14 57–64 (2001).
10. Sled, J. G. Modelling and interpretation of magnetization transfer imaging in the brain. Neuroimage (2017) doi:10.1016/J.NEUROIMAGE.2017.11.065.
11. Mann, B. E. The application of the Forsén-Hoffman spin-saturation method of measuring rates of exchange to the 13C NMR spectrum of N,N-dimethylformamide. J. Magn. Reson. 25, 91–94 (1977).
12. Tabelow, K. et al. hMRI – A toolbox for quantitative MRI in neuroscience and clinical research. Neuroimage 194, 191–210 (2019).
13. Sled, J. G. & Pike, G. B. Quantitative Interpretation of Magnetization Transfer in Spoiled Gradient Echo MRI Sequences. J. Magn. Reson. 145, 24–36 (2000).
14. Cabana, J. F. et al. Quantitative magnetization transfer imaging made easy with qMTLab: Software for data simulation, analysis, and visualization. Concepts Magn. Reson. Part A 44A, 263–277 (2015).
Figures
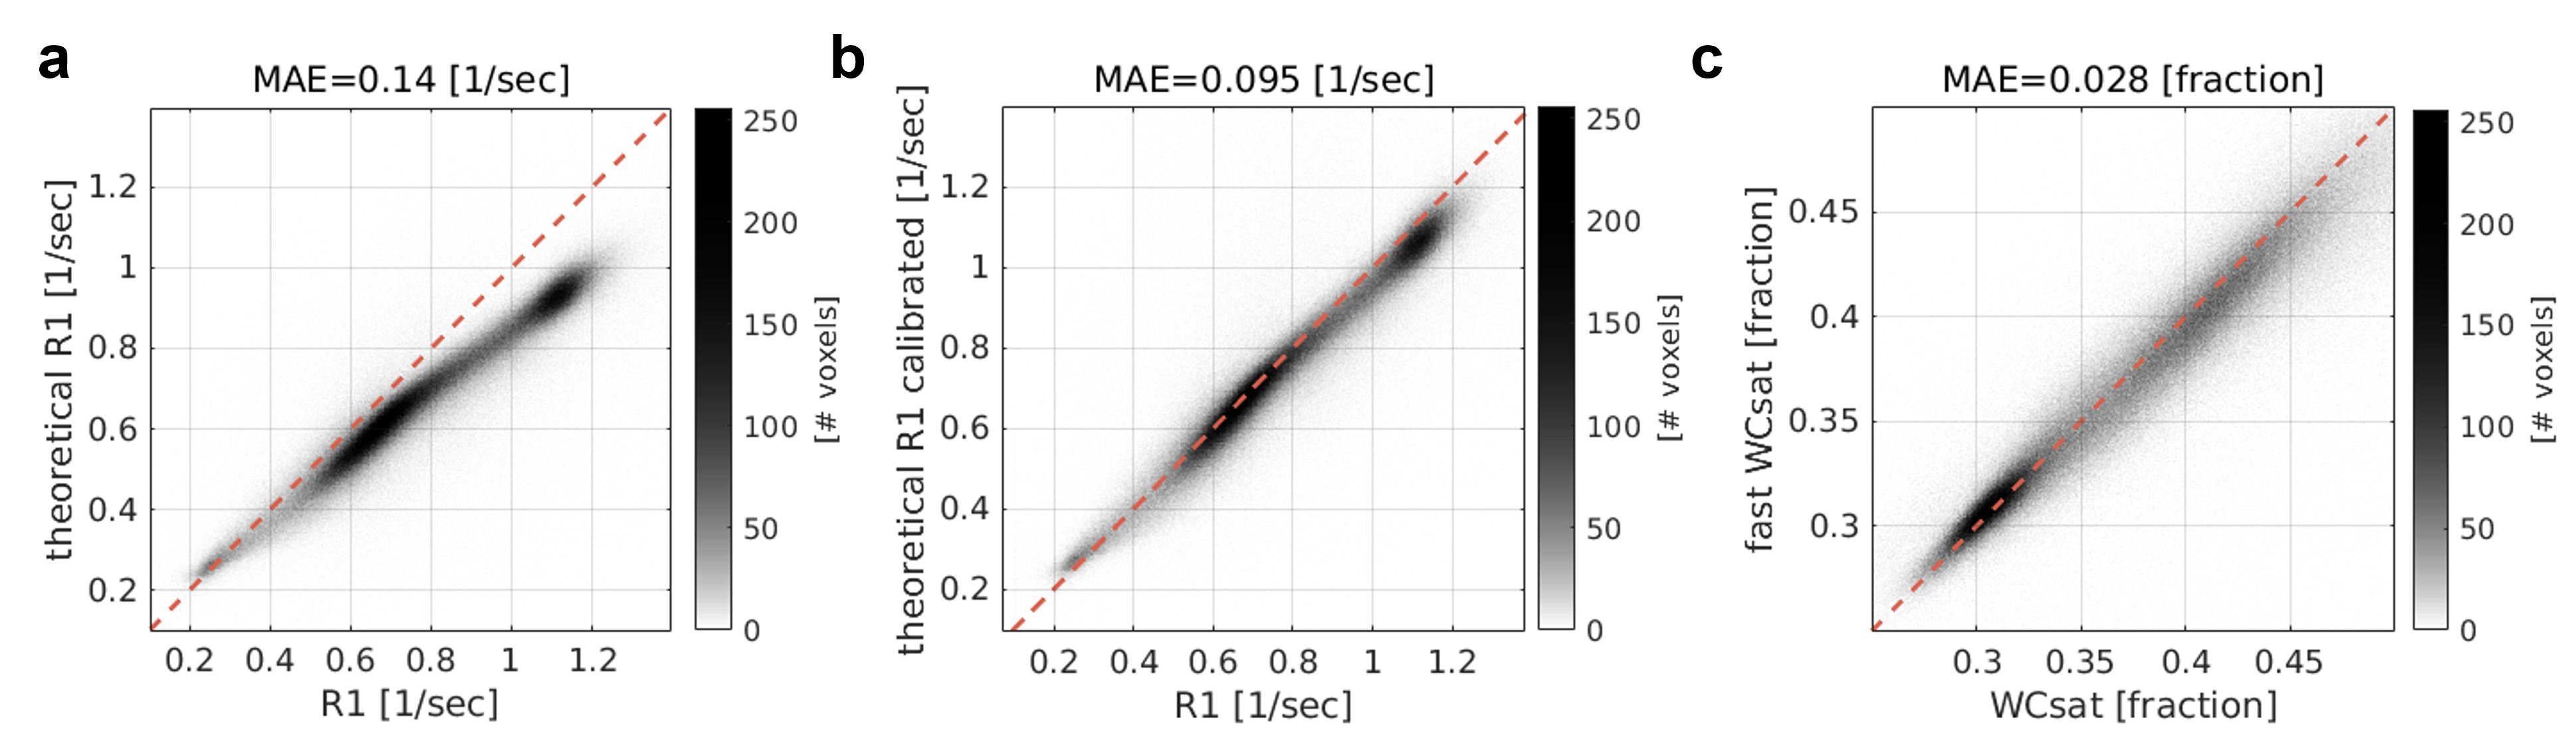
Validating the theoretical basis for the MT-weighted WC mapping.
(a) The measured R1 values for the whole brain of a single subject (x-axis) against the predicted R1 (y-axis) based on the two-site exchange model (eq. 1). (b) The agreement between the measured R1 (x-axis) to the predicted R1 (y-axis) improved when accounting for the direct effect. (c) WCsat fitted with 4 MT-weighted SPGR scans (x-axis) is well approximated by the “fast WCsat” (based on a single MT-weighted SPGR scan). Values are for the whole brain of a single subject. The identity line is in red. MAE=mean absolute error.
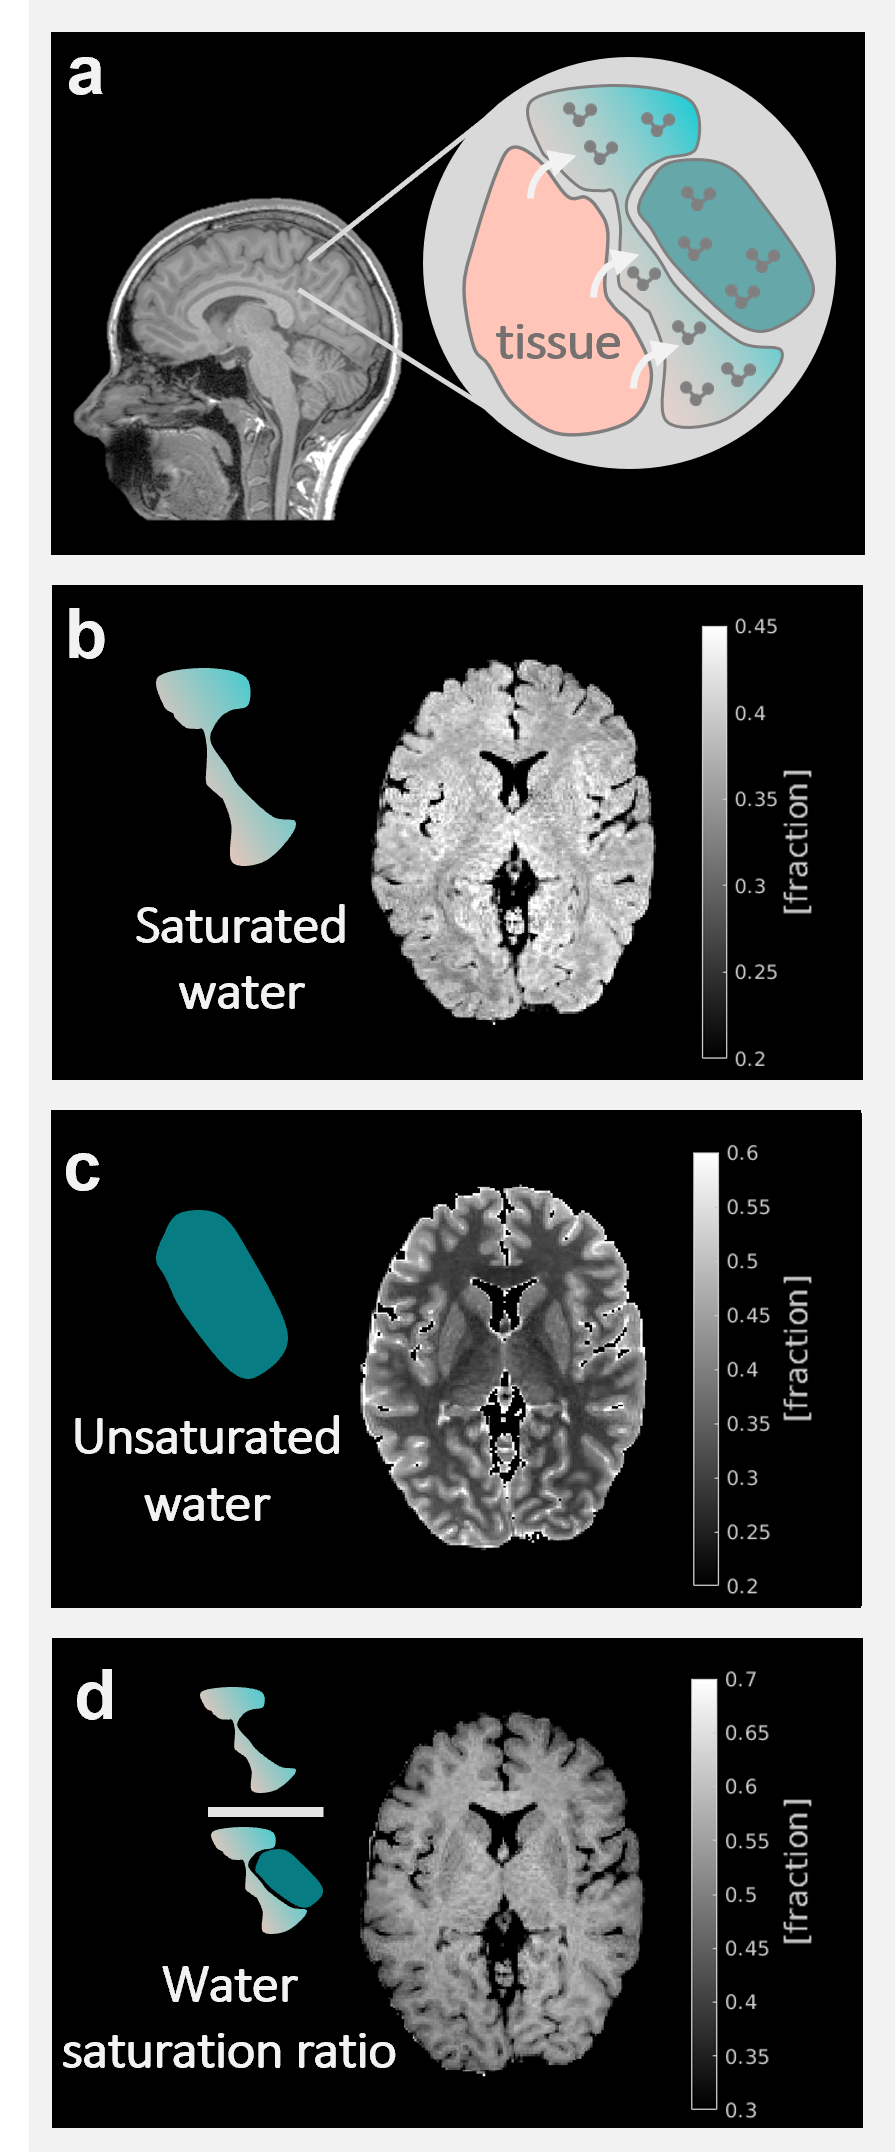
In-vivo qMRI of different water populations in the human brain. (a) A schematic discerption of the microscopic water environment. Saturated water protons are interacting with the tissue’s macromolecular protons. Unsaturated water protons are free. The size of the saturated pool may vary with the MT pulse strength. Whole brain in-vivo mapping of the saturated (b) and unsaturated (c) water compartments, and the ratio of saturated to total water content (d) are shown for a representative subject.