4310
The effect of inter-individual differences and number of fiber directions on possible orientation dependence of myelin water imaging1Physics and Astronomy, University of British Columbia, Vancouver, BC, Canada, 2International Collaboration on Repair Discoveries, University of British Columbia, Vancouver, BC, Canada, 3Radiology, University of British Columbia, Vancouver, BC, Canada, 4Medicine, University of British Columbia, Vancouver, BC, Canada, 5Pathology & Laboratory Medicine, University of British Columbia, Vancouver, BC, Canada
Synopsis
Keywords: Microstructure, Relaxometry, myelin, white matter, orientation dependence, fiber direction, BedpostX, myelin water fraction, myelin water imaging
Previous work suggests myelin water fraction (MWF) may be fibre orientation dependent. We compared MWF to fiber angle (from diffusion tensor imaging (DTI)) in white matter (WM) from 16 healthy participants using BedpostX to estimate the number of fiber directions. MWF vs. fiber angle graphs showed trends which varied between participants, suggesting that real myelination differences may be at least partly responsible for apparent orientation dependence of MWF. There were little obvious differences between trends with 1, 2, or 3+ fiber orientations in WM, suggesting number of fibers directions within a voxel does not impact orientation dependence.Background
Myelin Water Fraction (MWF) is a Myelin Water Imaging (MWI) metric that has been used to quantify myelin pathology in many diseases (e.g. multiple sclerosis1, concussion2, stroke3). Recent work has suggested that MWF measurements may depend on the orientation of white matter (WM) fibers with respect to the main magnetic field, B04. To investigate orientation dependence, it is common to use the principal eigenvector from diffusion tensor imaging (DTI) to solve for the angle between the fiber orientation and B04,5. However, up to 90% of voxels in WM may have multiple fiber directions6. It is difficult to disentangle whether MWI is truly orientation dependent, or if the myelin content varies such that it tends to be higher in tracts oriented in particular directions, or if both factors contribute to the measured MWF.Objectives
Investigate orientation dependence of MWF, as well as the impact of the number of fiber directions on changes in MWF with orientation in WM of healthy participants.Methods
Data Collection: Sixteen healthy participants (mean age: 34y, age range: 22-67y, 7M/9F) underwent 3T MRI (Philips Achieva) to collect MWI (48-echo Gradient and Spin Echo, TR/TE=1073/8ms, resolution = 1x1x2.5mm3)7, diffusion (99 directions, b values = 0–1500, TR/TE=4798/79ms, voxel size = 2×2×2mm3)8, and 3DT1 (TR/TE/TI=3000/3.5/926ms, resolution = 1x1x1mm3).Analysis: Voxel-wise MWF maps (T2<40ms) were made using NNLS9,10. Diffusion data was eddy current corrected and smoothed (FSL toolbox11). BedpostX12,13 was used to extract the number of fiber directions in each voxel, using a threshold of 0.05 on each fiber signal volume fraction6. The primary eigenvector of diffusion data was extracted (FSL DTIFIT11) to determine the angle between the primary eigenvector and B0 (restricted to 0°-90°). 3DT1 scans were registered to MNI standard space (FNIRT11,15). WM ROIs from the JHU White Matter Labels atlas (anterior/posterior/superior corona radiata, anterior/posterior/retrolenticular part of the internal capsule, body/genu/splenium of the corpus callosum, cerebral peduncle, cingulum hippocampus, external capsule, posterior thalamic radiation, sagittal stratum, superior fronto-occipital fasciculus) were registered to 3DT1 space16. The MWF map and diffusion scans were registered to 3DT1 (MWF: FLIRT, diffusion: epireg from FSL toolbox11). The MWF maps and WM ROIs were registered to diffusion space (inverse epireg registration matrix from diffusion to 3DT1 space). The diffusion registered 3DT1 scans were segmented to produce WM masks (FAST14). ROIs were excluded if they contained <100 voxels. MWF was binned in 1° increments and the mean MWF was plotted, color coding points based on the number of fiber directions present. Plots were visually assessed to see patterns between participants.
Results and Discussion
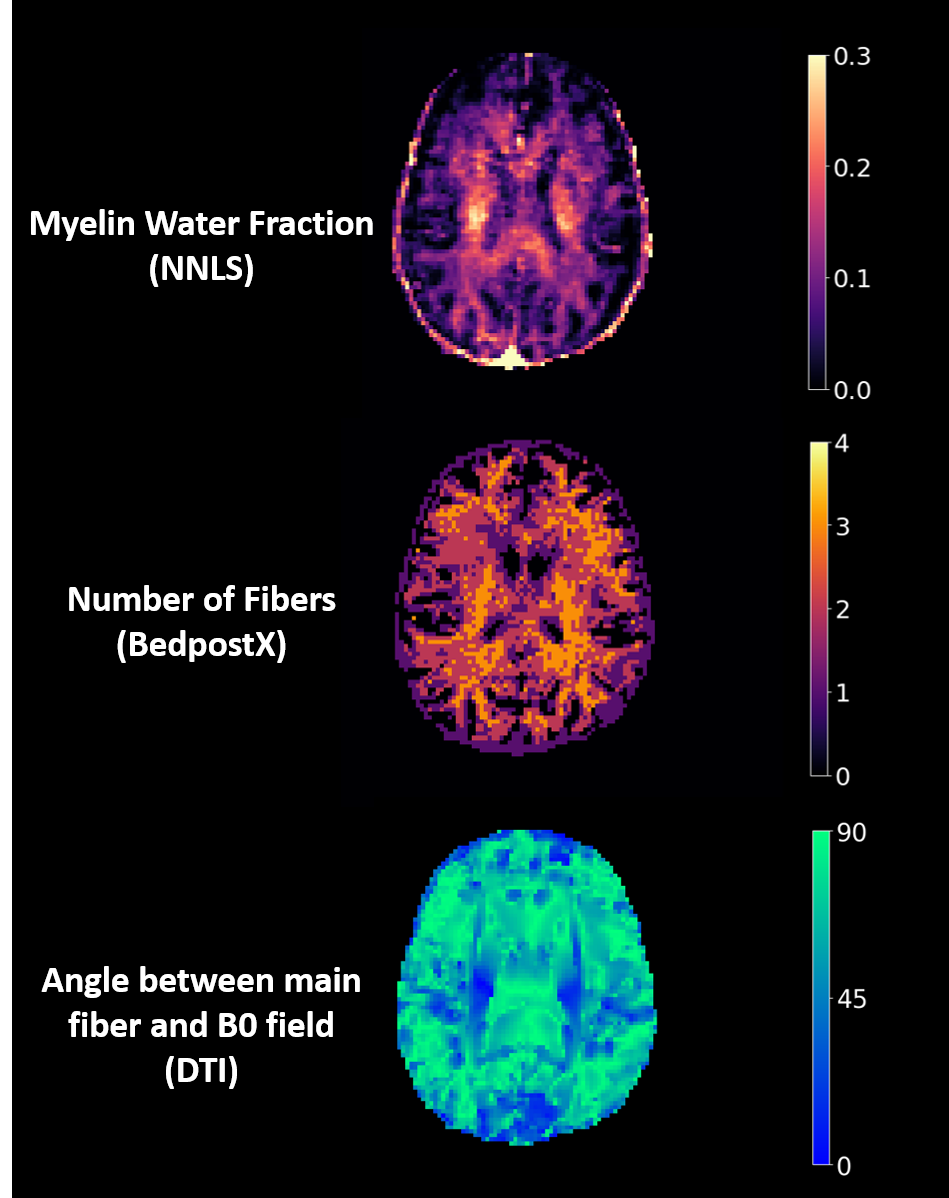
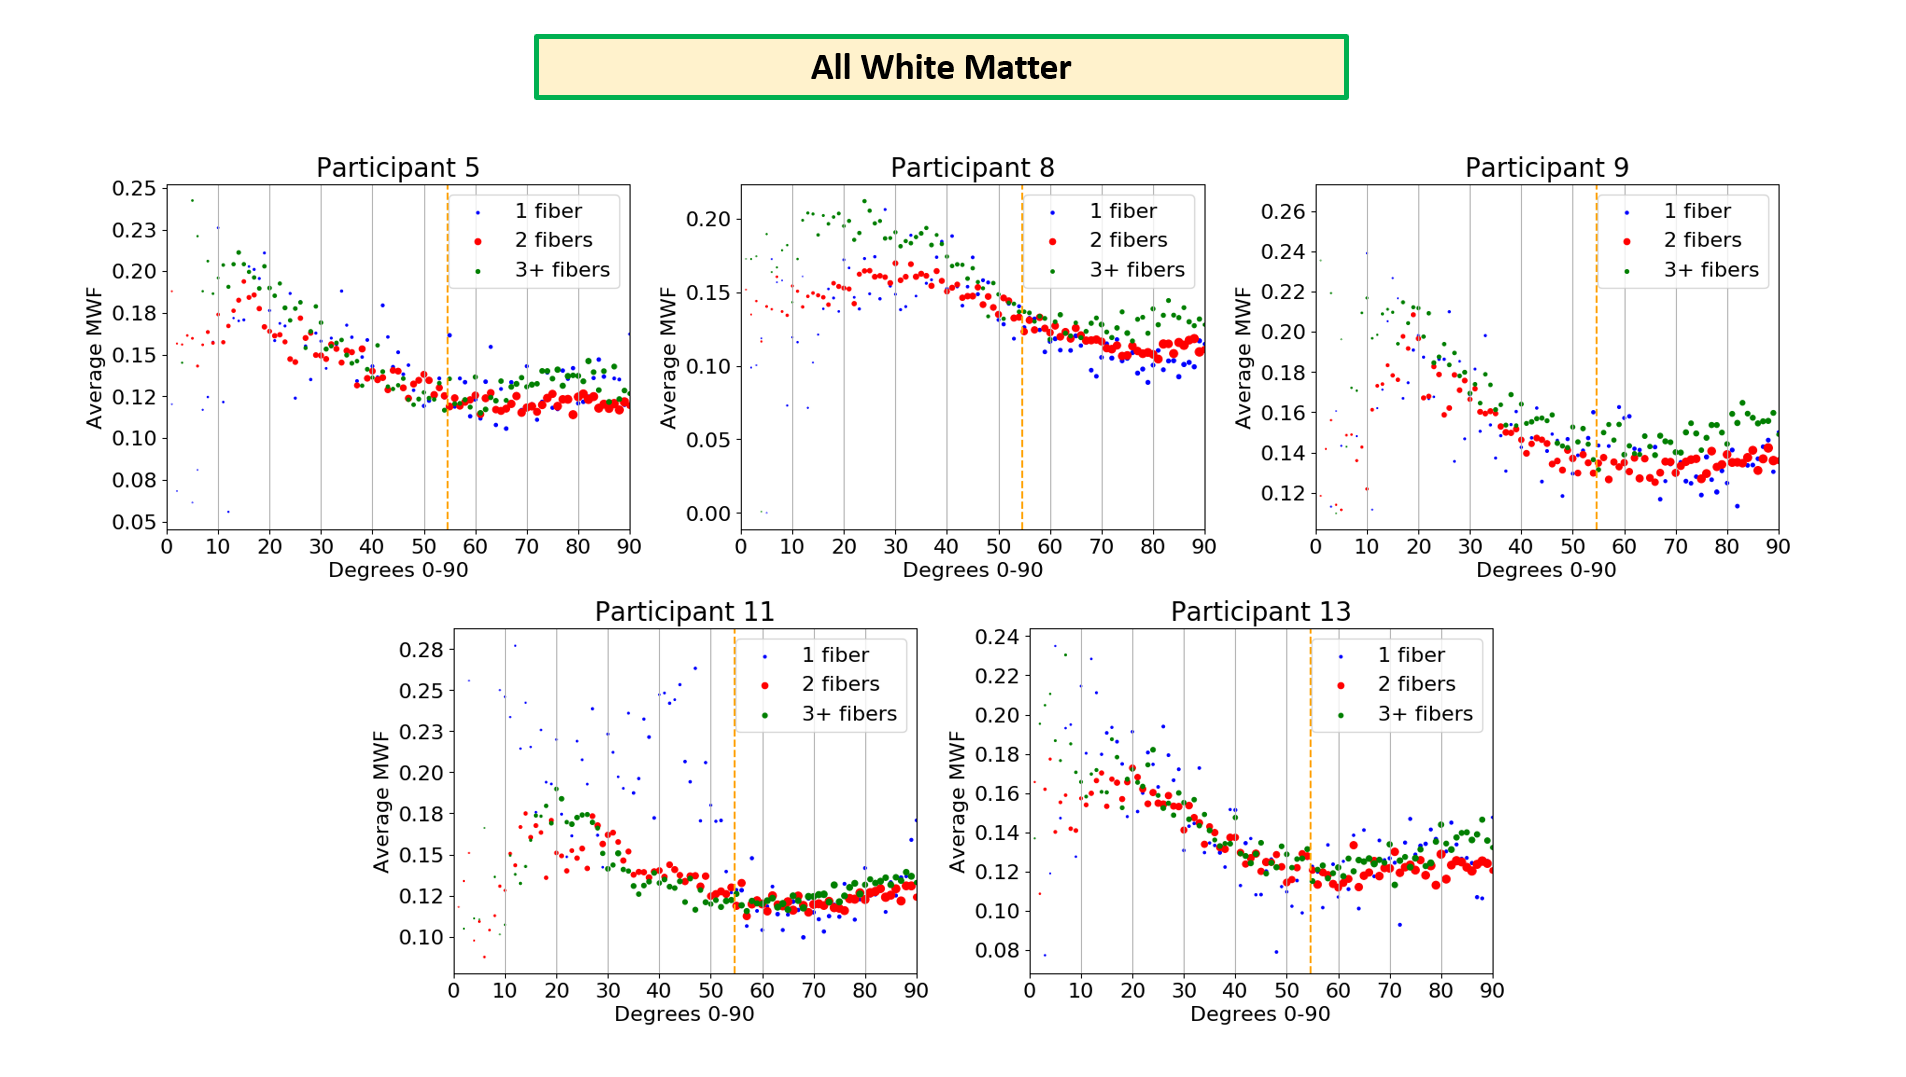
Figure 1 displays representative MWF, number of fibers, and angle maps.MWF vs. angle plots in all WM (Figure 2) followed a trend similar to that seen in Birkl et al. with minimum around the magic angle4. In some plots, voxels with 3+ fiber directions had higher MWF than voxels with 2 fiber directions across the whole angle range, indicating that higher MWF is seen with more complex fiber orientations. In other plots, voxels with just 1 fiber direction looked more scattered with no clear trend; this could be due to fewer voxels in white matter having 1 fiber direction (12% of voxels).
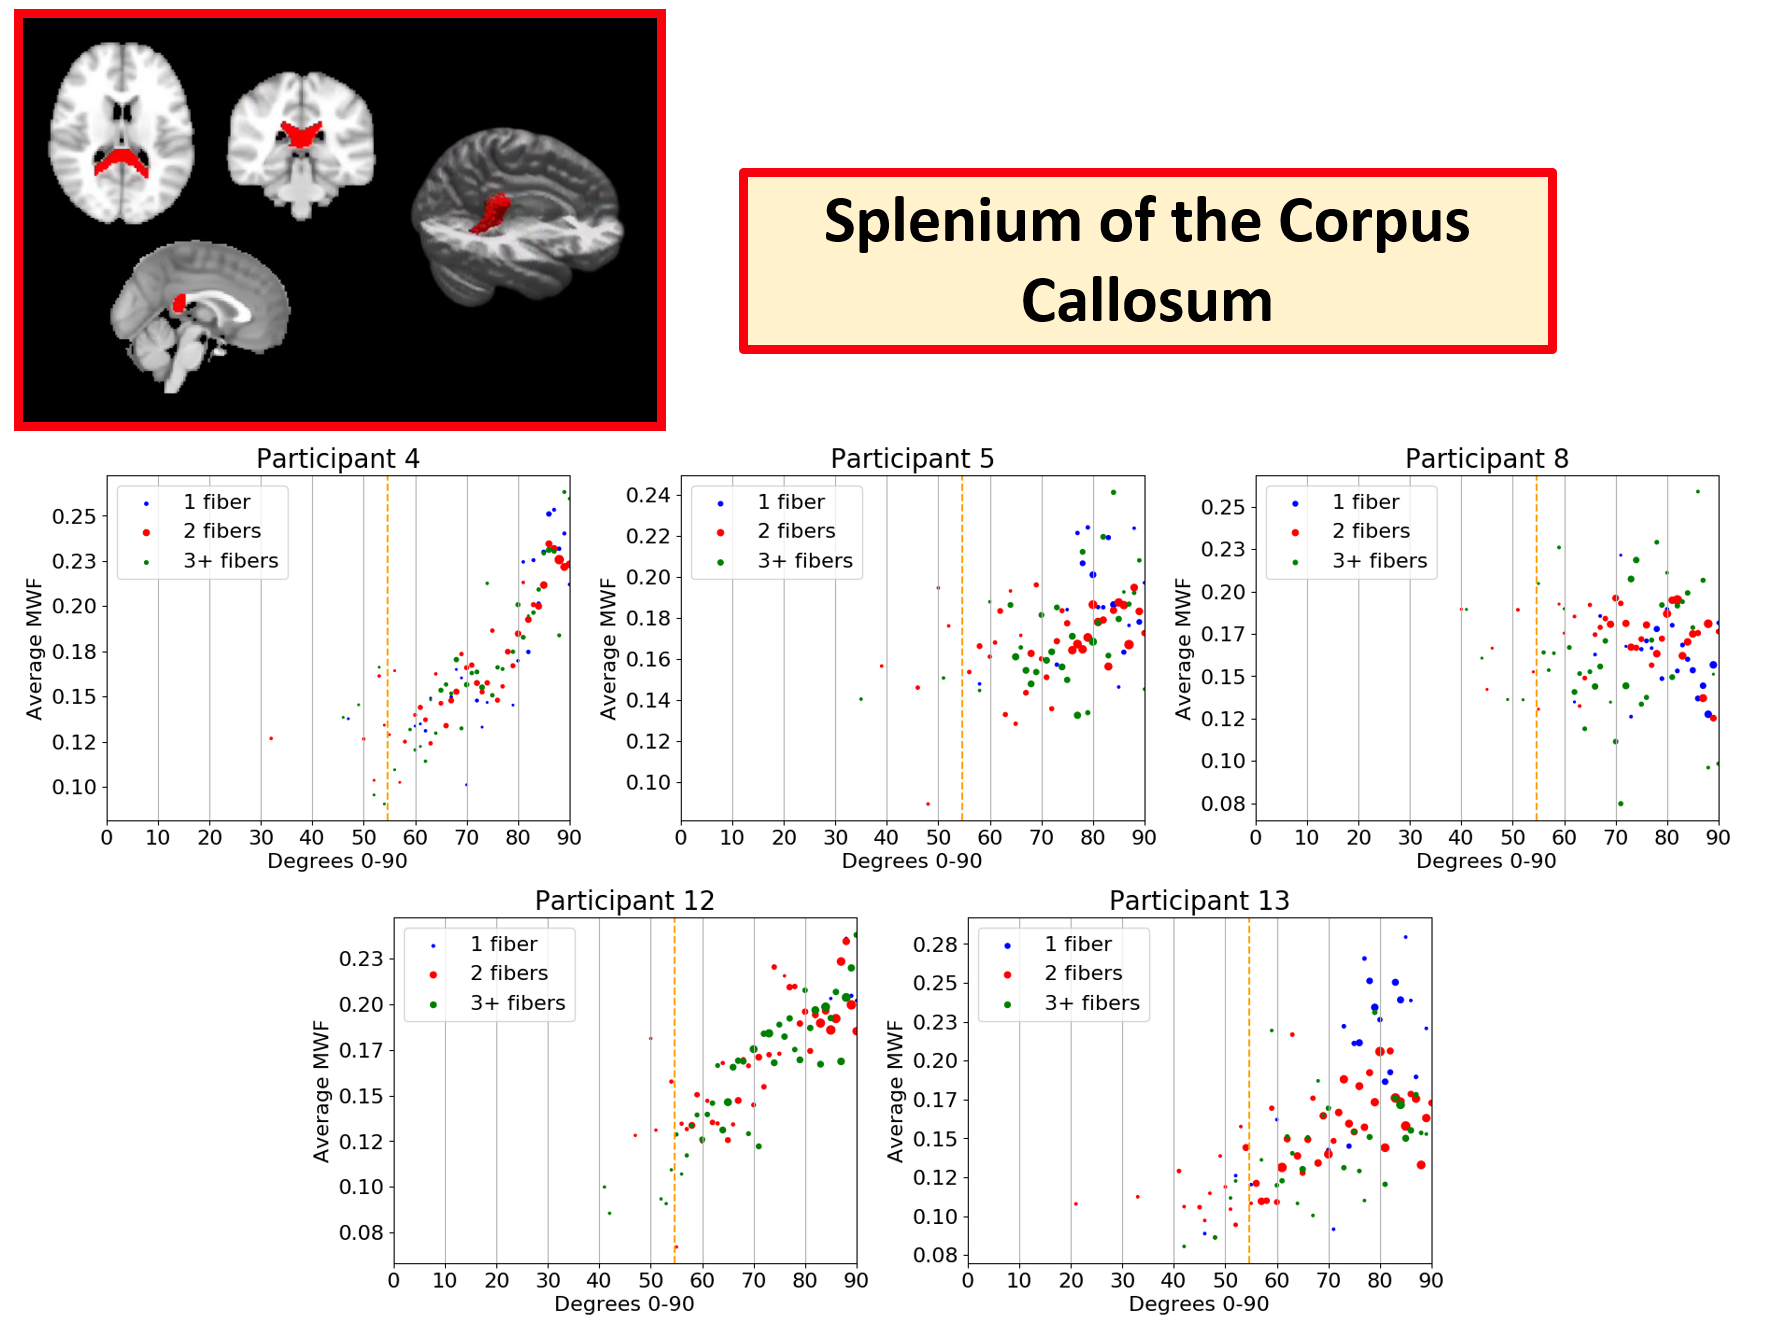
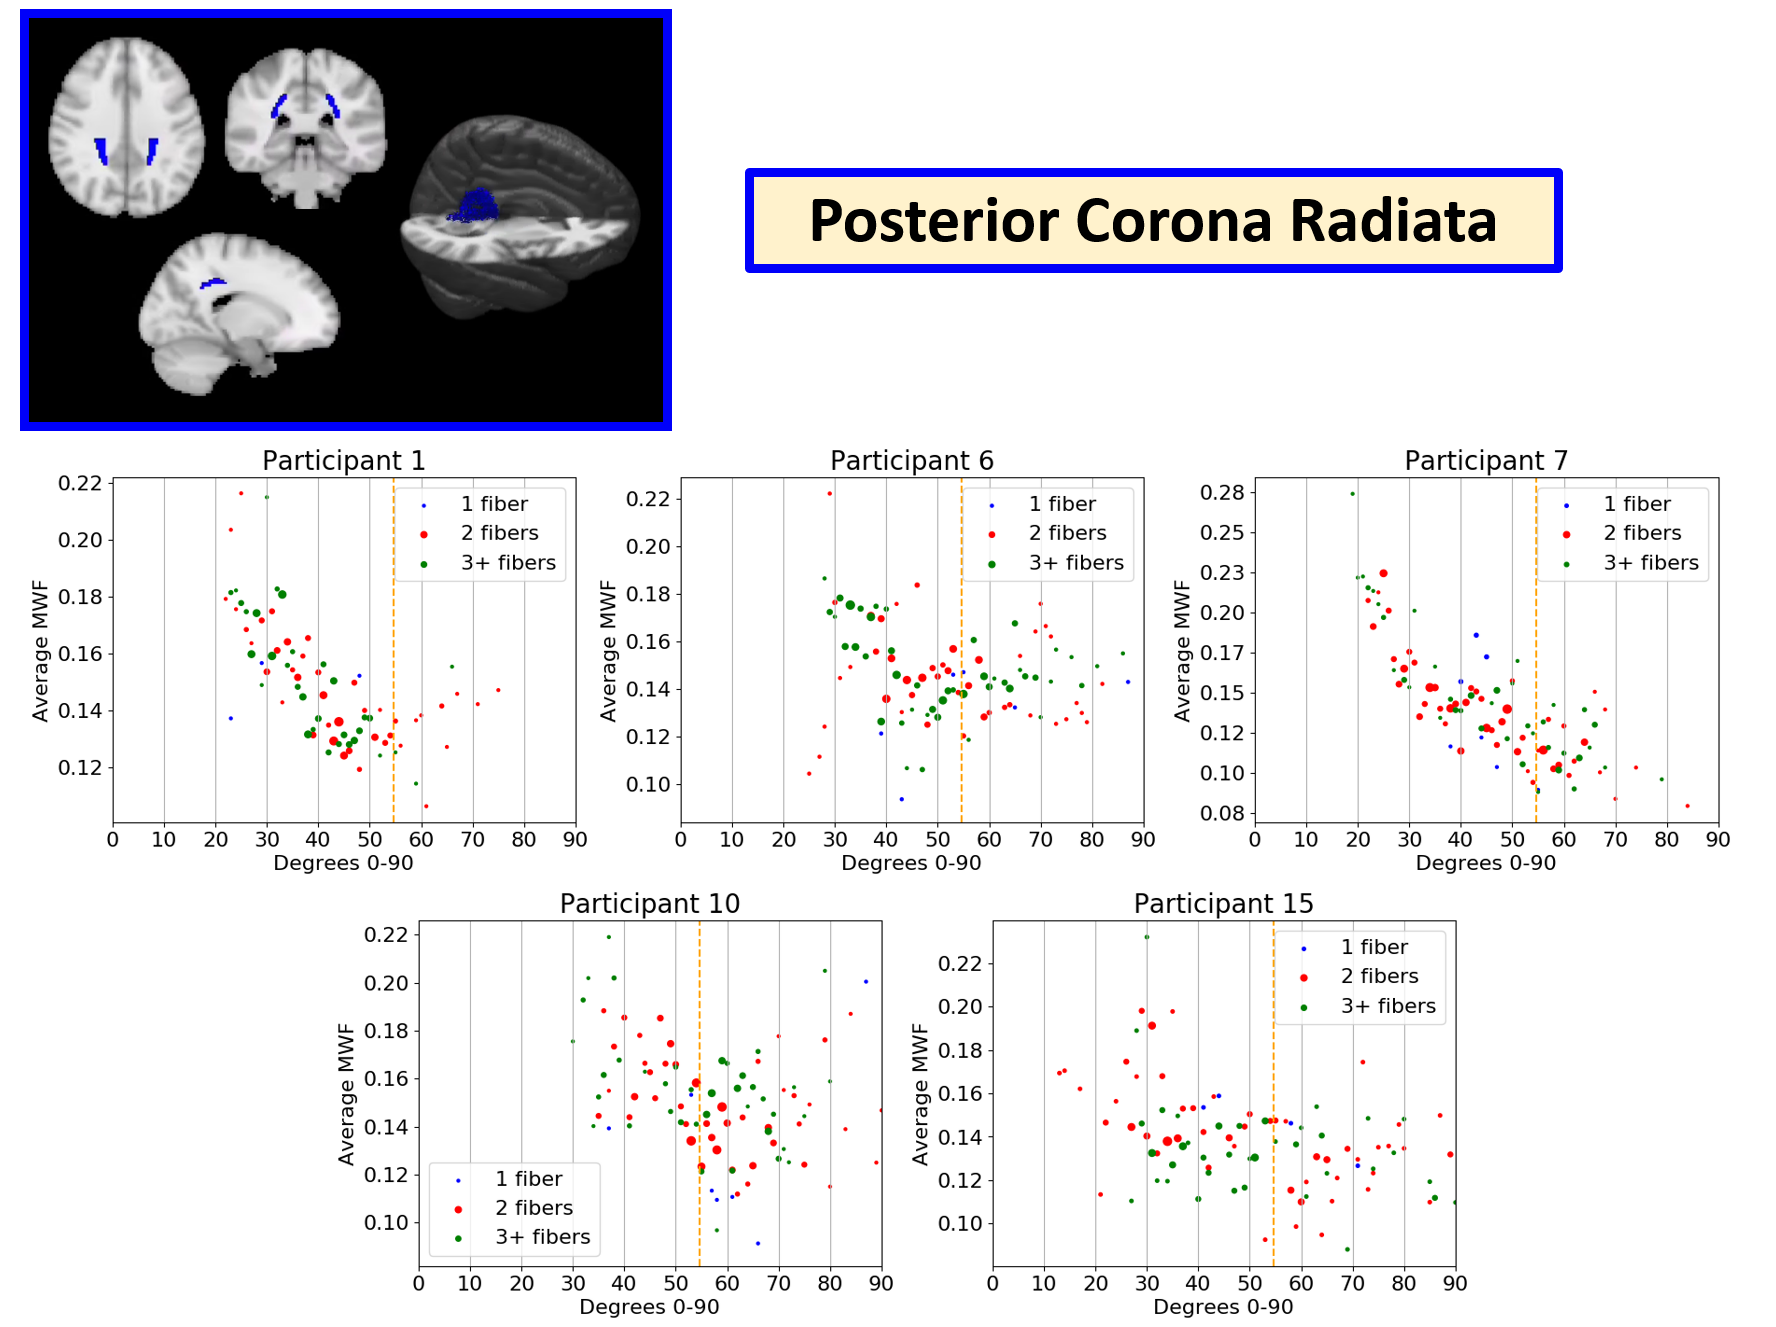
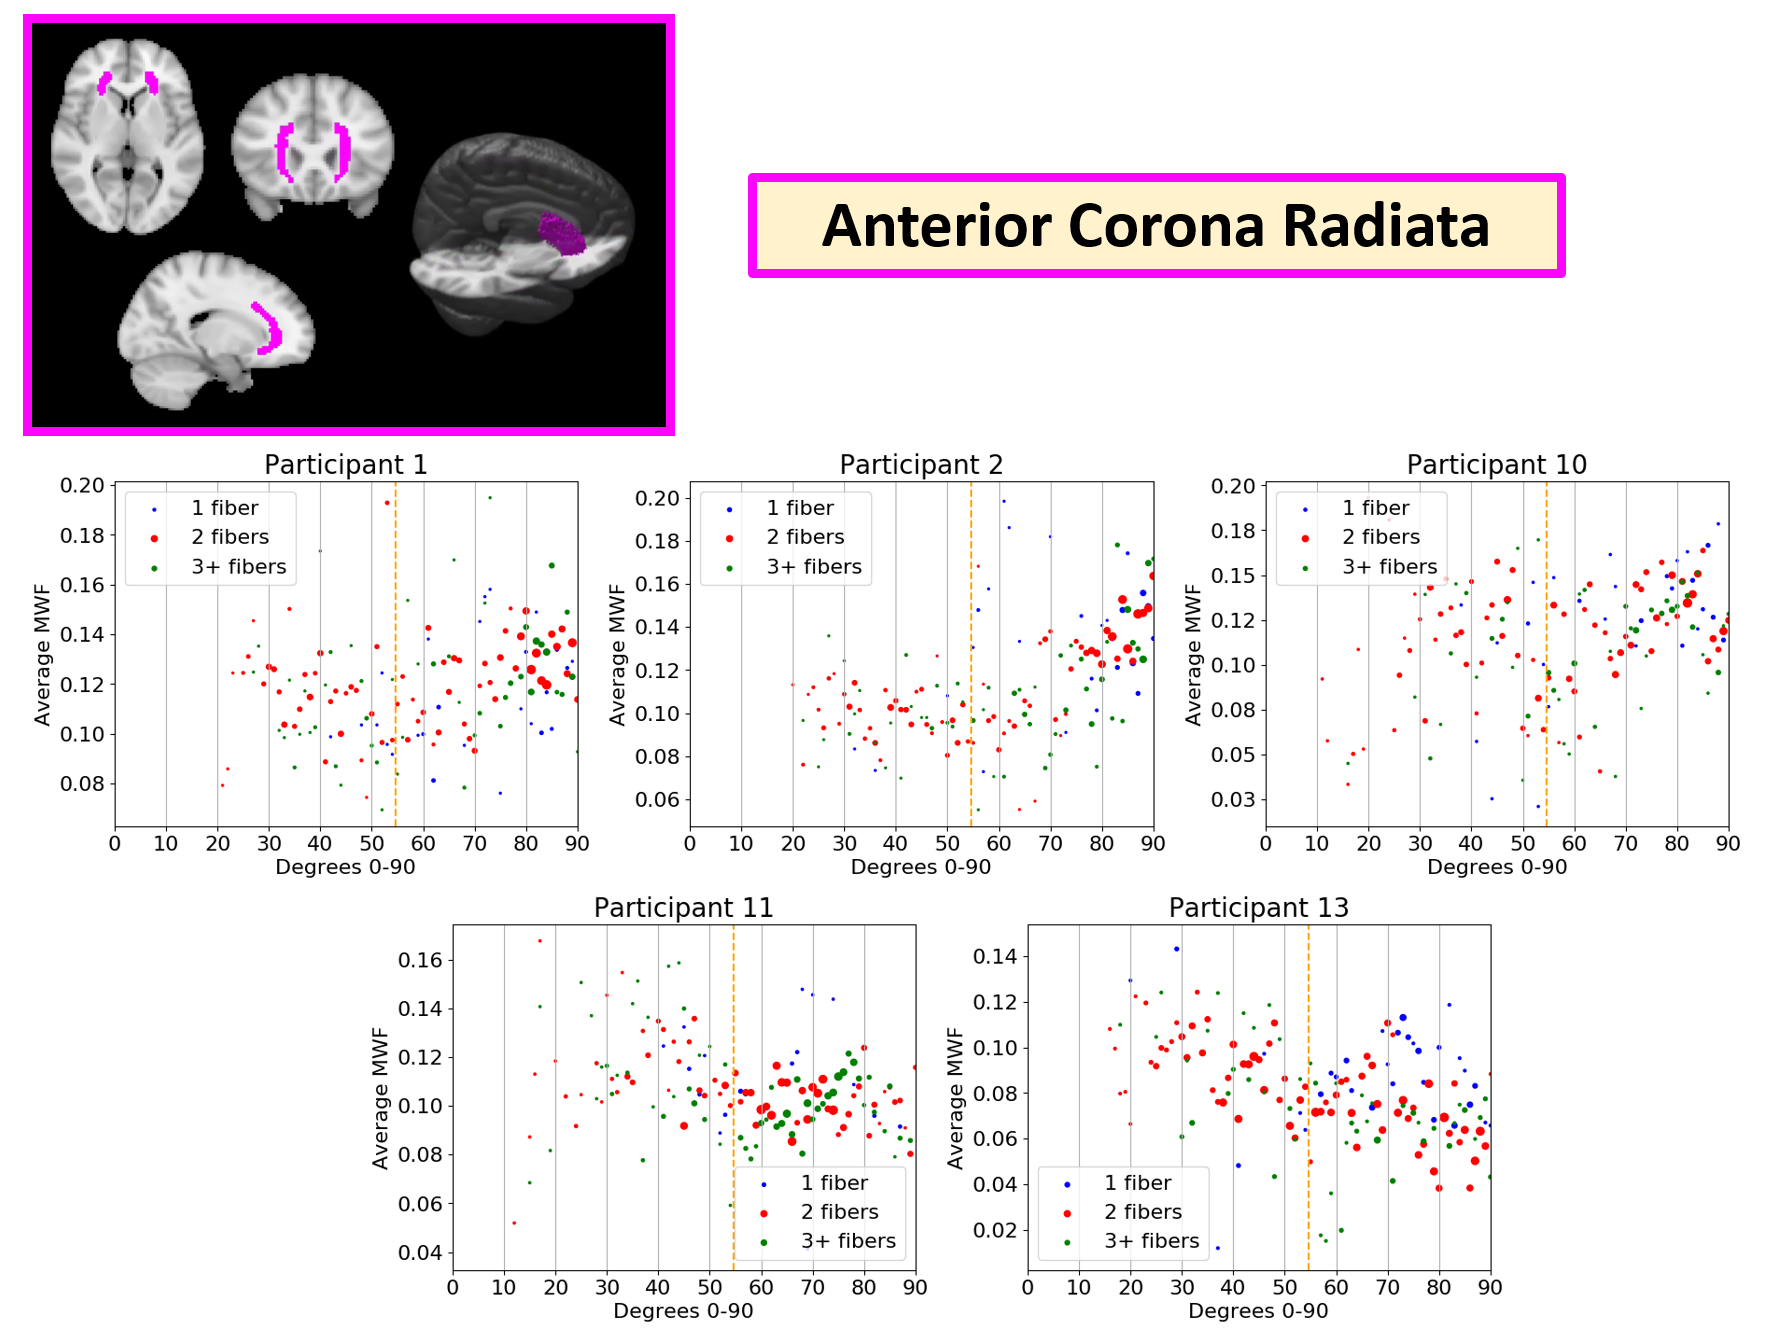
Example MWF vs. angle plots are shown in the Splenium of the Corpus Callosum (CCS) (Figure 3), Posterior Corona Radiata (PCR) (Figure 4), and Anterior Corona Radiata (ACR) (Figure 5). Overall, it was more difficult to see patterns in separate WM ROIs as they had fewer voxels and a smaller range of angles. Plots from 5 healthy participants in the CCS, PCR, and ACR are shown as they had enough voxels to see overarching trends and were representative of the trends in the whole dataset. In the CCS, most participants showed increasing MWF with angle (participants 4, 12, 13), while some showed a scattered (participant 5) and flat appearance (participant 8). Most PCR plots showed a downwards trend in MWF vs. angle (participants 1,7), while a few showed more scattered distributions (participants 6, 10, 15). In the PCR, some participants had different angle ranges (participants 1 vs. 15), which may be contributing to differing trends between MWF and angle. This may be due to varying head positions of participants in the scanner. In the ACR, there were upwards trends (participant 1 and 2), flat scattered shapes (participant 10, 11) and downwards trends (participant 13). Most regions showed no difference between voxels with 1, 2, or 3+ fiber directions suggesting number of fiber directions does not impact the apparent orientation dependence of MWF.
Conclusion
Differences between participants in WM ROIs suggest that changes in MWF with fiber orientation may be partly due to real changes in myelin content. Similar trends between number of fiber curves in WM suggest that number of fibers has little effect on orientation dependence. Work by Alderson et al. looked at the effect of fiber orientation on MWF by rotating ex vivo brain tissue and found no consistent changes with MWF over 3 orientations17. Further work investigating the effect of orientation on MWF from actual myelin changes by moving participants’ heads in vivo and rotating ex vivo tissue samples with a larger sample of angles is needed.Acknowledgements
TSJ was funded by an endMS Master’s Studentship award from the Multiple Sclerosis Society of Canada. Thank you to the MRI technologists at the UBC MRI Research Center. This work was conducted on the traditional, ancestral, and unceded (stolen) territories of Coast Salish Peoples, including the territories of the xwməθkwəy̓əm (Musqueam), Skwxwú7mesh (Squamish), Stó:lō and Səl̓ílwətaʔ/Selilwitulh (Tsleil- Waututh) Nations. As settler scholars who live and work on this land, we think its important to continue work understanding and dismantling how educational institutions participate in colonization.References
1. Vavasour IM, Huijskens SC, Li DK, et al. Global loss of myelin water over 5 years in multiple sclerosis normal-appearing white matter. Mult Scler J. 2018;24(12):1557-1568. doi:10.1177/1352458517723717
2. Wright AD, Jarrett M, Vavasour I, et al. Myelin Water Fraction Is Transiently Reduced after a Single Mild Traumatic Brain Injury – A Prospective Cohort Study in Collegiate Hockey Players. PLOS ONE. 2016;11(2):e0150215. doi:10.1371/journal.pone.0150215
3. Borich MR, MacKay AL, Vavasour IM, Rauscher A, Boyd LA. Evaluation of white matter myelin water fraction in chronic stroke. NeuroImage Clin. 2013;2:569-580. doi:10.1016/j.nicl.2013.04.006
4. Birkl C, Doucette J, Fan M, Hernández-Torres E, Rauscher A. Myelin water imaging depends on white matter fiber orientation in the human brain. Magn Reson Med. 2021;85(4):2221-2231. doi:10.1002/mrm.28543
5. Ercan E, Varma G, Mädler B, et al. Microstructural correlates of 3D steady-state inhomogeneous magnetization transfer (ihMT) in the human brain white matter assessed by myelin water imaging and diffusion tensor imaging. Magn Reson Med. 2018;80(6):2402-2414. doi:10.1002/mrm.27211
6. Jeurissen B, Leemans A, Tournier JD, Jones DK, Sijbers J. Investigating the prevalence of complex fiber configurations in white matter tissue with diffusion magnetic resonance imaging. Hum Brain Mapp. 2013;34(11):2747-2766. doi:10.1002/hbm.22099
7. Oshio K, Feinberg DA. GRASE (Gradient- and spin-echo) imaging: a novel fast MRI technique. Magn Reson Med. 1991;20(2):344-349. doi:10.1002/mrm.1910200219
8. Wang Y, Wang Q, Haldar JP, et al. Quantification of increased cellularity during inflammatory demyelination. Brain J Neurol. 2011;134(Pt 12):3590-3601. doi:10.1093/brain/awr307
9. Whittall KP, MacKay AL. Quantitative interpretation of NMR relaxation data. J Magn Reson 1969. 1989;84(1):134-152. doi:10.1016/0022-2364(89)90011-5
10. Prasloski T, Mädler B, Xiang QS, MacKay A, Jones C. Applications of stimulated echo correction to multicomponent T2 analysis. Magn Reson Med. 2012;67(6):1803-1814. doi:10.1002/mrm.23157
11. Jenkinson M, Beckmann CF, Behrens TEJ, Woolrich MW, Smith SM. FSL. NeuroImage. 2012;62(2):782-790. doi:10.1016/j.neuroimage.2011.09.015
12. Behrens TEJ, Woolrich MW, Jenkinson M, et al. Characterization and propagation of uncertainty in diffusion-weighted MR imaging. Magn Reson Med. 2003;50(5):1077-1088. doi:10.1002/mrm.10609
13. Behrens TEJ, Berg HJ, Jbabdi S, Rushworth MFS, Woolrich MW. Probabilistic diffusion tractography with multiple fibre orientations: What can we gain? NeuroImage. 2007;34(1):144-155. doi:10.1016/j.neuroimage.2006.09.018
14. Zhang Y, Brady M, Smith S. Segmentation of brain MR images through a hidden Markov random field model and the expectation-maximization algorithm. IEEE Trans Med Imaging. 2001;20(1):45-57. doi:10.1109/42.906424
15. Andersson J, Jenkinson M, Smith S. Non-linear registration aka spatial normalisation FMRIB Technial report TR07JA2. FMRIB technical report TR07JA2. 2010.
16. Mori S, Wakana S, Nagae-Poetscher LM, van Zijl PCM. MRI Atlas of Human White Matter. AJNR Am J Neuroradiol. 2006;27(6):1384-1385.
17. Alderson H, Does M. Orientation Dependence of Myelin Water Fraction as Measured by MET2. ISMRM 2022 abstract# 2860.
Figures