4309
Mapping Myelin Volume Fraction using Multiple Echo Gradient Echo and Dictionary Matching1Electrical and Computer Engineering, Cornell University, Ithaca, NY, United States, 2Department of Radiology, Weill Cornell Medicine, New York, NY, United States, 3Biomedical Engineering, Cornell University, Ithaca, NY, United States
Synopsis
Keywords: Microstructure, White Matter
Myelin Volume Fraction (MVF) is an important biomarker of demyelination various diseases Multiple Sclerosis. In this study, we propose a method that provides quantitative MVF maps from routine multiple echo gradient echo acquisitions and dictionary matching. The dictionary is generated using the Hollow Cylindrical Fiber Model (HCFM) and employs both the magnitude signal decay and QSM obtained from the mGRE phase. The obtained maps show both qualitative and quantitative superiority over the standard multiexponential fitting-based myelin water fraction (MWF) maps.Introduction
Myelin Water Imaging (MWI) is of great interest in clinical research since it provides quantitative information for the longitudinal screening of diseases such as Multiple Sclerosis (MS), and schizophrenia1,2. MWI is a technique that is focused on the relative water content of the myelin sheath in a voxel. Myelin Volume Fraction (MVF), on the other hand, is the relative volume ratio of the myelin sheath of the white matter axons in a voxel. Although there are established methods for Myelin Water Imaging3, extracting the MVF from MRI is challenging since only water protons generate signal4. A realistic biophysical model that covers both the susceptibility and the water content based on the Hollow Cylindrical Fiber Model (HCFM), has been proposed to map MVF by assuming that myelin sheaths are infinitely long hollow cylinders5,6 and using MR fingerprinting7. In this study, to improve this approach, we propose several modifications to answer each of the listed limitations. Firstly, the simulated model is extended to 3D to obtain more realistic signal decay behavior. Secondly, an isotropic positive susceptibility distribution is added to simulate diffuse iron sources. Finally, Quantitative Susceptibility Maps (QSM) are also employed in the dictionary matching to improve the matching process8.Methods
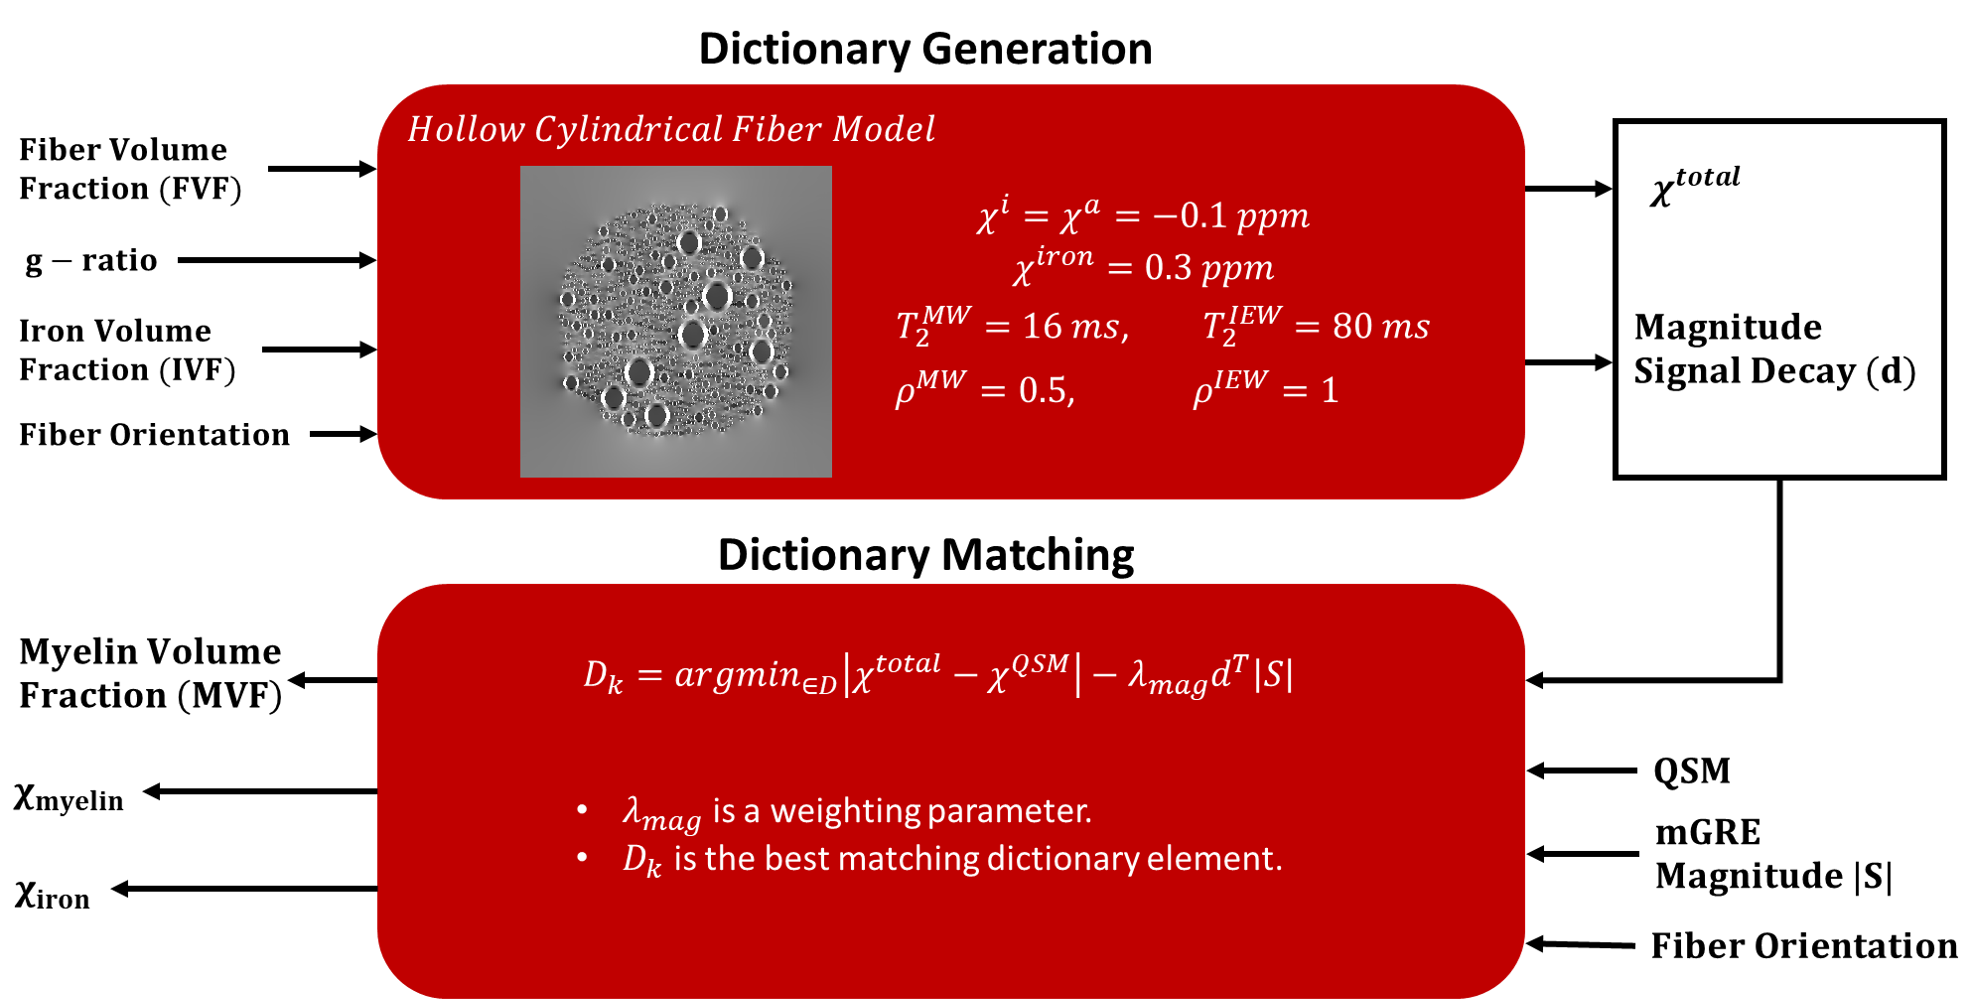
Dictionary GenerationA dictionary of mGRE magnitude signal evolutions is generated by numerical simulations based on HCFM. The simulation incorporates different microstructural distributions of the white matter fibers. Each simulation starts with a 2D fiber distribution and the corresponding magnetic field is computed according to9. This distribution is extended to 3D by exploiting the fact that the field distribution is constant in the fiber direction. An iron volume distribution is generated in the extracellular space to imitate the positive susceptibility sources in tissues. Finally, the field perturbations produced by all sources are superposed and a corresponding magnitude signal decay is generated. The details of the model and the constant parameters are presented in Figure 1.
Dictionary Matching
The microstructural properties (MVF, iron, and myelin susceptibility distributions) of each voxel are determined by a dictionary search using the following cost function
$$D_k=\underset{\in{D}}{\operatorname{argmin}}|\chi^{total}-\chi^{QSM}|-\lambda_{max}d^T|S|\;\;\;\;\;given\;\;\;\;\;\theta_k=\theta$$
Here, $$$\chi^{total}$$$ and $$$\chi^{QSM}$$$ are the total susceptibility of the dictionary element and the voxel, respectively. $$$d$$$ and $$$|S|$$$ are the normalized magnitude signal evolutions of the dictionary element and the voxel, respectively. $$$\lambda_{mag}$$$ is a weighting parameter. $$$D_k$$$ is the best matching dictionary element that minimizes the cost function. $$$\theta_k$$$ is the fiber orientation of the dictionary element and $$$\theta$$$ is the average fiber orientation of the voxel obtained from either a separate DTI scan or a DTI Atlas-based fiber orientation map can be utilized. ICBM DTI-81 atlas is utilized in this study9. Finally, the obtained maps were smoothed with a Gaussian kernel with a width of $$$5\times5\times5$$$.
Data Acquisition and Analysis
For the evaluation of the proposed method for the myelin quantification, 8 healthy subjects were scanned on a 3T MRI scanner (Prisma, Siemens, Erlangen, Germany). The protocol consisted of the following scans: Whole-brain T1 scan using MPRAGE (1mm3 isotropic), monopolar 3D mGRE with 7 Echoes (1x1x2mm3), monopolar 3D mGRE with 12 Echoes (1x1x2mm3), Single-Shot Spin-Echo EPI-DWI with 30 diffusion encoding directions and b=1000 s/mm2 (1.9x1.9x2.5mm3), and Fast acquisition with spiral trajectory and T2prep (FAST-T2)10 with 9 echoes (1.3x1.3x2mm3). The proposed algorithm is compared with the standard multi-exponential complex fitting-based Myelin Water Fraction (MWF) maps obtained from11. To match the acquisition time and correspondingly the SNR level of the MWF images presented in11, the 2nd mGRE acquisition is repeated 5 times and the acquired signals are averaged. Furthermore, two adjacent axial slices were averaged and the residual function is weighted by the magnitude of each echo as suggested in11. Additionally, two adjacent sagittal and coronal slices were also averaged to match the SNR in terms of the voxel size. The two methods are compared by linear regression analysis using MWF distribution obtained from multicomponent T2 relaxometry using multi-echo data from FAST-T2 acquisition. The analysis is conducted for the mean values of 15 ROIs for each subject.
Results and Discussion
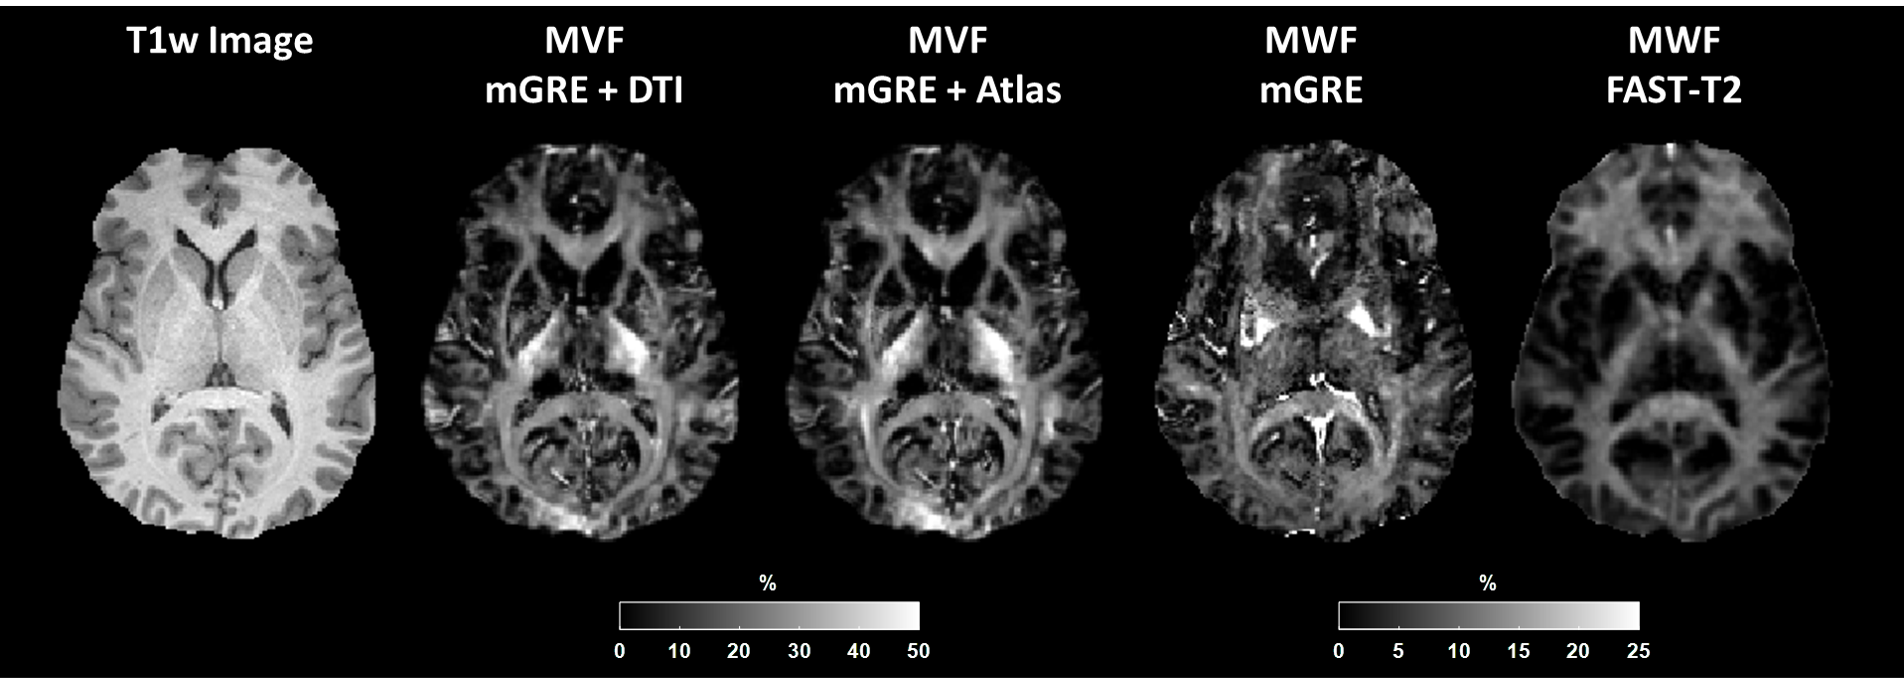
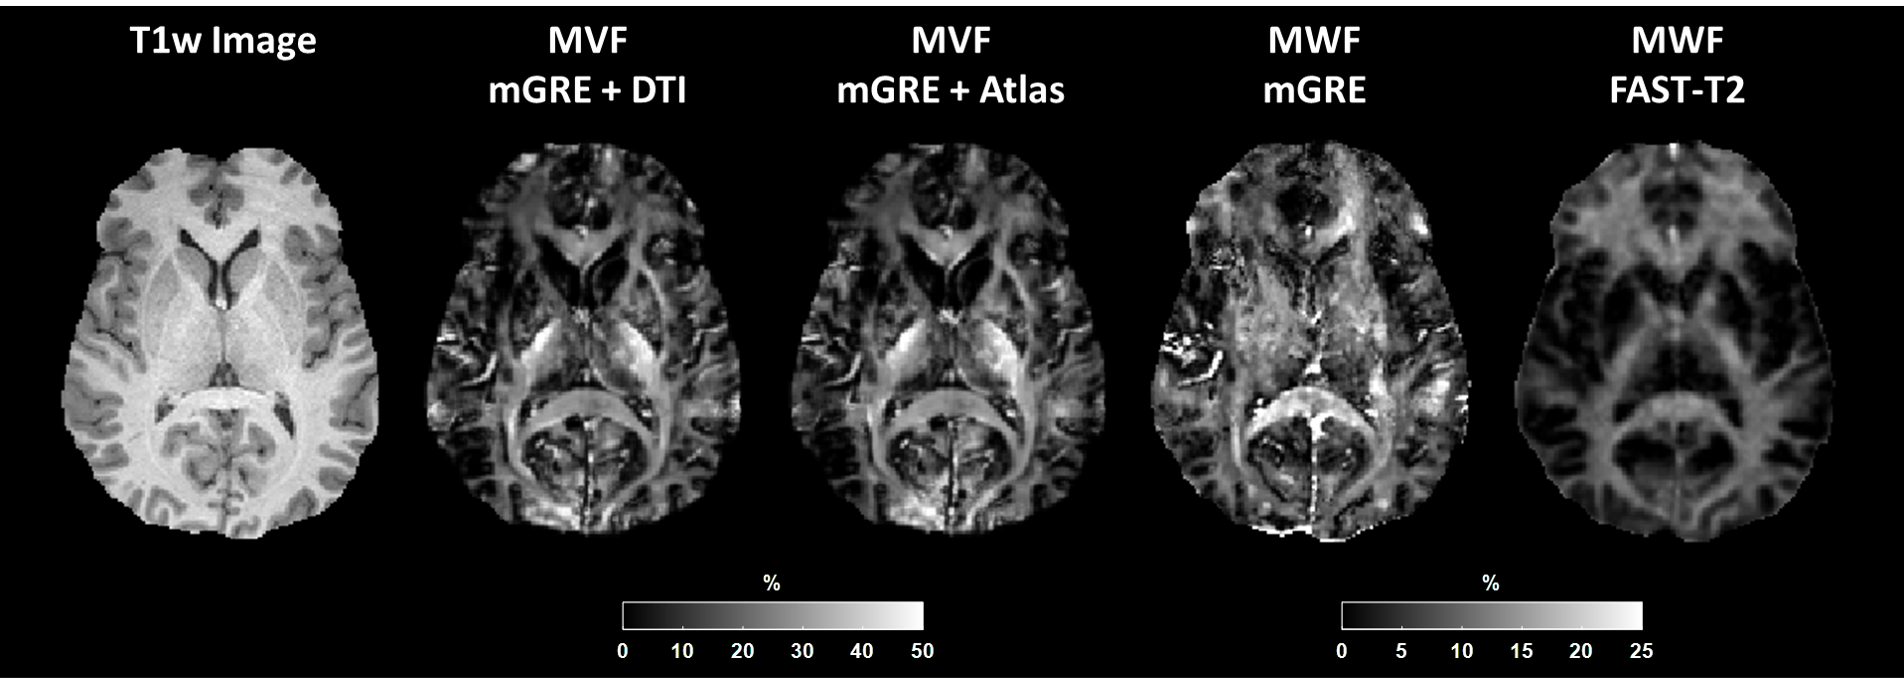
The images in one subject obtained using each method are presented in Figure 2 together with the corresponding T1w image for 7 Echo acquisition. The results of the 12 echo acquisition are depicted in Figure 3.Figures 2 and 3 demonstrate the qualitative performance of the proposed method over the standard method. White matter depiction is improved with both DTI or atlas information when compared to the standard mGRE MWF.
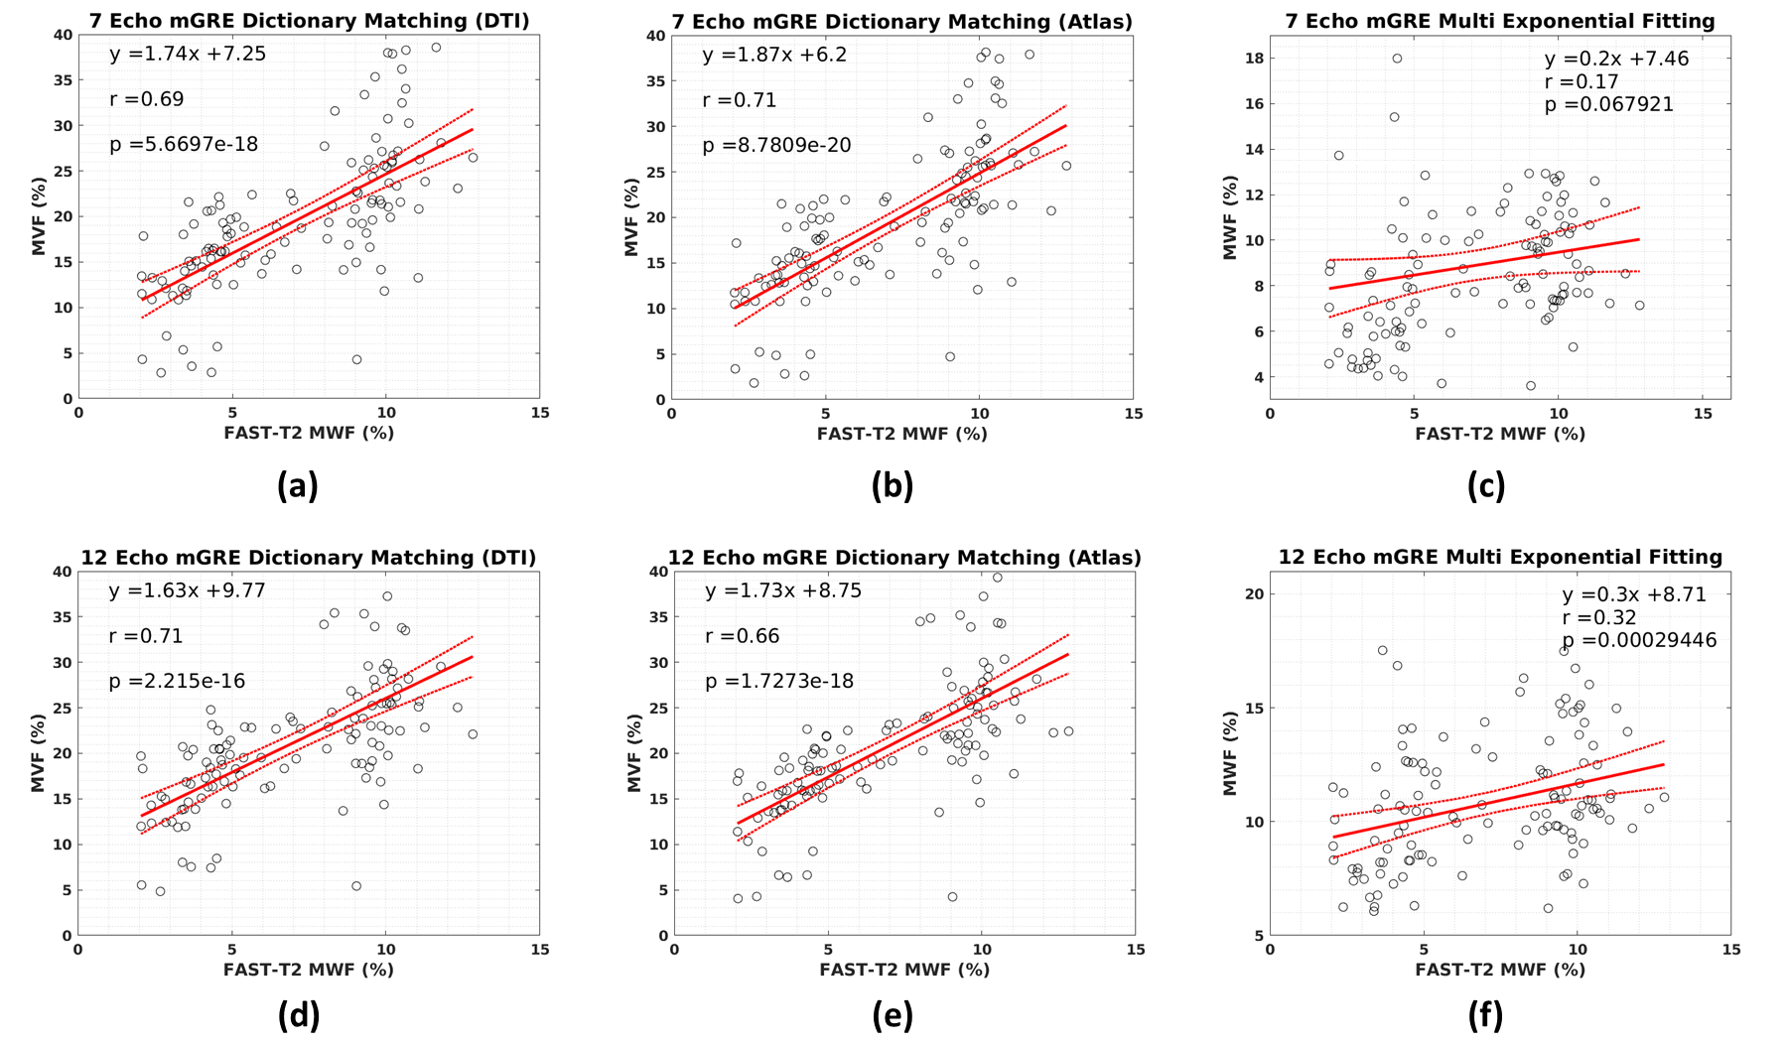
Figure 4 shows the correlation on an ROI basis between each method and the multi-component T2 relaxometry MWF maps. While all methods show a significant correlation with FAST-T2 MWF, MVF maps exhibit a stronger correlation compared to that of the standard MWF method.
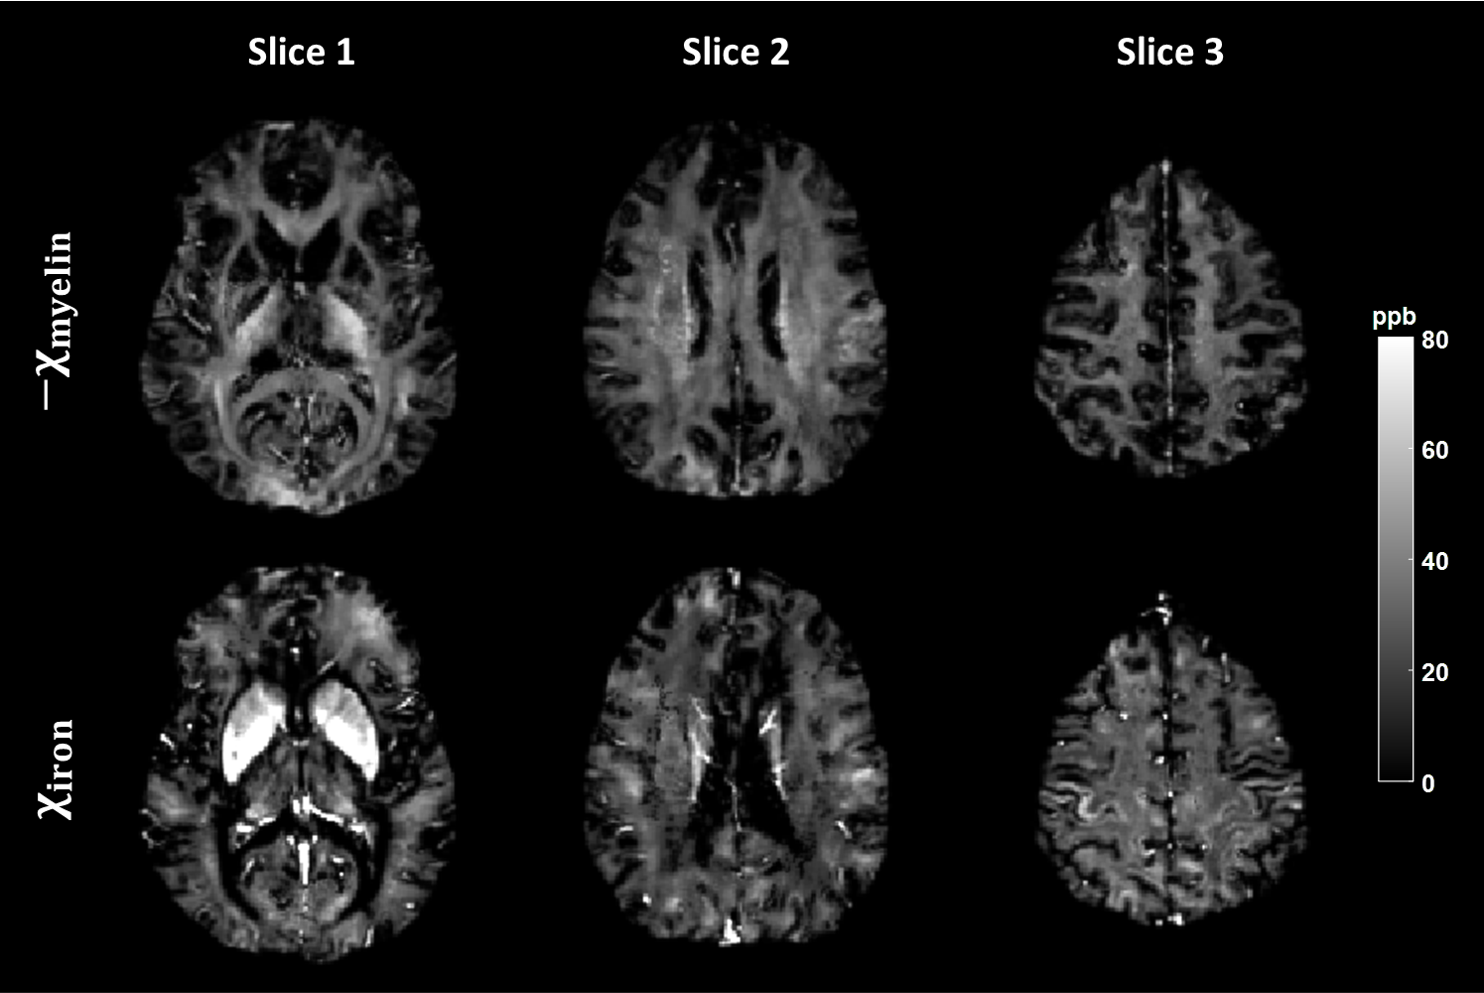
Figure 5 presents the myelin and iron susceptibility maps of a single subject.
Conclusion
The proposed method provides quantitative myelin fraction maps with a high correlation to myelin water fraction obtained using multicomponent T2 relaxometry.Acknowledgements
This work was supported in part by the NIH R01NS105144, and NMSS RR-1602-07671.
References
1. Mackay A, Whittall K, Adler J, Li D, Paty D, Graeb D. In vivo visualization of myelin water in brain by magnetic resonance. Magnetic resonance in medicine. 1994;31(6):673-677.
2. MacKay AL, Laule C. Magnetic resonance of myelin water: an in vivo marker for myelin. Brain plasticity 2. 2016;2(1):71-91.
3. Lee J, Hyun JW, Lee J, Choi EJ, Shin HG, Min K, Nam Y, Kim HJ, Oh SH. So you want to image myelin using MRI: an overview and practical guide for myelin water imaging. Journal of Magnetic Resonance Imaging. 2021;53(2):360-373.
4. West KL, Kelm ND, Carson RP, Gochberg DF, Ess KC. Myelin volume fraction imaging with MRI. Neuroimage. 2018;182:511-521.
5. Wharton S, Bowtell R. Fiber orientation-dependent white matter contrast in gradient echo MRI. Proceedings of the National Academy of Sciences. 2012;109(45):18559-18564.
6. Hédouin R, Metere R, Chan KS, Licht C, Mollink J, Van Walsum AMC, Marques JP. Decoding the microstructural properties of white matter using realistic models. NeuroImage. 2021;237:118138.
7. Ma D, Gulani V, Seiberlich N, Liu K, Sunshine,JL, Duerk JL, Griswold MA. Magnetic resonance fingerprinting. Nature. 2013 March;495(7440):187-192.
8. Wang Y, Liu T. Quantitative susceptibility mapping (QSM): decoding MRI data for a tissue magnetic biomarker. Magnetic resonance in medicine. 2015;73(1):82-101.
9. Mori S, Oishi K, Jiang H, Jiang L, Li X, Akhter K, Hua K, Faria AV, Mahmood A, Woods R, et al. Stereotaxic white matter atlas based on diffusion tensor imaging in an ICBM template. Neuroimage. 2008;40(2):570-582.
10. Nguyen TD, Deh K, Monohan, E. PS, Spincemaille P, Raj A, Wang Y, Gauthier SA. Feasibility and reproducibility of whole brain myelin water mapping in 4 minutes using fast acquisition with spiral trajectory and adiabatic T2prep (FAST‐T2) at 3T. Magnetic resonance in medicine. 2016;76(2):456-465.
11. Nam Y, Lee J, Hwang D, Kim DH. Improved estimation of myelin water fraction using complex model fitting. NeuroImage. 2015 214-221.
Figures