4295
Characterization of Cardiac Quantitative Susceptibility Mapping (QSM)1School of Biomedical Engineering and Imaging Sciences, King's College London, London, United Kingdom, 2MR Research Collaborations, Siemens Healthcare Limited, Camberley, United Kingdom
Synopsis
Keywords: Heart, Susceptibility
Cardiac Quantitative Susceptibility Mapping (QSM) is a promising technique for the evaluation of iron levels in the myocardium, particularly after a hemorrhagic infarction. In this abstract, we validate the accuracy of our QSM acquisition and reconstruction procedure in phantom experiments, and characterize its precision and repeatability in the myocardium in a healthy volunteer cohort. We found a strong linear relationship between the gadolinium concentration and measured susceptibility in the phantom. In vivo QSM precision and repeatability in the myocardium were 0.11±0.05 ppm and 0.02±0.02 ppm, respectively.Introduction
Cardiac quantitative susceptibility mapping (QSM) is a promising technique for the diagnosis and evaluation of several cardiac conditions1. One particular area of interest is the detection of iron. Compared to the current technique for iron quantification, T2* imaging, QSM may offer better specificity as it is not influenced by edema, collagen, and fat deposition, which can potentially cancel out the T2* shift from iron deposits. In one seminal study, QSM outperformed T2* for imaging hemorrhagic infarcts by identifying and quantifying the iron deposits in the core of infarcted tissue with susceptibility increases of up to 1 ppm2, which were missed by conventional imaging. Despite this, full characterization of the technique is currently lacking. In this study, we evaluate the accuracy of our method using phantom experiments, then study its in vivo precision and repeatability in healthy volunteers.Methods
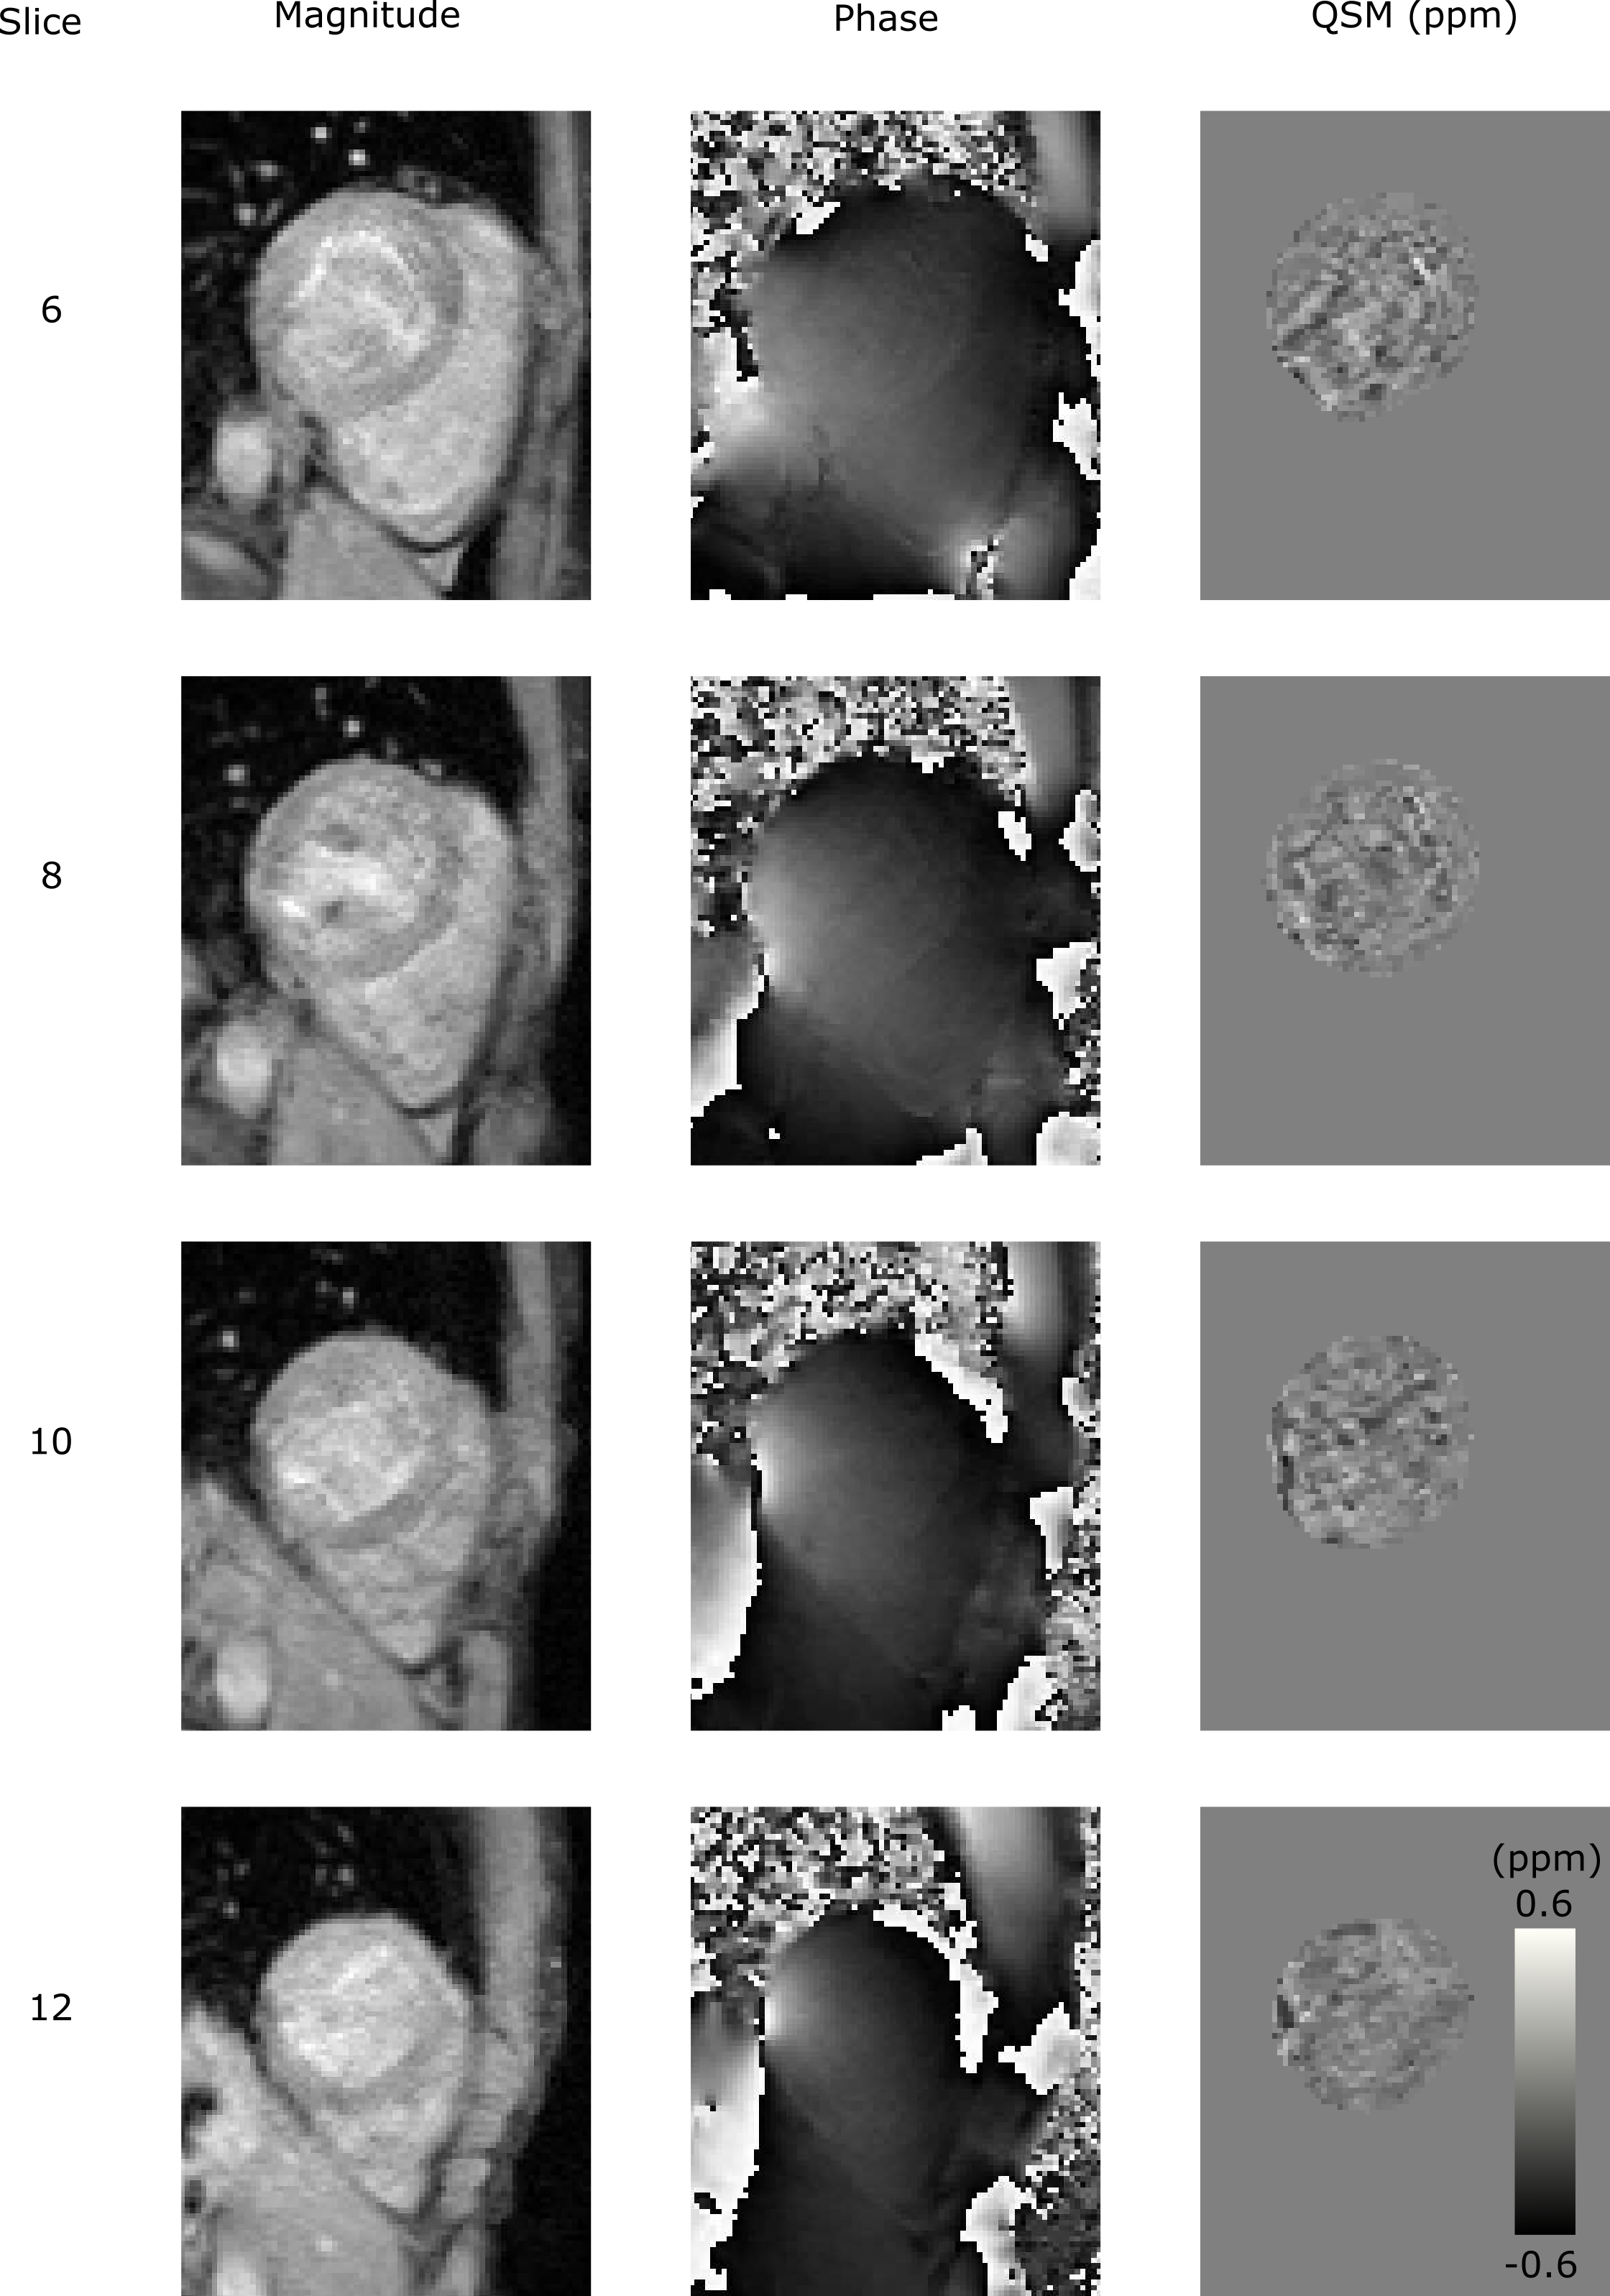
All experiments were performed on a 1.5T scanner (MAGNETOM Aera, Siemens Healthcare, Erlangen, Germany). QSM was performed using a prototype free-breathing diaphragmatic navigated 5-echo ECG-triggered 3D GRE sequence (TE1=3.2ms, ΔTE=2.9ms, FOV=288x384x100mm3, voxel size=1.5x1.5x5mm3, FA=15°, BW=543Hz/Px, segments=10, GRAPPA factor=2, partial Fourier=75%). Both magnitude and phase images were saved for each scan to allow QSM reconstruction.QSM maps were reconstructed using the MEDI toolbox3 in Matlab (R2019b). Phase images were unwrapped with a region growing algorithm4 and the local field was extracted with the projection onto dipole fields algorithm5. For the MEDI reconstruction, λ=1000 and zero-padding (to isotropic voxel size) were used.
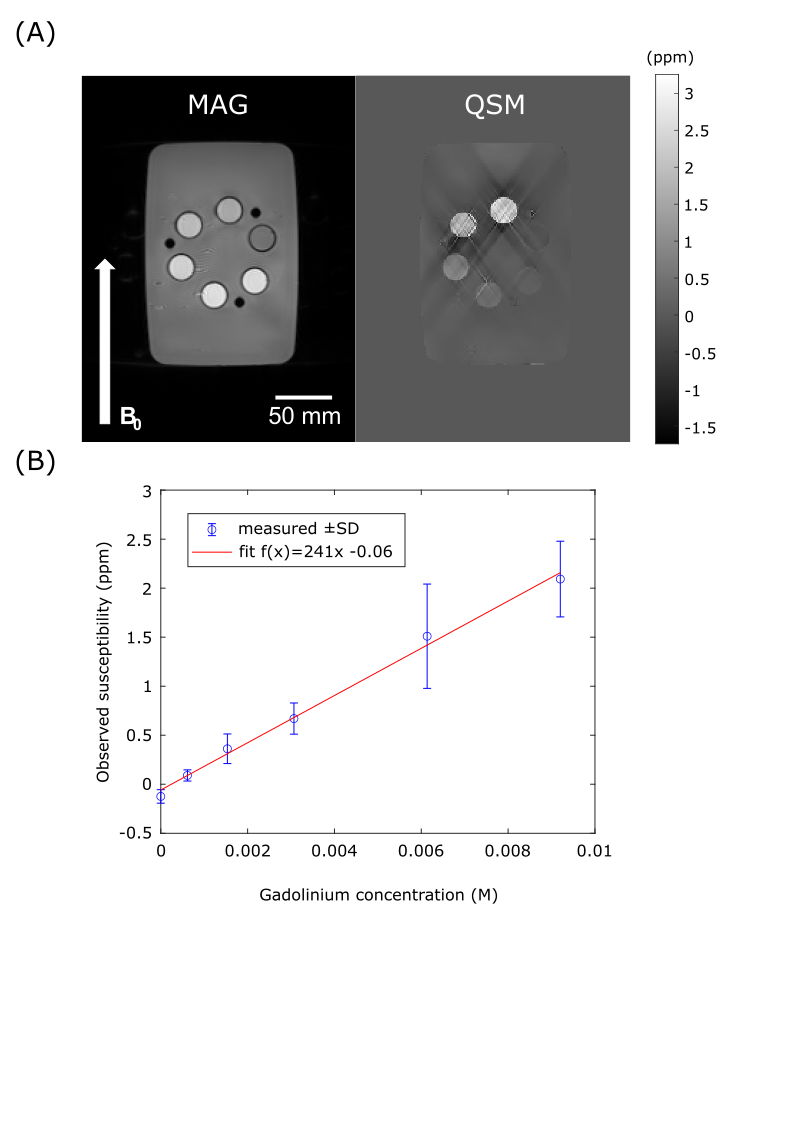
The accuracy of the technique was evaluated in a phantom consisting of six 50mL centrifuge tubes (Corning, Corning City, USA) in a water bath, each tube contained a different concentration of gadobutrol solution. The concentrations were 0, 0.61, 1.53, 3.07, 6.13, 9.20 mM/dm3 giving theoretical susceptibilities of 0, 0.2, 0.5, 1.0, 2.0, 3.0 ppm, respectively. The shim-box and reconstruction-ROI were set to the volume of the water bath. The mean and standard deviation of the voxels within ROI defined for each tube in a central slice (to avoid the large susceptibility shift, relative to water, of the acrylic tube stand which held the tubes at the top and bottom) were calculated, and fit with a linear model.
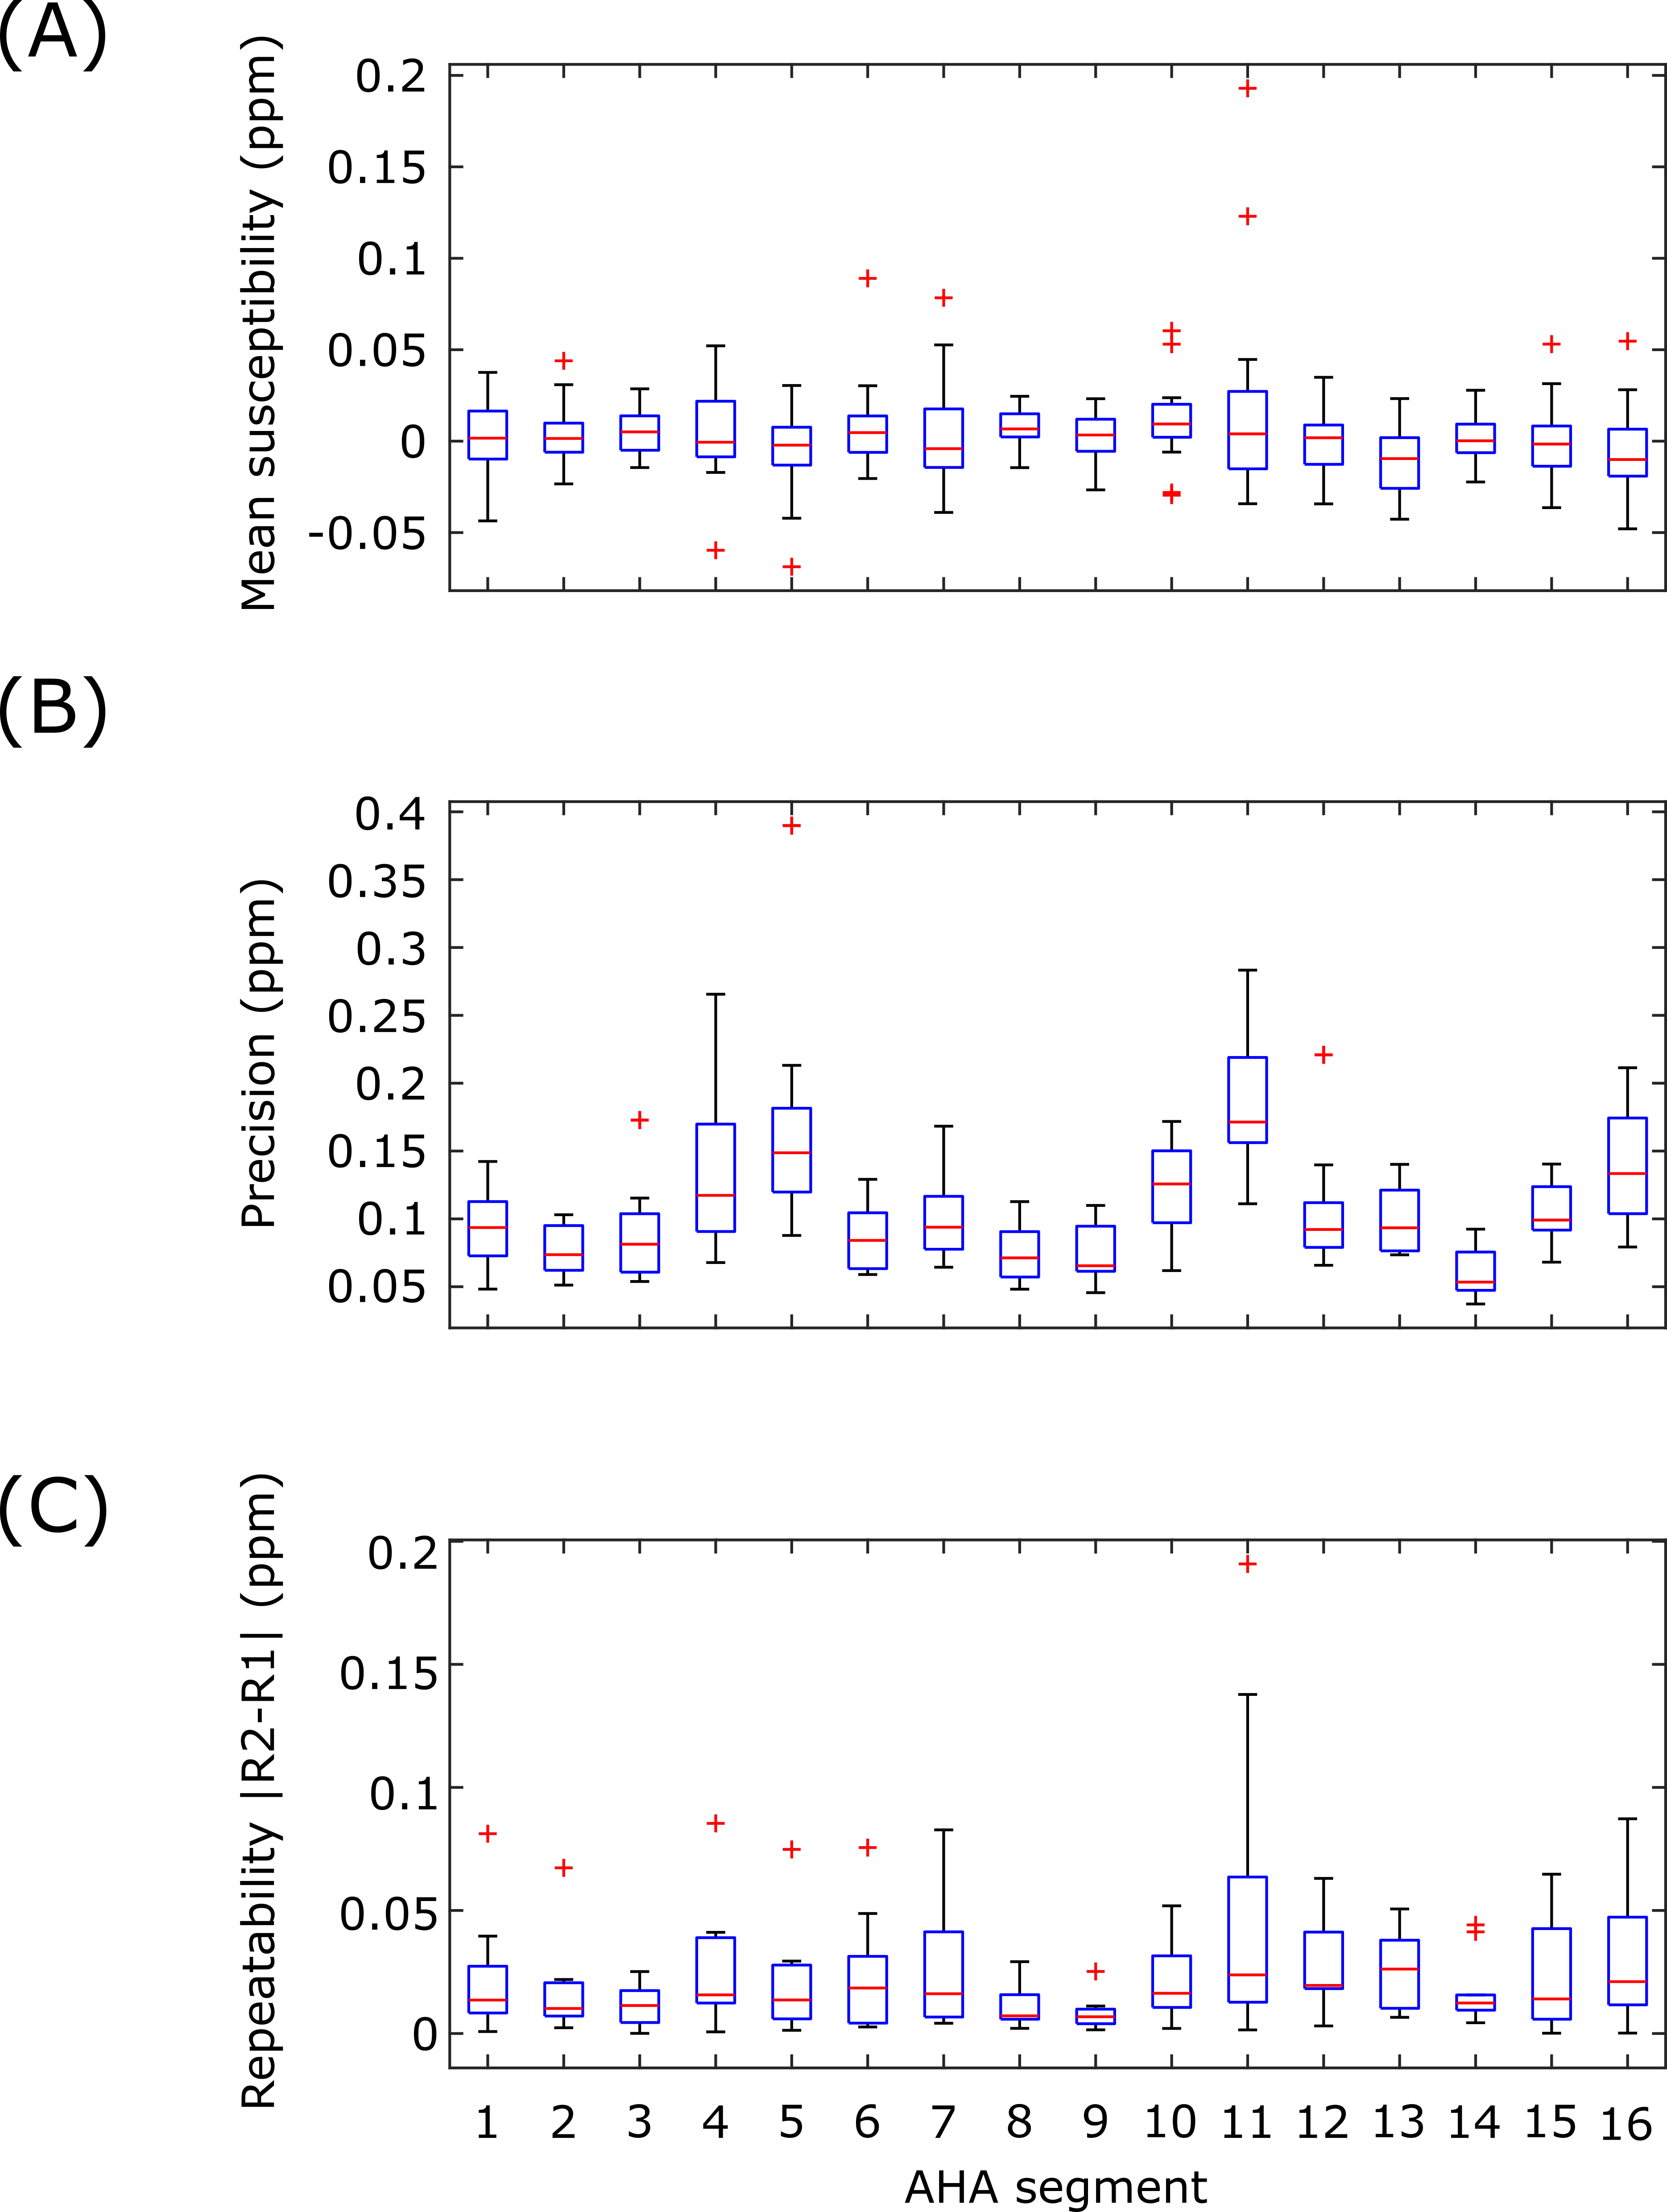
In-vivo precision and repeatability were characterized with a test-retest procedure in 10 healthy volunteers (5F/5M, Age=31±7Y, BMI=25±4kg/m2). Each subject was scanned twice with a short break outside of the scan room. Each session consisted of localizers and the GRE QSM scan in short-axis orientation with cardiac gating to diastasis. The reconstruction was performed with the ROI defined as the left ventricle (LV) including LV blood pool. The precision (spatial standard deviation) and inter-scan repeatability (absolute difference of both repeats) of the measured myocardial (excluding blood) susceptibility were measured using an AHA-16 segment model6.
Results
In the phantom experiments (Figure 1), measured susceptibility had a strong linear dependence on gadolinium concentration (R2=0.99). The tubes with higher gadolinium concentrations showed significant streaking artefacts, however these tubes had susceptibilities above the expected in vivo range2 (>1 ppm).The in vivo results are summarized in Figure 2 and 3. Across all segments, the mean inter-scan repeatability and precision across all segments were 0.02±0.02 ppm and 0.11±0.05 ppm, respectively. Both metrics however, were poorer in segments near the heart-lung-liver interface (segments #5 and #11), where a reduction in repeatability and precision was observed.
Discussion
The phantom results suggest that the susceptibilities returned by our method have a strong linear dependence on the true magnetic susceptibility, indicating that the method should show a linear response to iron deposits in vivo. The zero offset of the plot of phantom susceptibility, which was not predicted by theory, may be due to the susceptibility of the polypropylene tubes holding the gadobutrol solutions, especially given that the tube containing pure water also had this offset.The in-vivo results indicate that the method could be used effectively in vivo, with the inter-scan repeatability smaller (better) than the effect size for hemorrhagic infarct (0.5-1.0ppm2). The reduction in scan quality near the heart-lung-liver interface, due to field inhomogeneity, did affect the quality of the final QSM maps, with notably worse precision and inter-scan repeatability in this region than septal areas, although this may be offset through parameter optimization, and investigating the optimal shim strategy.
Conclusion
Cardiac QSM was successfully characterized in phantom and in vivo experiments. The in vivo repeatability and precision of QSM in the myocardium suggest this method has potential for different clinical scenarios such as iron levels assessment in a hemorrhagic infarct. Further clinical evaluation of the technique is now warranted.Acknowledgements
This work was supported by the Engineering and Physical Sciences Research Council (EPSRC) grant (EP/R010935/1), the British Heart Foundation (BHF) grants (PG/19/11/34243 and PG/21/10539), the Wellcome EPSRC Centre for Medical Engineering at King’s College London (WT 203148/Z/16/Z), the National Institute for Health Research (NIHR) Biomedical Research Centre based at Guy’s and St Thomas’ National Health Service (NHS) Foundation Trust and King’s College London. The views expressed are those of the authors and not necessarily those of the NHS, the NIHR or the Department of Health.References
1. Aimo et al. Quantitative susceptibility mapping (QSM) of the cardiovascular system: challenges and perspectives. J Cardiovasc Magn Reson 24, 48 (2022).
2. Moon et al. Iron imaging in myocardial infarction reperfusion injury. Nat Commun 11, 3273 (2020).
3. MEDI toolbox version 20200115 developed by Yi Wang’s group from Cornell MRI Research Lab: https://pre.weill.cornell.edu/mri/pages/qsm.html
4. Liu Tet al. Morphology enabled dipole inversion (MEDI) from a single-angle acquisition: comparison with COSMOS in human brain imaging. Magn Reson Med. 66(3):777-83 (2011).
5. Liu et al. A novel background field removal method for MRI using projection onto dipole fields (PDF). NMR Biomed. 24(9):1129-36 (2011).
6. Cerqueira MD et al. Standardized myocardial segmentation and nomenclature for tomographic imaging of the heart. A statement for healthcare professionals from the Cardiac Imaging Committee of the Council on Clinical Cardiology of the American Heart Association. Circulation. 2002 Jan 29;105(4):539-42
Figures