4292
Semi-Automated Rejection of Corrupted Images in Cardiac Diffusion Tensor Imaging1Leeds Institute of Cardiovascular and Metabolic Medicine, University of Leeds, Leeds, United Kingdom, 2Cardiff University Brain Research Imaging Centre (CUBRIC), Cardiff University, Cardiff, United Kingdom, 3Leeds Teaching Hospitals NHS Trust, Leeds, United Kingdom, 4Medical Radiation Physics, Clinical Sciences Lund, Lund University, Lund, Sweden
Synopsis
Keywords: Heart, Diffusion Tensor Imaging
Cardiac Diffusion Tensor Imaging (cDTI) is prone to imaging artefacts including distortion, signal dropout, and misregistration even after post-processing. We developed a method for image rejection based on a comparison between the observed images and the corresponding set of predicted images generated by tensor models fit to the observed data. A rejection threshold to exclude images from subsequent refitting of the tensor model can be chosen by the user with a simple graphical method.Introduction
Cardiac Diffusion Tensor Imaging (cDTI) can be used to investigate myocardial tissue structure by characterizing the diffusion of water. Imaging artefacts from uncompensated motion such as respiration or signal dropout cannot necessarily be corrected in post-processing, and it is common to remove such images from the dataset before final analysis. This quality control is usually done manually, which is time-consuming and prone to errors and inconsistencies. Previous work focusing on brain DTI has developed methods for detecting and correcting outlier images1 - 4. For cDTI, methods for image rejection utilizing automatic segmentation and the correlation between each image and the mean image have been proposed5. In this work, we sought to identify image outliers semi-automatically in order to make post-processing more reproducible and objective for cDTI.Methods
Data from a previous study6 was utilized to develop a post-processing pipeline in which the diffusion tensors are fit to the full set of cardiac DTI images. Images were rigidly registered and manual segmentation was performed to identify voxels on the myocardium. The correlation coefficient between each observed image and the corresponding image predicted from the tensor fit is calculated for myocardial voxels. These correlation coefficients are ordered from best (highest) to worse (lowest) and plotted in a graphical user interface (GUI). The user then selects the position of a correlation threshold that determines which images, with the worst correlation coefficients, are removed from the dataset. Finally, diffusion tensors are refit to the dataset without the poor-quality images.Results
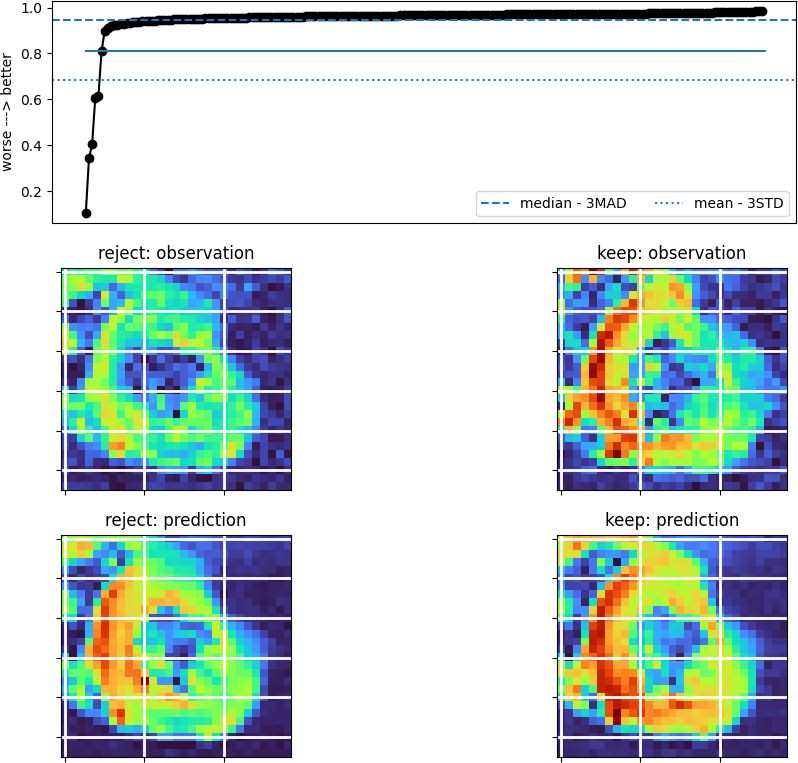
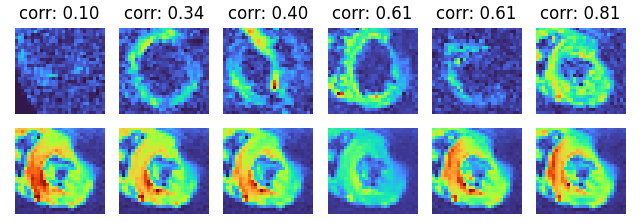
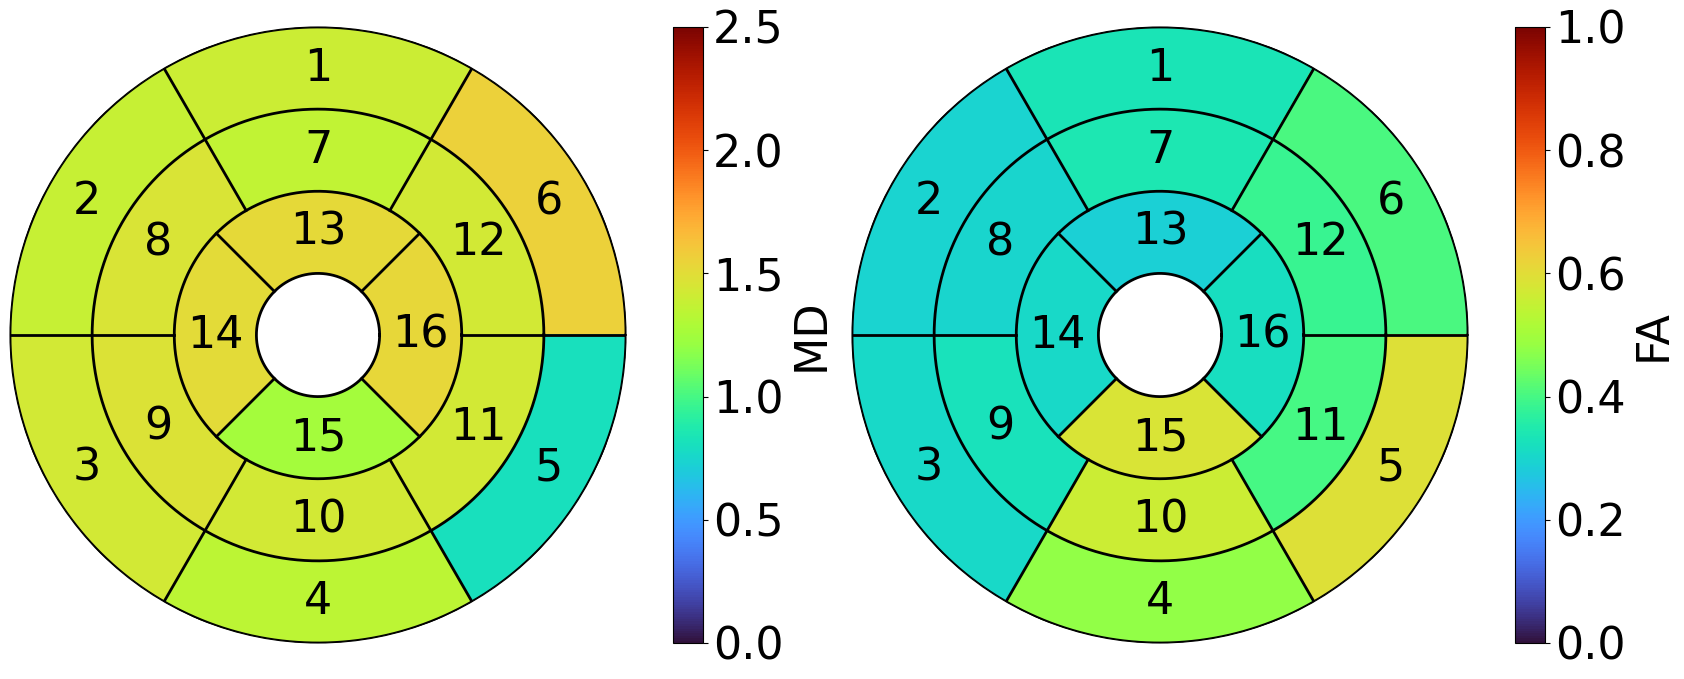
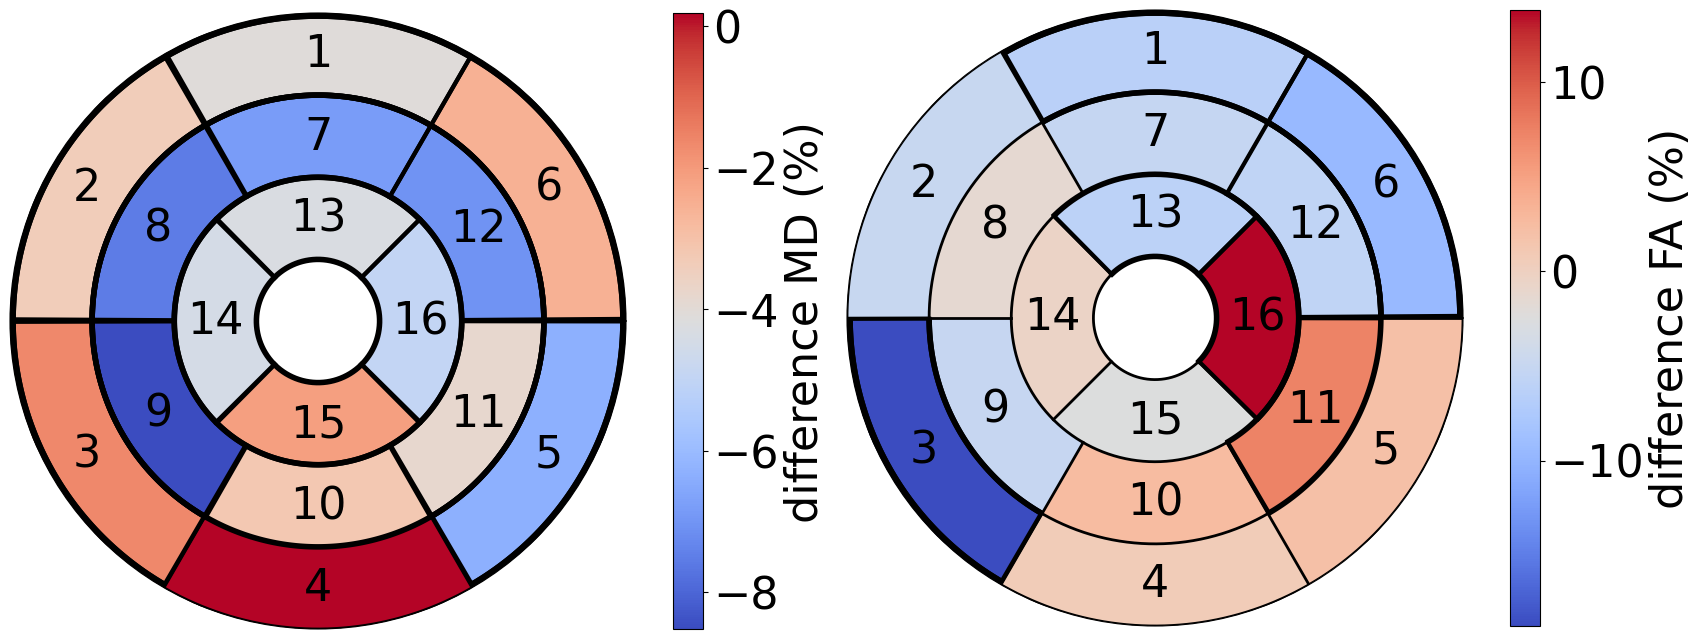
Figure 1 shows an example of our image rejection GUI. The majority of (good) images have a similar correlation coefficient, but a subset of images has significantly worse correlation coefficients. Since the correlation coefficients are ordered from best to worst, the threshold between good and bad images is defined by a sudden decrease in image quality. The position of the threshold can be determined by a user by clicking on the GUI or using the keyboard to place a threshold between the rejected subset and kept subset. This usually takes about 5-10 seconds per slice. Figure 2 shows the rejected images and the corresponding predicted images. Figure 3 shows MD and FA mean values per segment of the American Heart Association (AHA) segmentation model, for tensor fits in which rejected images were excluded. Figure 4 shows the differences for mean MD and FA per segment, for tensor fitting done with and without image rejection, as a percentage of values for no image rejection. The majority of segments have differences that are statistically significant (p < 0.05) as indicated in the caption of Figure 4.Discussion
The outlier detection algorithm is semi-automatic, since it currently requires a user to decide the threshold. The example dataset contains 216 images per slice for 3 slices, so manual image rejection taking only 1 second per image would still take over 3.5 minutes per slice, and results would not necessarily be reliable. Our method could be automated in the future using set thresholds based on median – 3 median absolute deviations (MAD) or mean – 3 standard deviations (STD) of the correlation, or by a more refined criterion. Given the variable quality of images from subject to subject, from scan to scan, and sequence to sequence, this semi-automatic procedure is a good compromise between full-automation and manual verification. It is difficult to verify results by comparison to manual identification, because the latter was found to be highly unreliable as a ground-truth. Comparing each observed image to its corresponding prediction removes bias that may arise from comparing images to a single reference image and assists the user in defining a threshold.While ‘robust’ tensor fitting methods that are less sensitive to outlier data have been developed and primarily tested for brain data7 - 9 misalignment of cardiac data will not necessarily be detected by such methods for all voxels in which the effect is present. Furthermore, removing entire corrupted images may still have important use cases, such as when averaging images to increase signal-to-noise ratio, prior to denoising, or as a pre-processing step for deep-learning methods.
Conclusion
We have developed a semi-automated image rejection algorithm for cardiac DTI that used the correlation coefficient between observed and predicted images.Acknowledgements
This work was supported by Wellcome Trust Investigator Award (219536/Z/19/Z).References
1. Niethammer, M., Bouix, S., Aja-Fernández, S., Westin, C.-F., & Shenton, M. E. (2007). Outlier Rejection for Diffusion Weighted Imaging. In N. Ayache, S. Ourselin, & A. Maeder (Eds.), Medical Image Computing and Computer-Assisted Intervention – MICCAI 2007 (pp. 161–168). Springer.
2. Zhou, Z., Liu, W., Cui, J., Wang, X., Arias, D., Wen, Y., Bansal, R., Hao, X., Wang, Z., Peterson, B. S., & Xu, D. (2011). Automated artifact detection and removal for improved tensor estimation in motion-corrupted DTI data sets using the combination of local binary patterns and 2D partial least squares. Magnetic Resonance Imaging, 29(2), 230–242.
3. Li, X., Yang, J., Gao, J., Luo, X., Zhou, Z., Hu, Y., Wu, E. X., & Wan, M. (2014). A Robust Post-Processing Workflow for Datasets with Motion Artifacts in Diffusion Kurtosis Imaging. PLoS ONE, 9(4), e94592.
4. Sairanen, V., Leemans, A., & Tax, C. M. W. (2018). Fast and accurate Slicewise OutLIer Detection (SOLID) with informed model estimation for diffusion MRI data. NeuroImage, 181, 331–346.
5. Ferreira, P. F., Martin, R. R., Scott, A. D., Khalique, Z., Yang, G., Nielles-Vallespin, S., Pennell, D. J., & Firmin, D. N. (2020). Automating in vivo cardiac diffusion tensor postprocessing with deep learning–based segmentation. Magnetic Resonance in Medicine, 84(5), 2801–2814.
6. Das, A., Kelly, C., Teh, I., Nguyen, C., Brown, L. A. E., Chowdhary, A., Jex, N., Thirunavukarasu, S., Sharrack, N., Gorecka, M., Swoboda, P. P., Greenwood, J. P., Kellman, P., Moon, J. C., Davies, R. H., Lopes, L. R., Joy, G., Plein, S., Schneider, J. E., & Dall’Armellina, E. (2022). Phenotyping hypertrophic cardiomyopathy using cardiac diffusion magnetic resonance imaging: The relationship between microvascular dysfunction and microstructural changes. European Heart Journal. Cardiovascular Imaging, 23(3), 352–362.
7. Chang, L.-C., Jones, D. K., & Pierpaoli, C. (2005). RESTORE: Robust estimation of tensors by outlier rejection. Magnetic Resonance in Medicine, 53(5), 1088–1095.
8. Chang, L.-C., Walker, L., & Pierpaoli, C. (2012). Informed RESTORE: A method for robust estimation of diffusion tensor from low redundancy datasets in the presence of physiological noise artifacts: Informed RESTORE. Magnetic Resonance in Medicine, 68(5), 1654–1663.
9. Collier, Q., Veraart, J., Jeurissen, B., den Dekker, A. J., & Sijbers, J. (2015). Iterative reweighted linear least squares for accurate, fast, and robust estimation of diffusion magnetic resonance parameters: IRLLS for Estimation of Diffusion MR Parameters. Magnetic Resonance in Medicine, 73(6), 2174–2184.
Figures