4276
Identification of Imaging Marker for Tumor Tissue Composition in Rectal Carcinoma Using Dynamic Contrast-Enhance MRI
Jie YUAN1, Mengxiao Liu2, Songhua Zhan1, and Wenli Tan1
1Shuguang Hospital Affiliated to Shanghai University of Traditional Chinese Medicine, Shanghai, China, 2Siemens Healthineers Ltd, Shanghai, China
1Shuguang Hospital Affiliated to Shanghai University of Traditional Chinese Medicine, Shanghai, China, 2Siemens Healthineers Ltd, Shanghai, China
Synopsis
Keywords: Digestive, Cancer
Dynamic contrast-enhanced (DCE) MRI incorporates arterial input function and pharmacokinetic models to assess tissue perfusion, vasculature, capillary permeability, and interstitial space volume. It can be used to assess tumor vascularization, which can help determine tumor aggressiveness and the degree of angiogenesis and monitor therapy. However, the relationship between pathological characteristics of rectal cancer and the quantitative analysis of DCE remains unclear.Purpose
In this prospective study, we investigated the relationships between various tissue components (percentage of angiogenesis, nuclei of epithelial cells, nuclei of cancer cells, collagen fibers and mesenchymal cells) in rectal cancer and in vivo DCE MR imaging parameters.Patients and Methods
Twenty-four patients (median age, 65 years; age range, 35-82 years) provide informed consent for this study. Before undergoing total mesorectal excision, patients were examined with DCE-MRI. Quantitative parameters were calculated based on a modified Tofts model. Whole-mount immunohistochemistry and Masson staining sections were generated and digitized at histological resolution. The percentage area of tissue components was measured using image segmentation. Pearson correlation analysis was used to evaluate the correlations of pathology parameters with DCE MRI parameters.Results
On the WHO grading scale, significant differences were observed in Ktrans (F=9.890, P=0.001), MTT (F=9.890, P=0.038), CDX-2 (F=4.935, P=0.018) and Ki-67 (F=4.131, P=0.031) between G1, G2, and G3. The ECV showed significant differences in extramural venous invasion (t=-2.113, P=0.046). Ktrans showed a strong positive correlation with CD34 (r=0.708, P=0.000) and a moderate positive correlation with vimentin (r=0.450, P=0.027). Ve showed a moderate positive correlation with Masson’s (r=0.548, P=0.006) and vimentin (r=0.417, P=0.043). A moderate negative correlation was observed between Ve and CDX-2 (r=-0.441, P=0.031). Kep showed a strong positive correlation with CD34 expression (r=0.622, P=0.001). The ECV showed a moderate negative correlation with CDX-2 (r=-0.472, P=0.020) and a moderate positive correlation with collagen fibers (r=0.558, P=0.005).Conclusions
Dynamic contrast-enhanced MRI-derived parameters measured in rectal cancer were significantly related to the proportion of histological components. This may serve as an optimal imaging biomarker for the identification of tumor tissue components.Acknowledgements
Conflict of Interest declaration The authors declare that they have NO affiliations with or involvement in any organization or entity with any financial interest in the subject matter or materials discussed in this manuscript.References
1. Dijkhoff RAP, Beets-Tan RGH, Lambregts DMJ, Beets GL, Maas M. Value of DCE-MRI for staging and response evaluation in rectal cancer: A systematic review. Eur J Radiol. 2017 Oct;95:155-168. doi: 10.1016/j.ejrad.2017.08.009.
2. Fusco R, Granata V, Sansone M, Rega D, Delrio P, Tatangelo F, Romano C, Avallone A, Pupo D, Giordano M, Grassi R, Ravo V, Pecori B, Petrillo A. Validation of the standardized index of shape tool to analyze DCE-MRI data in the assessment of neo-adjuvant therapy in locally advanced rectal cancer. Radiol Med. 2021 Aug;126(8):1044-1054. doi: 10.1007/s11547-021-01369-1.
Figures
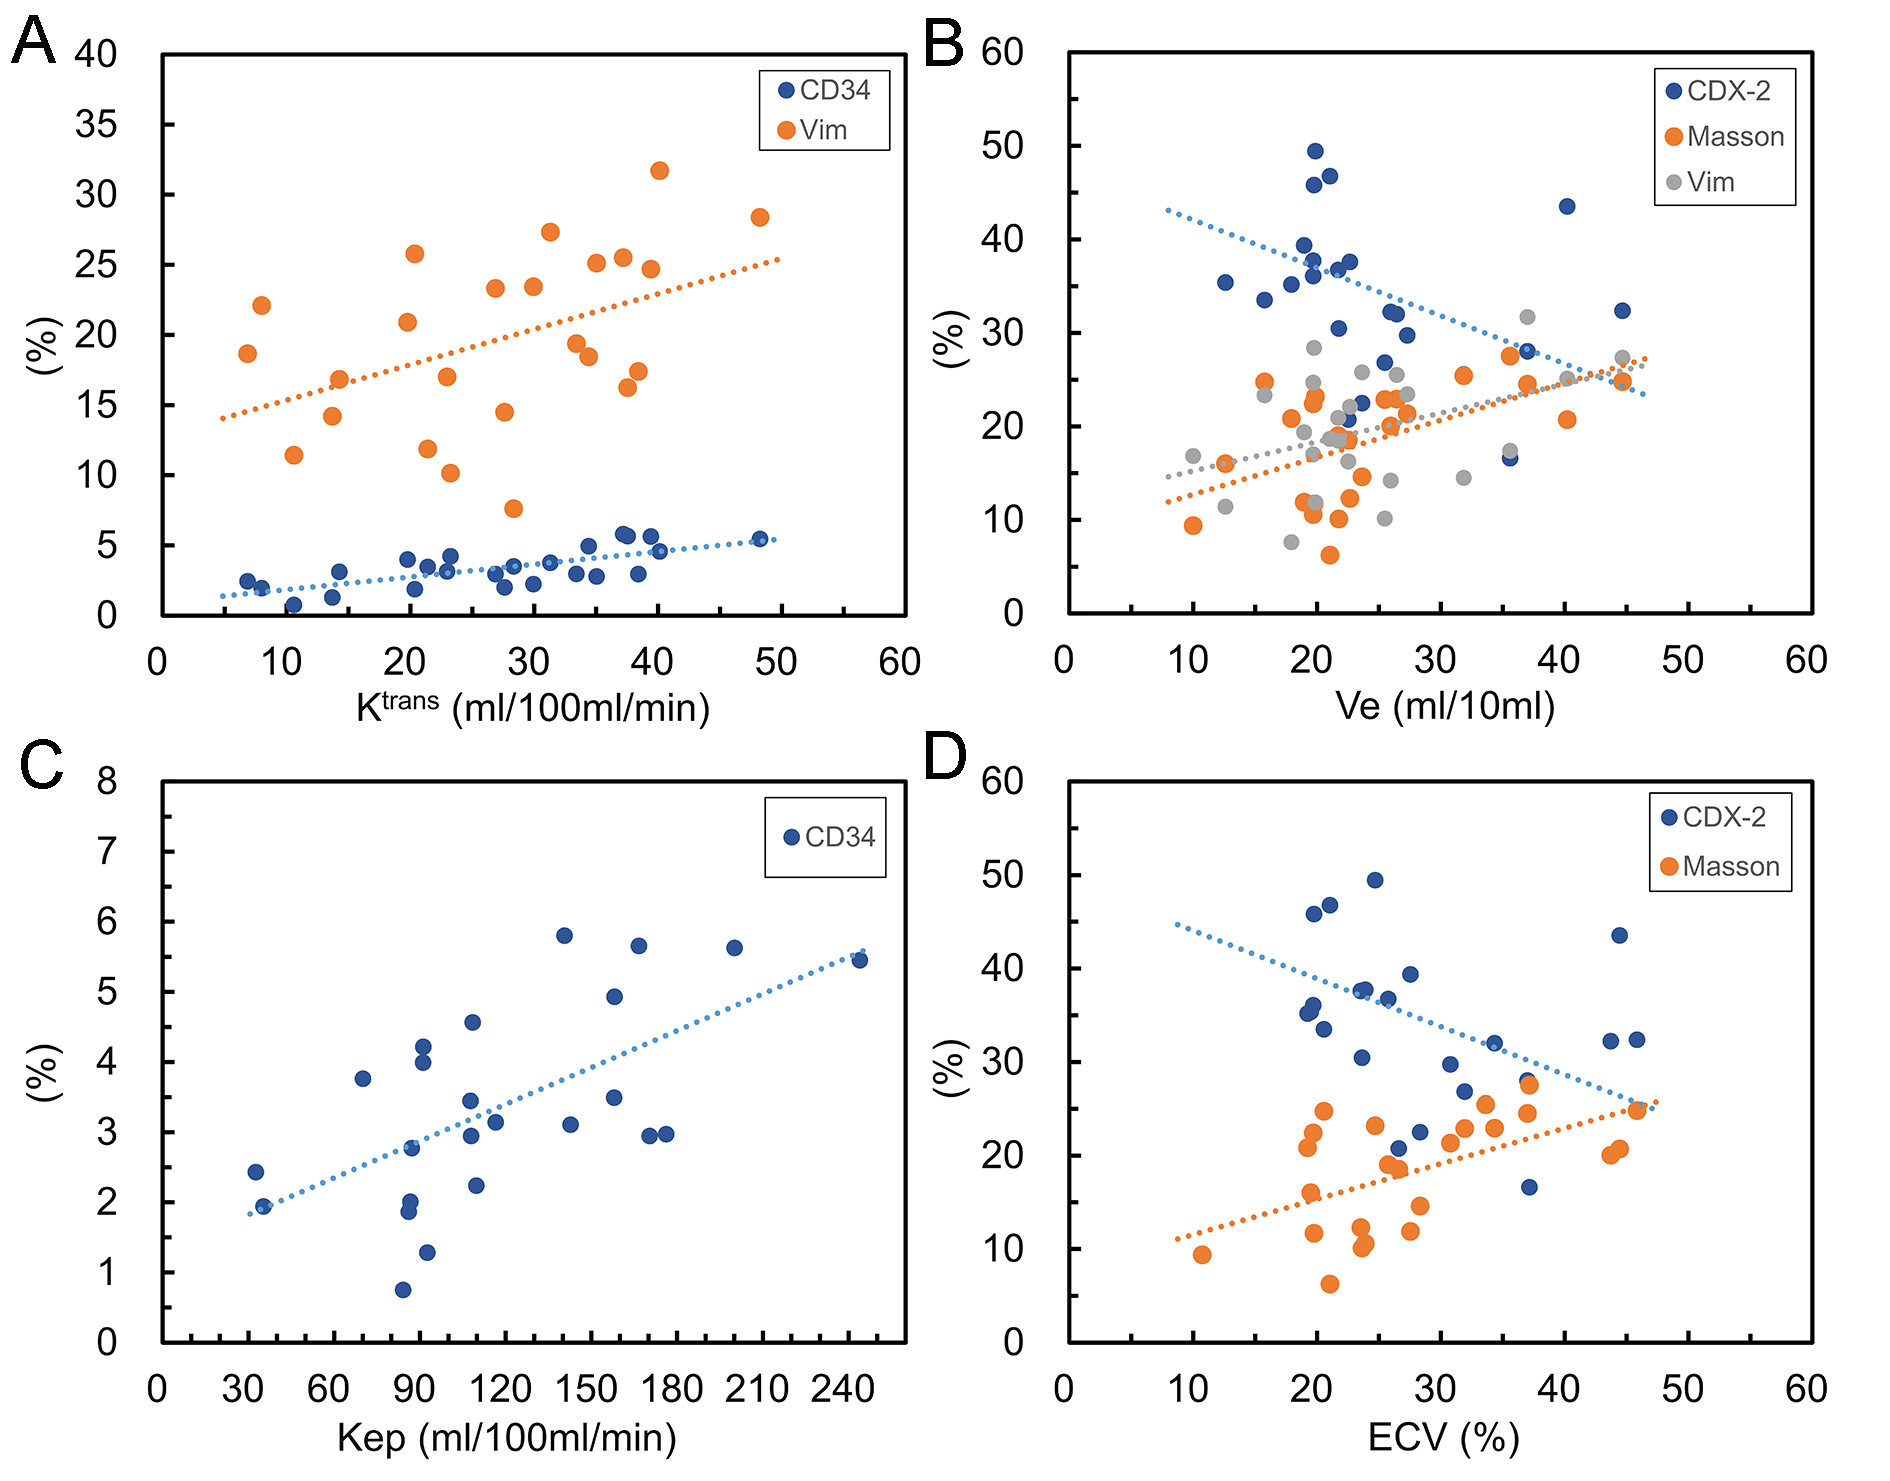
Figure. Correlations between DCE MRI-derived parameters with histopathological markers in rectal cancer.
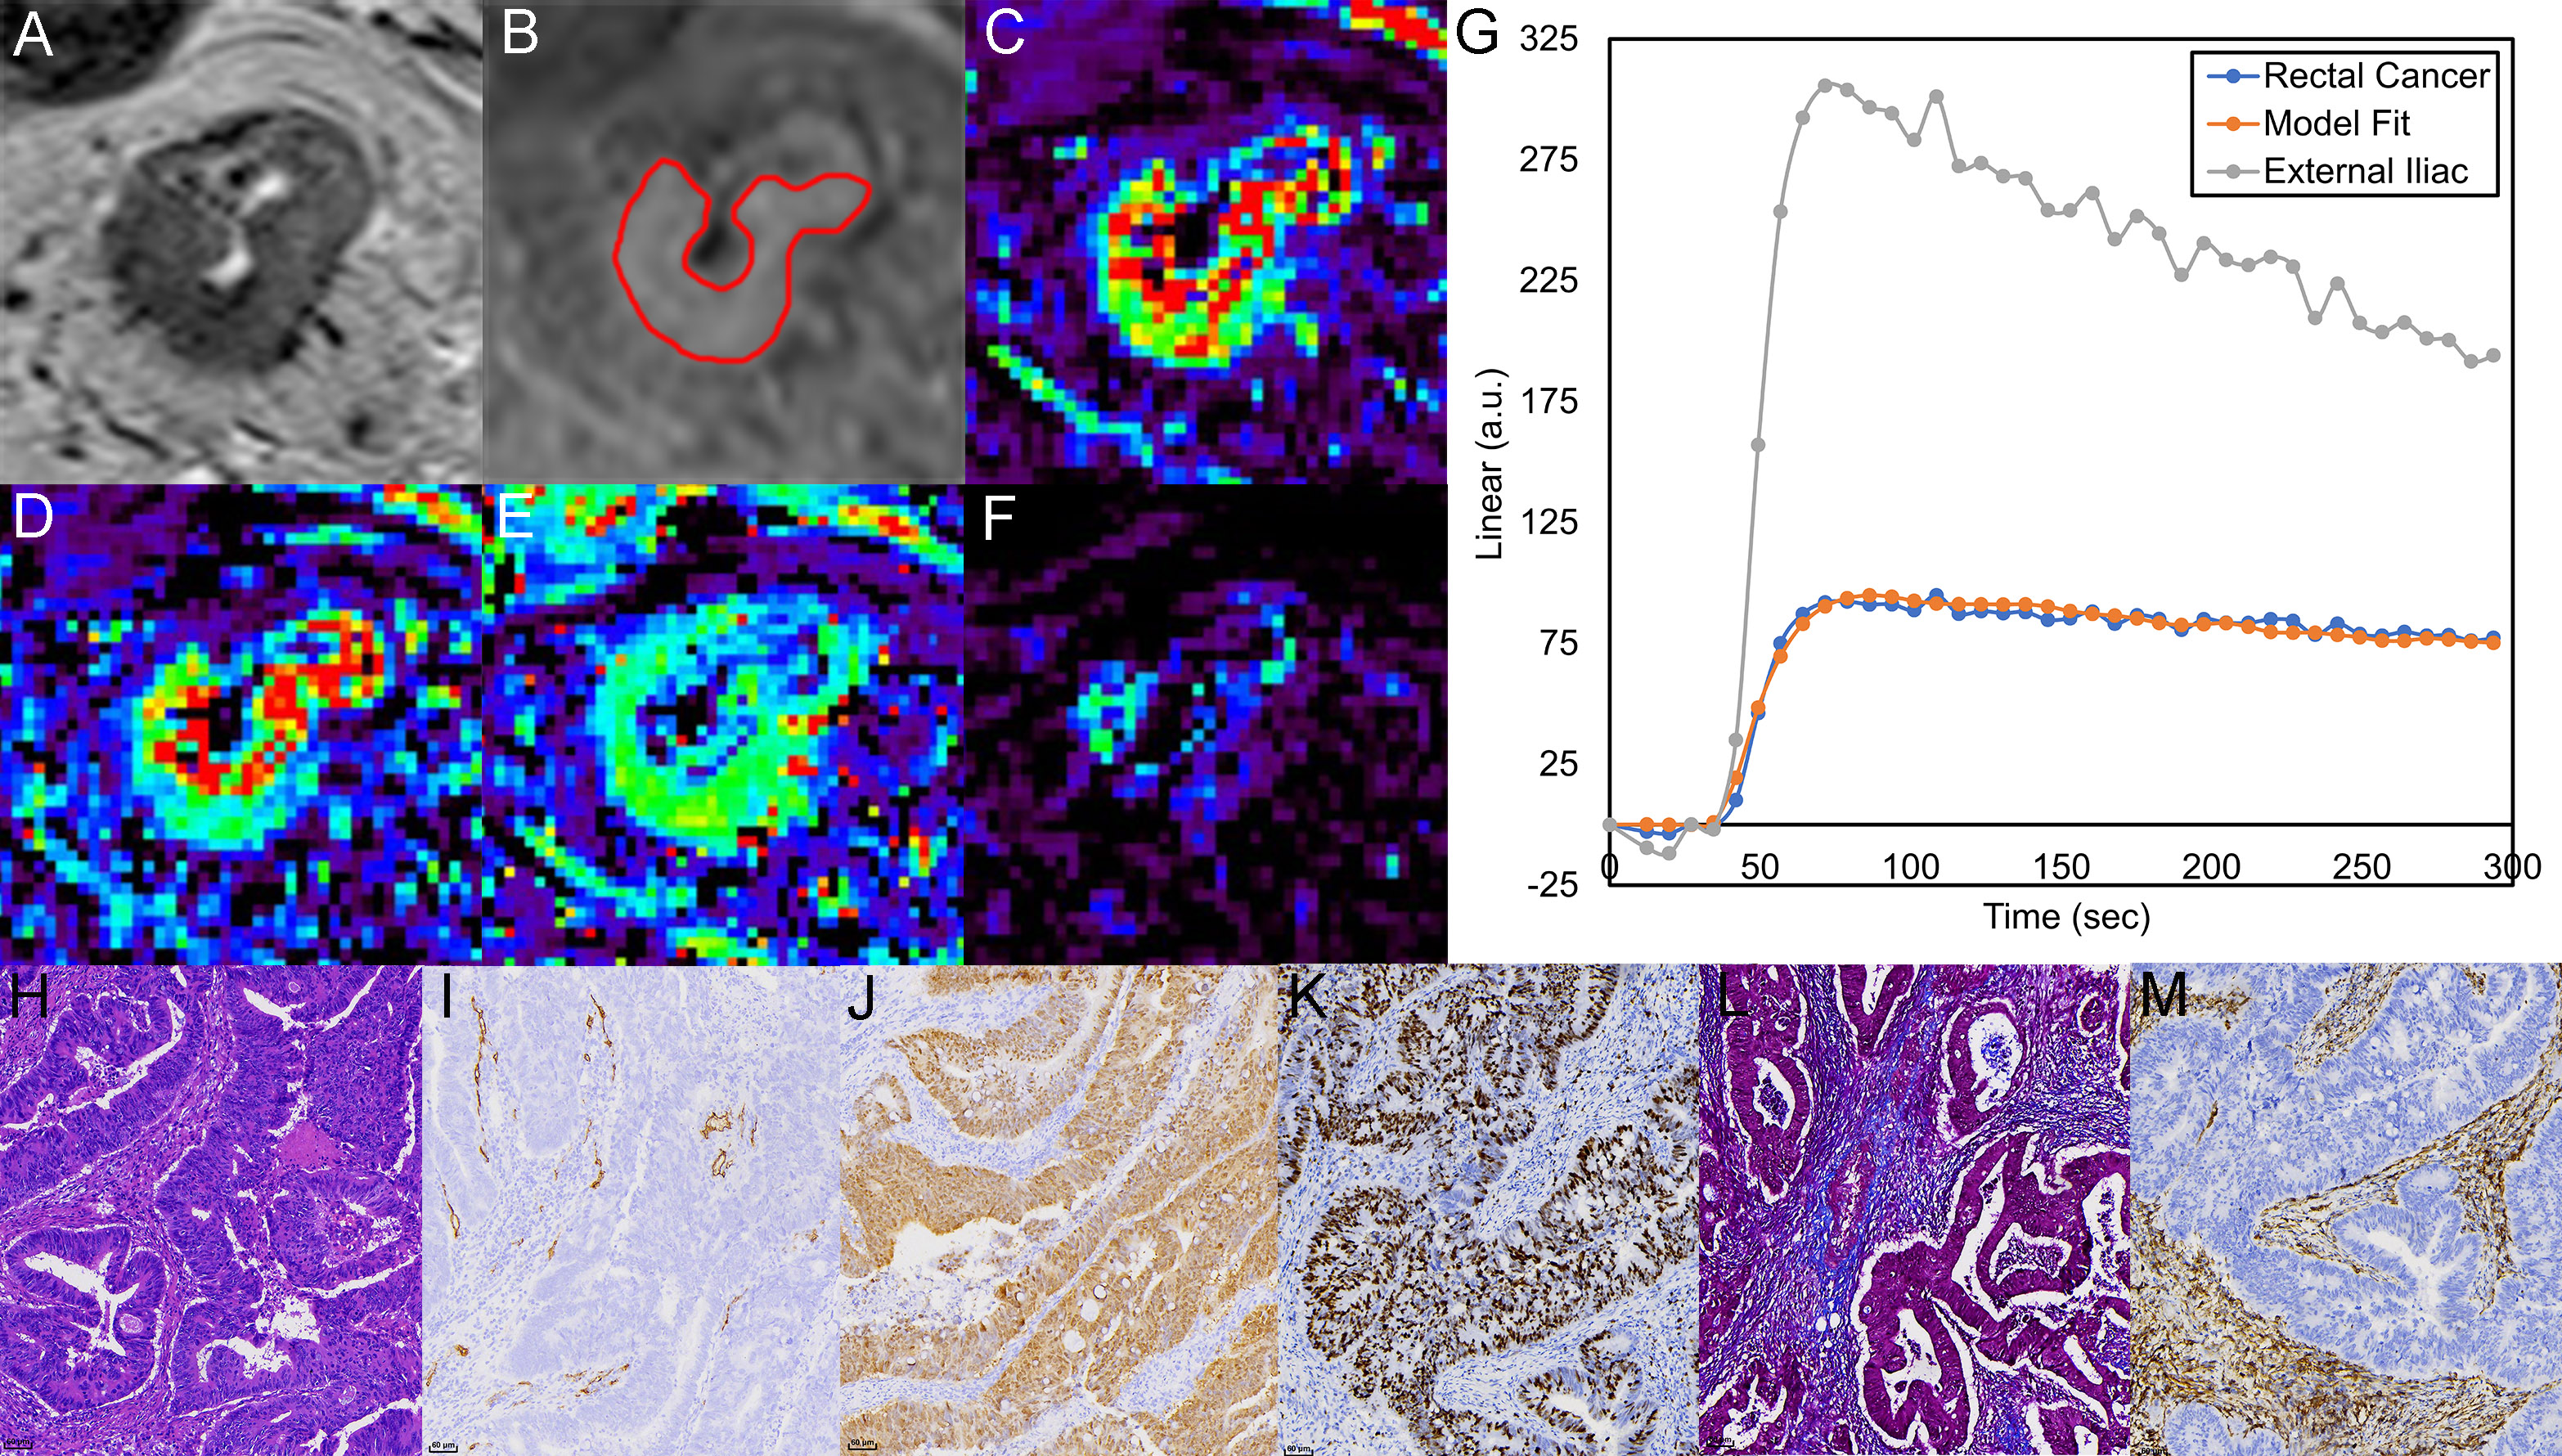
A and B show Images of T2WI and DCE MRI. C-F shows corresponding
parametric maps of Ktrans, Kep, Ve and Vp. The enhancement curve
produced by a rectal adenocarcinoma (blue line), a model fit (orange line) and external
iliac proximal (gray line) in G. a.u.= arbitrary units. K-P show the images of
HE, CD34, CDX-2, Ki-67, Masson’s and vimentin staining.
DOI: https://doi.org/10.58530/2023/4276