4274
APTw Combined With Multiple Models DWI of Endometrial Cancer: Correlations Between Multimodal Parameters and HIF-1α Expression
Ma Changjun1, Tian Shifeng1, Liu Ailian1, Chen Lihua1, Lin Liangjie2, Zhang Xiaoxiao3, Guo Yinghua4, and Wang Jiazheng4
1Department of Radiology,, The First Affiliated Hospital of Dalian Medical University, Dalian, China, China, 2Clinical & Technical Support, Philips Healthcare, Beijing, China, China, 3Clinical & Technical Support, Philips Healthcare, Wuhan, China, China, 4Clinical & Technical Support, Philips Healthcare, Shanghai, China, China
1Department of Radiology,, The First Affiliated Hospital of Dalian Medical University, Dalian, China, China, 2Clinical & Technical Support, Philips Healthcare, Beijing, China, China, 3Clinical & Technical Support, Philips Healthcare, Wuhan, China, China, 4Clinical & Technical Support, Philips Healthcare, Shanghai, China, China
Synopsis
Keywords: Placenta, Quantitative Imaging
HIF-1α is a major transcriptional factor regulating gene expression under hypoxic conditions. The identification of HIF-1α expression is very helpful for the quantitative assessment of tumor hypoxia, on which the therapeutic response is predicted or regimens are adjusted .Introduction and Purpose
HIF-1α is a major transcriptional factor regulating gene expression under hypoxic conditions. HIF-1α expression was closely correlated with the oxygenation status of the tumor and could serve as an important biomarker for tumor hypoxia, aggressiveness, or radiation resistance. High expression of HIF-1α contributes to high aggressiveness or poor prognosis of cervical carcinoma. In this study, we aimed to investigate the correlations between multiple imaging parameters derived from APTw, IVIM and DKI MRI, and HIF-1α expression and to determine whether the multimodal functional MRI technique can be used for quantitatively measuring HIF-1α expression.Materials and Methods
72 EC pathologically confirmed patients were divided into high HIF-1α expression group (30 cases) and low HIF-1α expression group (40 cases). MR examinations included APTw, DKI and IVIM imaging were performed within two weeks before surgery. The specific scanning parameters are shown in Table 2. The quantitative maps of APT values and multiple models diffusion-weighted imaging (IVIM and DKI) parameters including the ADC,D, D*, f, MK and MD were obtained. The independent sample t-test or Mann-Whitney U test were used to compare the differences in the parameter values between the two groups.The ROC curve was used to calculate the parameters with the statistical difference to evaluate the performance of EC HIF-1α expression. Binary logistic regression analysis predicted the independent risk factors of HIF-1α expression in EC. The Delong test was used to compare the differences among the AUCs. The correlation of the imaging parameters and HIF-1α expression was analyzed by Spearman correlation analysis.Results
Relationship Between Imaging Parameters, High HIF-1α expression and Low HIF-1α expression groupsThe imaging values of the high HIF-1α expression groups and low HIF-1α expression groups were presented in Table 4. APT, ADC, D, D*, MK and MD values were significantly higher in high HIF-1α expression groups than those in low HIF-1α expression groups, whereas f value was significantly lower in high HIF-1α expression groups than that in low HIF-1α expression groups.
Regression analyses
The irregular vaginal bleeding, APTw and multi-model diffusion derived parameters were involved in the regression analysis. Although univariate analysis showed that irregular vaginal bleeding, APT, ADC, D, D*, f, MK and MD were all favorable for evaluating HIF-1α expression in EC, multivariate analysis revealed that only f, MK, and MD were independent predictors for evaluating HIF-1α expression in EC
Correlation analysis between Imaging parameters and HIF-1α Expression
Spearman rank correlation analysis showed that there was an inverse correlation between f and HIF-1α expression level (r = -0.565; P<0.001). There were positive correlation between the APT, ADC, D, D*, MK and MD values and the HIF-1α expression level .
The ability of the Imaging Parameters to Discriminate High HIF-1α expression from Low HIF-1α expression groups
ROC curves for APTw and multiple models diffusion-weighted imaging parameters and their combinations to discriminate high HIF-1α expression from low HIF-1α expression were shown in Fig. 5. APT, ADC, D, D*and f values had good specificity (75.00% to 100.00%), while moderate sensitivity (50.00% to 87.50%).The combined diagnosis had excellent sensitivity (96.90%) and specificity (85.00%) (Table 6). The ROC showed that the AUC was significantly improved in the combined image sets of APTw, DKI and IVIM (0.970; 95% CI: 0.938–1.000) compared with the APTw set (0.646; 95% CI: 0.519 - 0.774; P <0.001) and the IVIM set (0.709, 0.763, 0.784, 0.828; 95% CI: 0.586 - 0.832, 0.640 - 0.885, 0.669 - 0.900, 0.720 - 0.935; P<0.001, P<0.001, P=0.001, P=0.009) and the DKI set (0.750, 0.637; 95%CI: 0.639 - 0.860, 0.505 - 0.769; P<0.001, P<0.001) alone.
Discussion and Conclusion
In conclusion, we investigated the correlations between multiple imaging parameters and found that the APTw, DKI and IVIM quantitative parameters could appraise the EC HIF-1α expression. Results showedthat APT, ADC, D, D*, MK and MD values were significantly higher in high HIF-1α expression than those in low HIF-1α expression groups, whereas f value was significantly lower in high HIF-1α expression than that in low HIF-1α expression groups, meanwhile, the MK value and the MD value were independent risk factors for predicting HIF-1α expression in EC. The combination model showed a high diagnostic efficacy in differentiation of HIF-1α expression in EC and was superior to single imaging parameter. Meanwhile, there was an inverse correlation between f and HIF-1α expression level and there were positive correlation between the APT value, ADC value, D value, D* value, MK value, MD value and the HIF-1α expression level. According to a previous study[1], tumor hypoxia was related to many tumor microenvironment factors, such as tumor vasculature, necrosis, and tumor stroma, thus any single imaging parameter could not reflect all the tumor microenvironment characteristics. In addition, this study showed that there was a significant overlap in the measurement of any single imaging parameter between the high-expression and the low-expression group; therefore, it was not reliable to assess HIF-1α expression quantitatively by using only a single imaging parameter.The combination of multiple imaging parameters, by contrast, could maximally reduce or avoid this limitation because they could reflect different aspects of the tumor microenvironment as a whole, which was more helpful for assessing the HIF-1α expression[2]. Nevertheless, at present biopsy is still considered to be the most accurate method in evaluation ofthe HIF-1α expression[3].Acknowledgements
No.References
[1] Ji RC. Hypoxia and lymphangiogenesis in tumor microenvironment and metastasis. Cancer Lett 2014;346:6–16.[2] Tang B, Qu Y, Zhao F, et al. In vitro effects of hypoxia-inducible factor 1alpha on the biological characteristics of the SiHa uterine cervix cancer cell line. Int J Gynecol Cancer 2009;19:898–904.[3] Zhu P, Ou Y, Dong Y, et al. Expression of VEGF and HIF-1α in locally advanced cervical cancer: Potential biomarkers for predicting preoperative radiochemotherapy sensitivity and prognosis. Oncol Targets Ther 2016;9:3031–3037.Figures
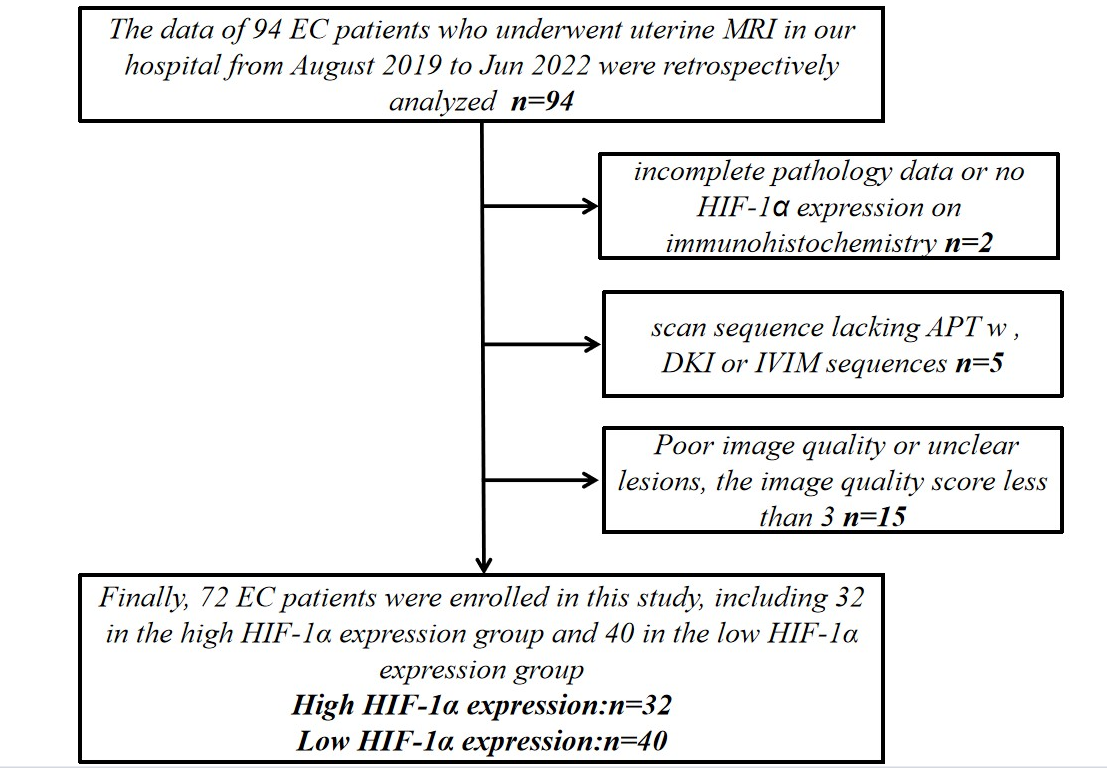
Fig.1: Flow chart of patient enrollment
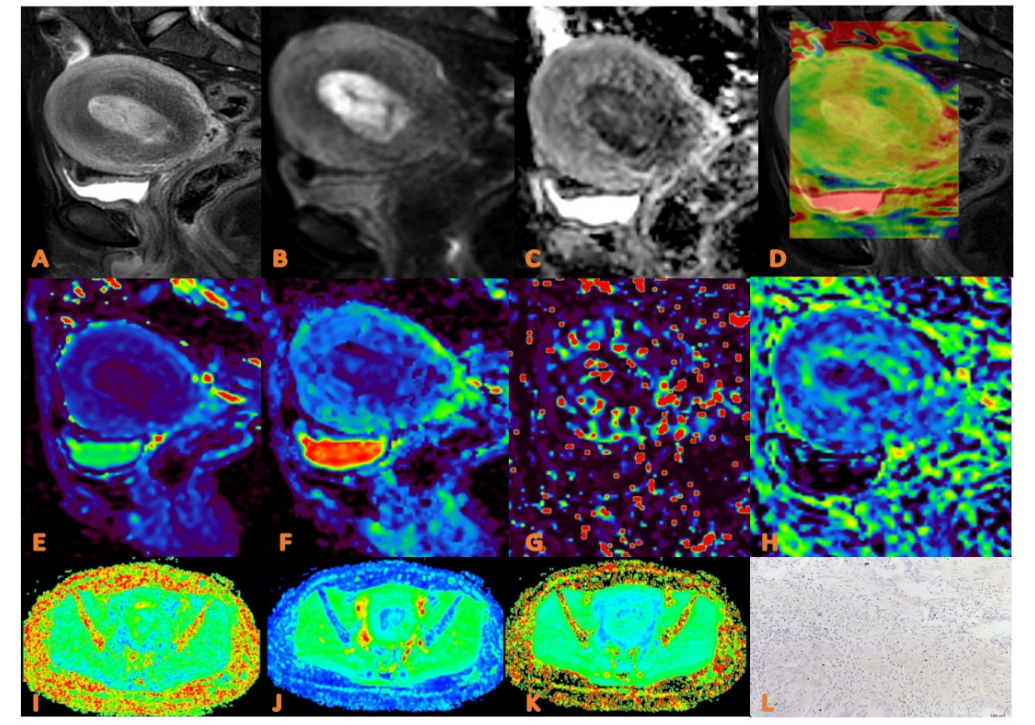
FIG.2: APTw, DKI and IVIM in EC that had low HIF-1α expression. (a) sagittal T2WI, showing a slightlyhigh signal mass in the uterine cavity; (b) DWI image ; (c) ADC images; (d) APTw and T2WI fusion images (mean APT value 2.90%) (e–h) ADC, D, D*, and f images. Mean values are 0.750 ×10⁻³ mm2/sec for ADC, 0.470 × 10⁻³ mm2/sec for D,0.560×10-2 mm2 /sec for D* and 0.30% for f; (I-K) FA, MK, and MD images. Mean values are 0.314 for FA, 0.555 for MK, and 0.876μm2 /ms for MD; (L) Immunohistochemical staining image (×200) showed that HIF-1α expression of the tumor appeared as low expression.
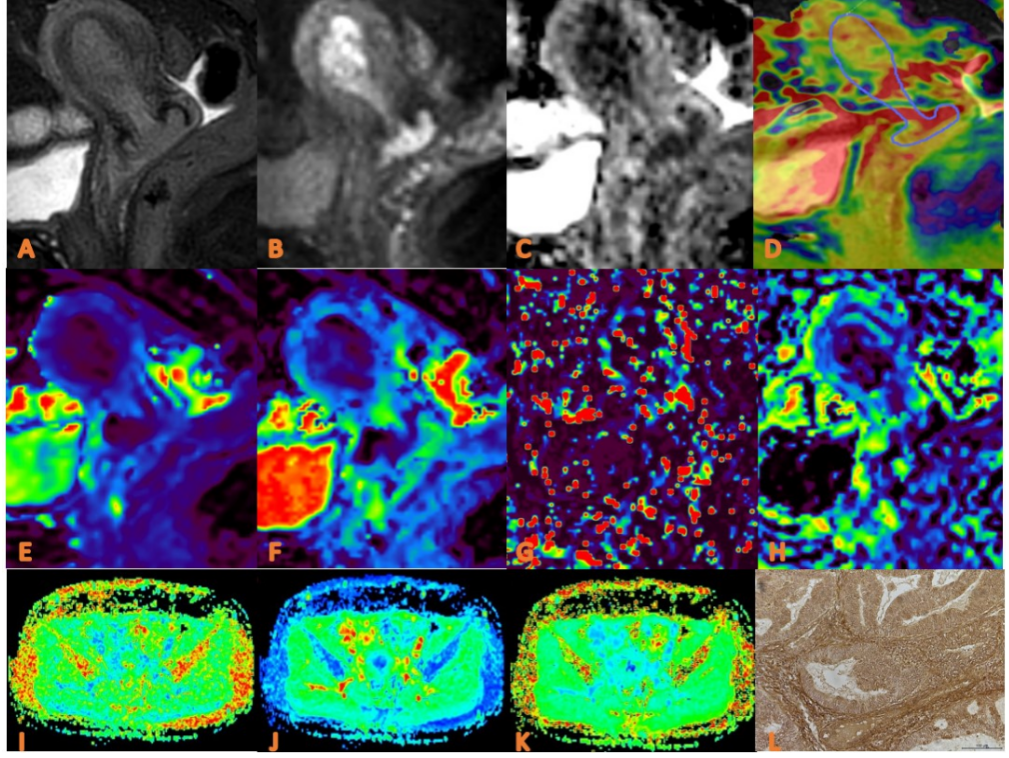
FIG.3: APTw, DKI and IVIM in EC that had high HIF-1α expression.(a) sagittal T2WI, showing a slightlyhigh signal mass in the uterine cavity; (b) DWI image ; (c) ADC images; (d) APTw and T2WI fusion images (mean APT value 3.07%) (e–h) ADC, D, D*, and f images. Mean values are 0.760×10⁻³ mm2/sec for ADC, 0.590 × 10⁻³ mm2/sec for D,0.600 ×10-2 mm2 /sec for D* and 0.160% for f; (I-K) FA, MK, and MD images. Mean values are 0.395 for FA, 0.674 for MK, and 0.866μm2 /ms for MD; (L) Immunohistochemical staining image (×200) showed that HIF-1α expression of the tumor appeared as high expression.
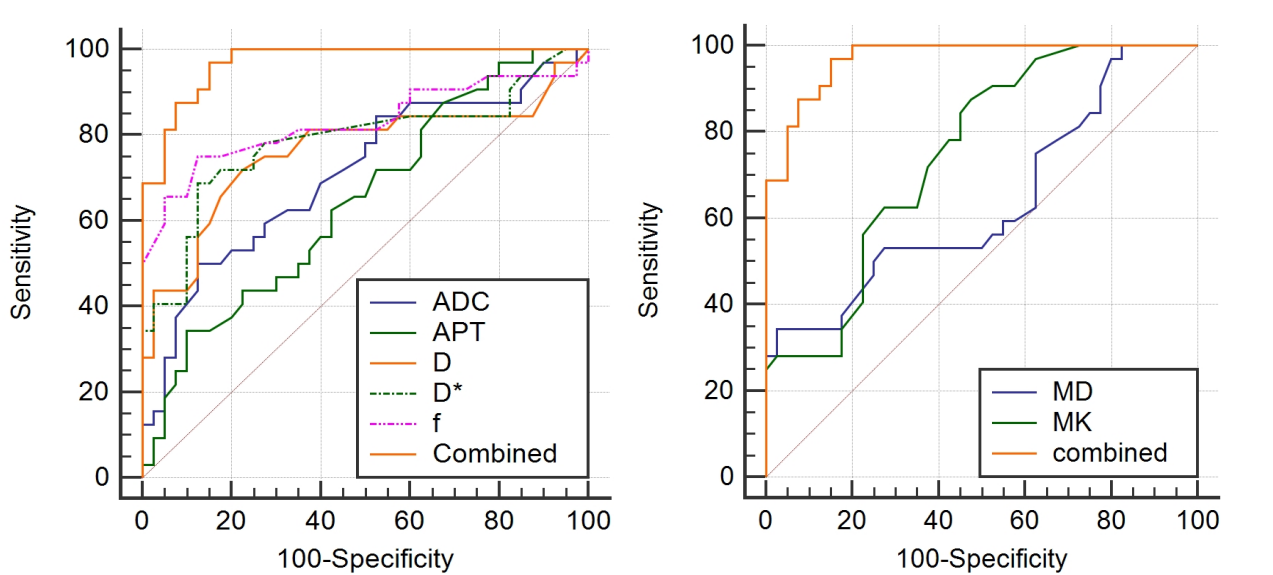
FIG. 4: ROC curve analysis of the performance of each imaging parameter to evaluate the HIF-1α expression, AUCs of APT value, ADC value, D value, D* value, f value, MD, MK, and Combined to evaluate the HIF-1α expression are 0.894 (0.740, 0.973), 0.746 (0.568, 0.879), 0.716 (0.528, 0.904), 0.920 (0.772, 0.984), 0.756 (0.578, 0.886), 0.973 (0.851–1.000), respectively.

FIG.5: Forest plot of multivariate logistic regression (MD and MK are risk factors for HIF-1α in EC, f is protective factor for HIF-1α in EC). APT = amide proton transfer; ADC = apparent diffusion coefficient; D = true diffusion; D* = pseudo diffusion; f = perfusion fraction; MK =mean kurtosis; MD =mean diffusivity; EC = endometrial cancer.
DOI: https://doi.org/10.58530/2023/4274