4272
The findings of clinical and imaging features of common ovarian sex cord stromal tumors with both Ultrasound and MRI1Department of Radiology, The Third Affiliated Hospital of Zhengzhou University, Zhengzhou, China, 2Department of Information, The Third Affiliated Hospital of Zhengzhou University, Zhengzhou, China, 3MR Research China, GE Healthcare, Beijing, China, 4Department of Medical Equipment, The Third Affiliated Hospital of Zhengzhou University, Zhengzhou, China, 5Department of Research, The Third Affiliated Hospital of Zhengzhou University, Zhengzhou, China, 6Department of Pathology, The Third Affiliated Hospital of Zhengzhou University, Zhengzhou, China
Synopsis
Keywords: Urogenital, MR Value
Most of ovarian sex cord stromal tumors (OSCSTs) are benign with good prognosis, but low-grade malignant OSCSTs need special treatment. Correct preoperative diagnoses and accurate classification remain challenging. We retrospectively analyze the clinical and imaging characteristics of OSCSTs and found significant biomarkers such as maximum enhancement ratio (ERmax) and apparent diffusion coefficient (ADC) for the preoperative diagnosis and classification of common OSCSTs. It’s more helpful for preoperative diagnosis by combining of MRI and ultrasound together than by ultrasound alone, and MRI has the similar diagnostic accuracy as the combination.Background
Ovarian sex cord stromal tumors (OSCSTs) are a group of rare heterogeneous ovarian tumors. The most common ones are ovarian granulosa cell tumor (OGCTs), fibroma and fibrothecoma. Most of them are benign with good prognosis, but some are at low-grade malignance with the risk of recurrence and metastasis, requiring different treatments. MRI and ultrasound are feasible methods for preoperative diagnosis1. Correct preoperative diagnosis and accurate classification remain challenging at present due to the rarity and lack of awareness of OSCSTs1,2. Our objective was to retrospectively analyze the clinical and imaging characteristics of OSCSTs and to further improve the ability of preoperative diagnosis and classification.Methods
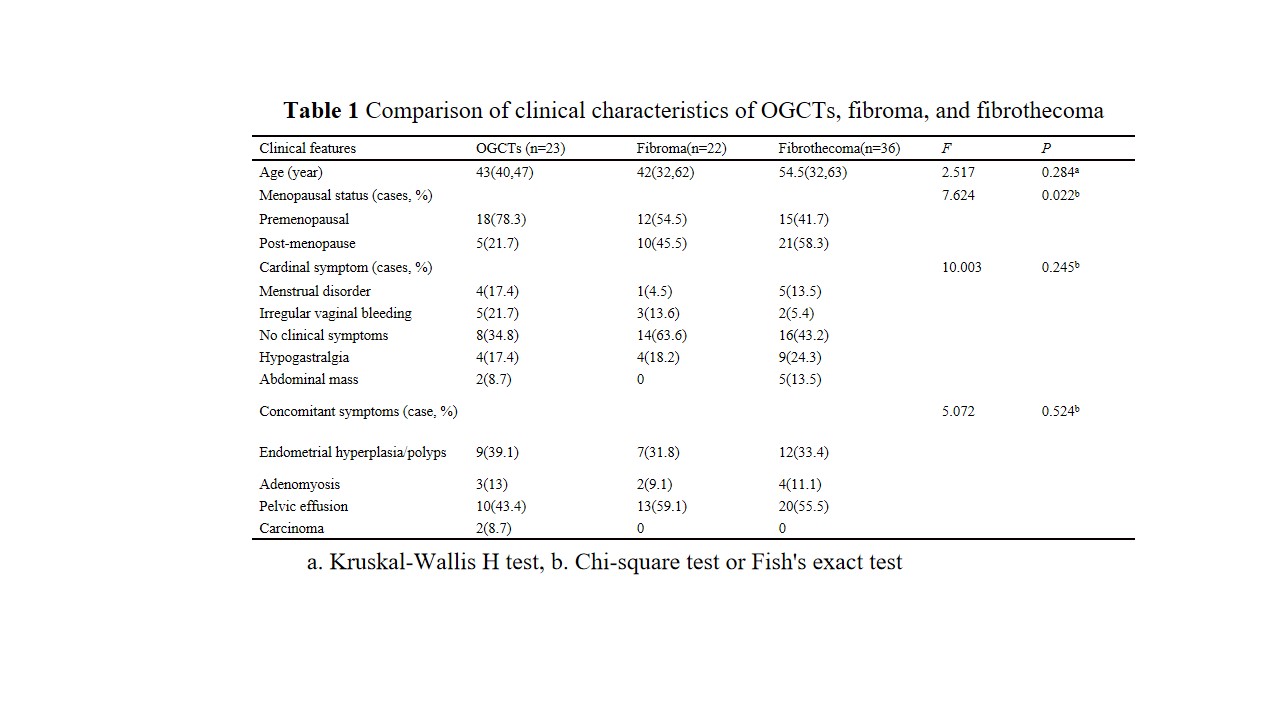
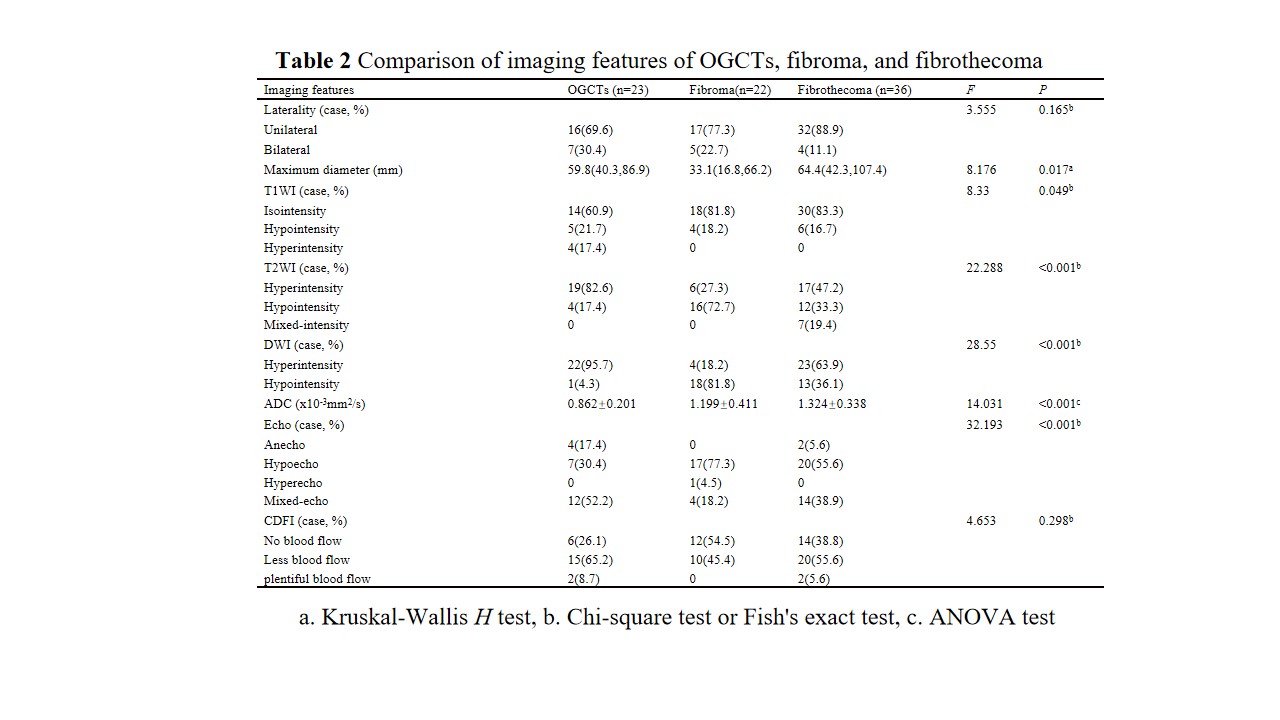
A total of 71 cases including 18 cases of ovarian OGCTs with 23 neoplasms, 19 cases of fibromas with 22 neoplasms, and 34 cases of fibrothecomas (including thecoma) with 36 neoplasms were retrospectively included in this study. The clinical characteristics include age, menopausal status, main symptoms, concomitant symptoms, hormones, and serum tumor markers, the imaging features include laterality, maximum diameter, signal characteristics of solid region, apparent diffusion coefficient (ADC) value, the maximum enhancement rate (ERmax), and ultrasonic echo and color doppler flow imaging characteristics were analyzed by using Chi-square test and Kruskal-Wallis H test. Receiver operating curve analyses were performed to evaluate the diagnostic performance of the significant characteristics.Results
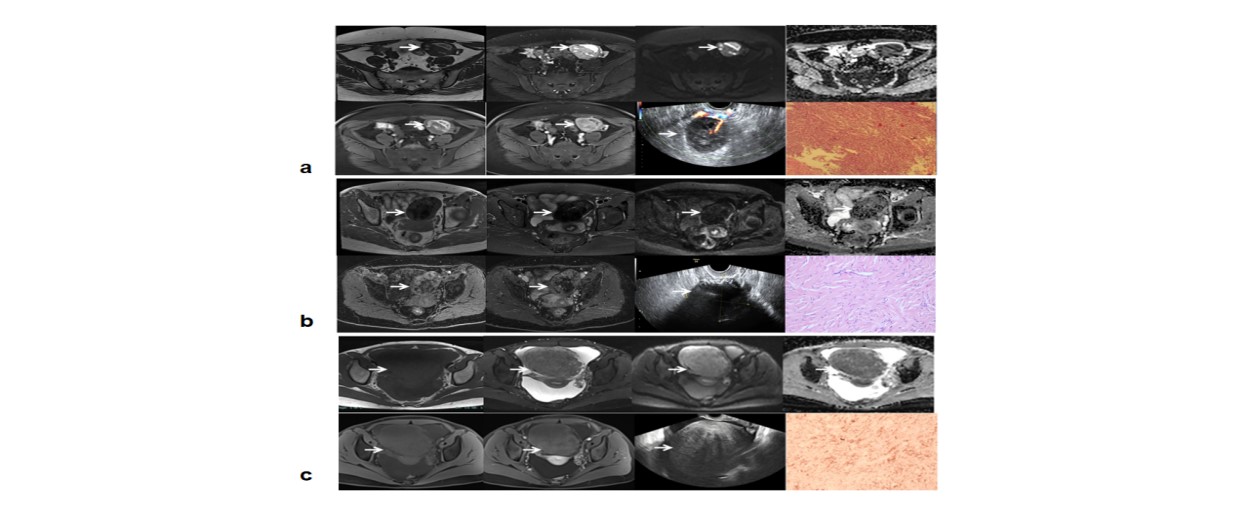
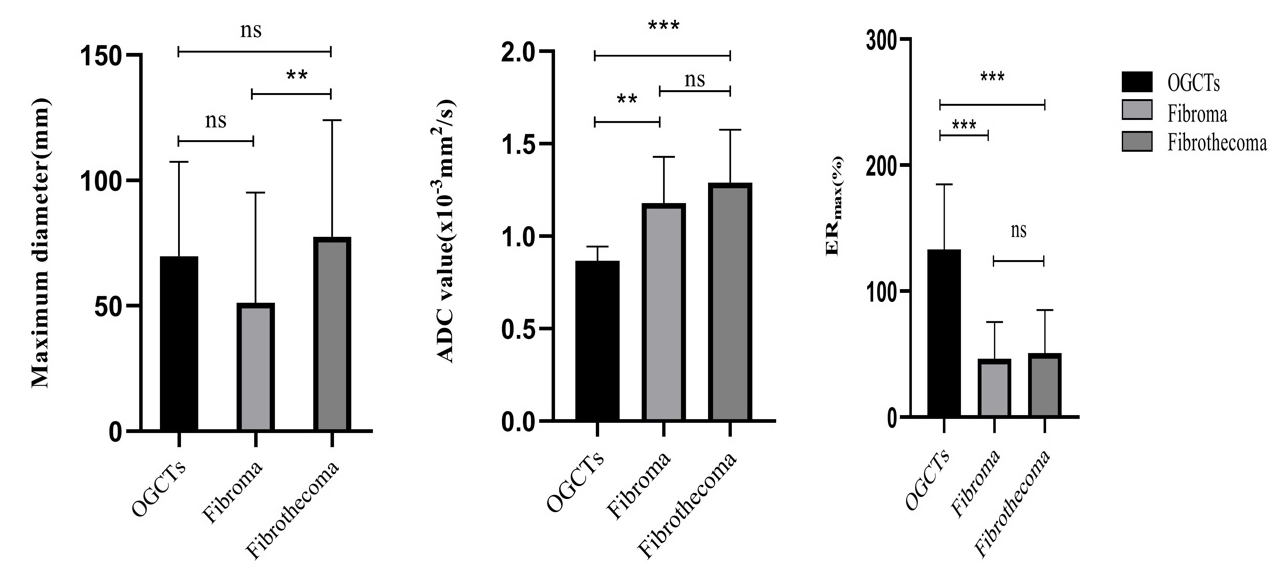
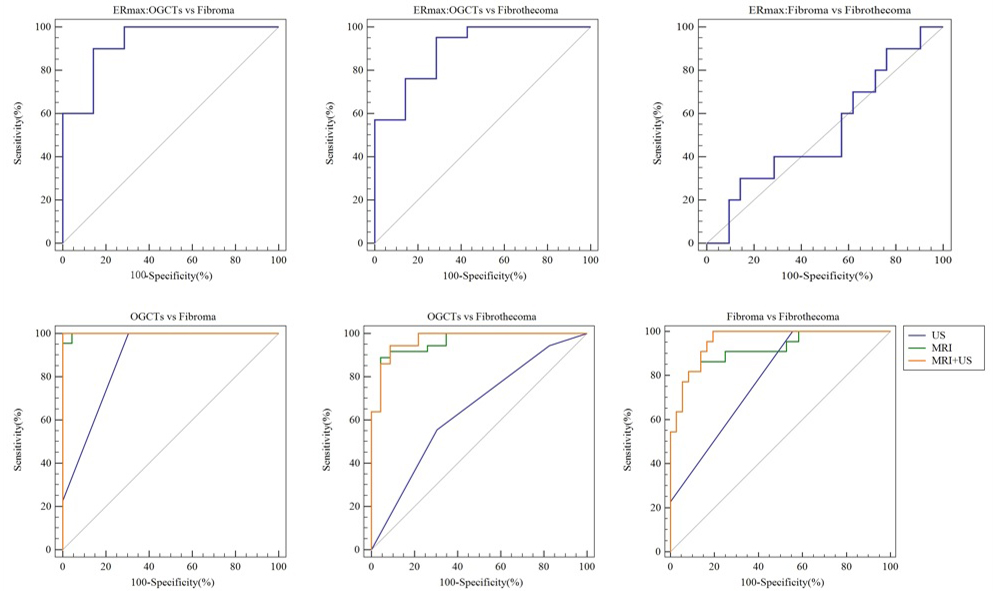
For clinical characteristics, there was no significant difference in age, main symptoms and concomitant symptoms (P>0.05), while there was a statistically significant difference in menopausal status (P<0.05) (Table 1). For imaging characteristics as shown in Fig. 1, there were significant differences in MR images including the maximum diameter, signal characteristics of the solid region, ADC value, ERmax, and ultrasound echo characteristics among the three groups (P<0.05). Laterality and color doppler flow imaging characteristics didn’t show statistical significance (P>0.05) (Table 2, Fig. 2). The areas under the curves (AUC) of the ERmax between OGCTs and fibroma, between OGCTs and fibrothecoma, and between fibroma and fibrothecoma were 0.929, 0.898 and 0.524, respectively (Fig, 3 above). The AUC of the MRI, ultrasound and their combination were respectively 0.998, 0.882, and 1.000 in differentiating OGCTs and fibroma. The AUC of the MRI, ultrasound and their combination were respectively 0.960, 0.645, and 0.969 in identifying OGCTs from fibrothecoma. The AUC of the MRI, ultrasound and their combination were respectively 0.918, 0.785 and 0.970 for identifying fibroma and fibrothecoma (Fig. 3 below). The diagnostic performance of MRI was significantly better than that of ultrasound (P<0.05), but was similar to that of their combination (P=0.48,0.43 and 0.12 respectively).Discussion
The clinical characteristics of common OSCSTs were not statistically different, which were consistent with previous studies3,4, except for menopausal status, indicating that the clinical characteristics had no obvious advantage in differential diagnoses. In our study, OGCTs were more common in the postmenopausal women than the fibrothecoma. This may be due to the fact that adult OGCT is more common in the perimenopausal period. We found that E2 elevation was not the most common, and no relevant literature reports have been found. It is speculated that OSCSTs without theca cells in tumor stroma account for a relatively high proportion or may be due to the limited amount of research subjects in this study. Results of the most imaging features were consistent with previous studies5,6. The ADC value of the granulosa cell group was significantly lower than those of the fibroma and the fibrothecoma groups. Although there were differences between the fibroma group and the fibrothecoma group, the difference was relatively small, indicating that the cell density of the granulosa cell tumor was higher than those of the fibroma and fibrothecoma. ADC value might be useful in differentiating OGCT from fibroma and fibrothecoma. The ERmax of granulosa cell tumor group was significantly higher than fibroma and fibrothecoma, and the difference between the latter two groups was not statistically significant. OGCTs may be more hypervascular. In contrast, most fibroma and fibrothecoma manifest as more hypovascular tumors, however, their symptoms displayed an overlap. The diagnostic efficacy of MR was better than that of ultrasound. When MRI was combined with ultrasound, the diagnostic efficacy was improved. But there was no significant difference in the diagnostic efficacies between MR alone and the combination.Conclusion
In conclusion, both MRI and ultrasound are helpful in the preoperative diagnosis and classification of common OSCSTs, especially the MRI biomarker such as ERmax and ADC value. In comparison, the performance of MRI is better than ultrasound alone, but similar to that of the combination of the two modalities. And when using both MRI and ultrasound, the diagnostic performance is optimal.Acknowledgements
We thank all the study participants.References
1. He G, Zhao J, Yang Z, et al. Comparison of image features and diagnostic value of color Doppler ultrasound and two-dimensional ultrasound in the diagnosis of ovarian sex cord-stromal tumors. Oncology letters.2020;20: 1671-1676.
2. Jung SE, Rha SE, Lee JM, et al. CT and MRI findings of sex cord-stromal tumor of the ovary. AJR Am J Roentgenol. 2005;185(1):207-215.
3. Nasioudis D, Wilson E, Mastroyannis SA, et al. Increased risk of breast and uterine cancer among women with ovarian granulosa cell tumors. Anticancer Res. 2019;39(9):4971-4975.
4. Nagawa K, Kishigami T, Yokoyama F, et al. Diagnostic utility of a conventional MRI-based analysis and texture analysis for discriminating between ovarian thecoma-fibroma groups and ovarian granulosa cell tumors. J Ovarian Res. 2022;15(1):65.
5. Fang M, Dong J, Zhong Q, et al. Value of diffusion-weighted imaging combined with conventional magnetic resonance imaging in the diagnosis of thecomas and their differential diagnosis with adult granulosa cell tumors. Acta Radiol. 2019;60(11):1532-1542.
6. Zhang H, Zhang H, Gu S, et al. MR findings of primary ovarian granulosa cell tumor with focus on the differentiation with other ovarian sex cord-stromal tumors. J Ovarian Res. 2018;11(1):46.
Figures