4266
A Preliminary study of Idiopathic Pulmonary Fibrosis using 3D ventilation map based on 3D Ultrashort Echo time Imaging1Biomedical engineering, Sungkyunkwan University, Suwon, Korea, Republic of, 2Radiology and Center for Imaging Science, Samsung Medical Center, Seoul, Korea, Republic of, 3Health Sciences and Technology, SAIHST, Sungkyunkwan University, Seoul, Korea, Republic of, 4Pulmonary and Critical Care Medicine, Samsung Medical Center, Seoul, Korea, Republic of, 5Intelligent Precision Healthcare Convergence, Sungkyunkwan University, Suwon, Korea, Republic of
Synopsis
Keywords: Lung, Lung
Idiopathic pulmonary fibrosis (IPF) is a specific form of idiopathic interstitial pneumonia of unknown cause, the most common and fatal of these interstitial lung diseases. A study on the quantitative assessment of IPF severity based on signal intensity in hyperpolarized MRI lung imaging has recently been proposed. In this preliminary study, it was shown that non-contrast-enhanced 3D ultrashort echo-time (UTE) MRI could diagnose ventilation defects in lesions in patients with IPF using UTE-based 3D ventilation maps and histograms in combination with 3D UTE structural images.Introduction
Idiopathic pulmonary fibrosis1-2(IPF) is a specific form of chronic and fibrotic interstitial pneumonia of unknown cause, the most common and fatal of these interstitial lung diseases. People with IPF are characterized by progressive worsening of dyspnea, and life expectancy of 3-5 years from the time of diagnosis can be challenging for the individual. Several studies in CT present abnormal radiological features, including subpleural and basal predominant reticulum, honeycomb, traction bronchiectasis, bronchiectasis, and ground glass opacity3-5. In contrast, as an alternative imaging modality without ionizing radiation exposure, pulmonary magnetic resonance imaging(MRI) has been attempted to provide structural and functional information of the lung with various MRI techniques. pulmonary MR imaging using inhaled hyperpolarized(HP-MRI) gases can provide additional details about the structural changes and regions of the diseased lung while determining the functional dynamics of impaired gas exchange and vascular flow in the lungs6. Furthermore, advances in lung MR imaging techniques and protocols, including the use of ultrashort-echo times(UTE), have improved lung tissue definition without exogenous gases. UTE MRI can be used for providing structural information7, as well as functional information such as ventilation8. In this preliminary study, we proposed a quantitative assessment of lesion lung function based on the signal intensity of UTE lung images in without the exogenous gas, considering that impaired ventilation due to IPF may reduce changes pulmonary tissue density on MRI in inspiratory and expiratory. Ventilation maps and ventilation histograms showed dysfunction of ventilation function compared to a two patients with IPF and a healthy subjects group.Methods
Ventilation map: Ventilation map is typically obtained by calculating the voxel-wise signal difference between end-inspiration and end-expiration after image registration9, and defect regions with ventilatory dysfunction appear dark in ventilation map showing less signal difference:$$Ventilation (\text{%})=(S(\text{end expiration} )-S(\text{end inspiration} ))/(S(\text{end expiration}) ) ×100$$Skewness & Kurtosis: The distribution of signal values of pixels within the lung of ventilation images was quantitatively analyzed by calculating histograms. Each functional signal was characterized by calculating the mean, mode, skewness, and kurtosis of the distribution asymmetry.
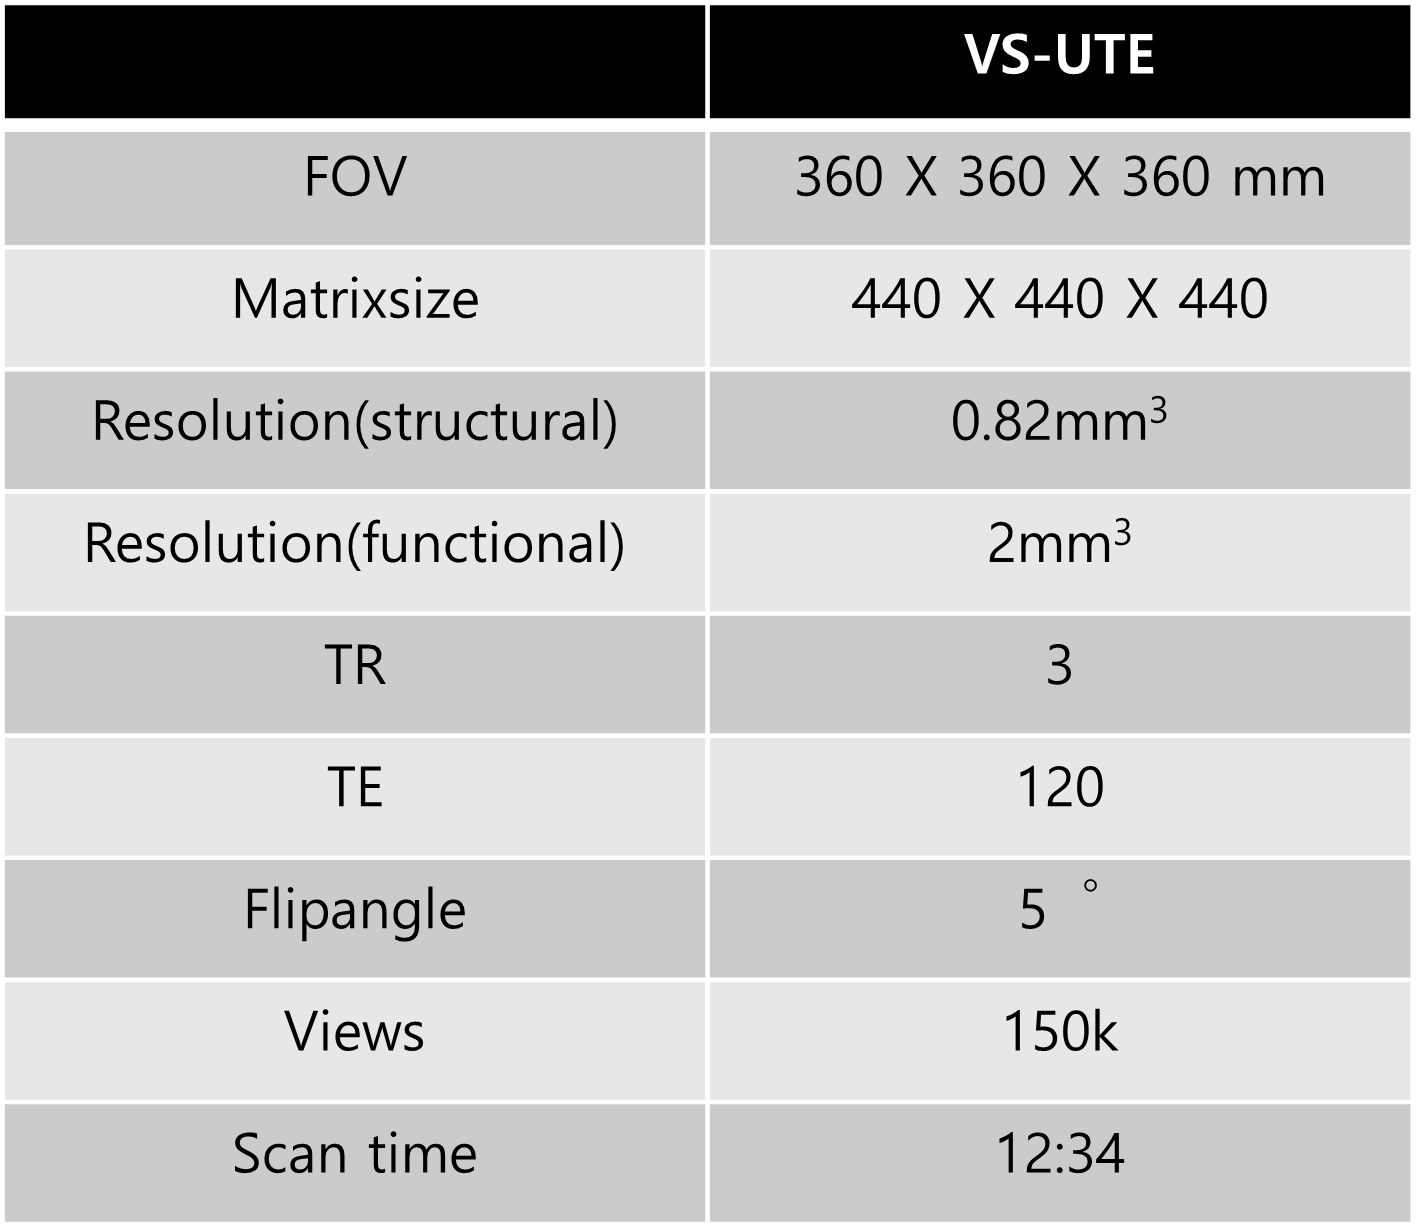
Imaging: This study was approved by the Institutional Review Board of Samsung medical center and performed in full accordance with guidelines. Ten healthy volunteers (25.8±0.6 years,male,FEV1/FVC=85.7±3.0%) underwent lung MRI. Two patients (63years,male,FEV1/FVC=72%,68years,male,FEV1/FVC=66%) with IPF underwent lung MRI and CT. For lung imaging, volume-selective 3D UTE sequence(VS-UTE) was used with fat suppression10,11,12. Scan parameters were given table 1. A self-navigation method developed by our group was used to trace the respiratory motion.13
Data Processing and Analysis: Images were reconstructed with a home-built MATLAB program using FFT with gridding. To obtain the ventilation map, image registration and volume segmentation were performed using ANTs and home-built segmentation tool using a convolutional neural network(CNN).
Results and Discussion
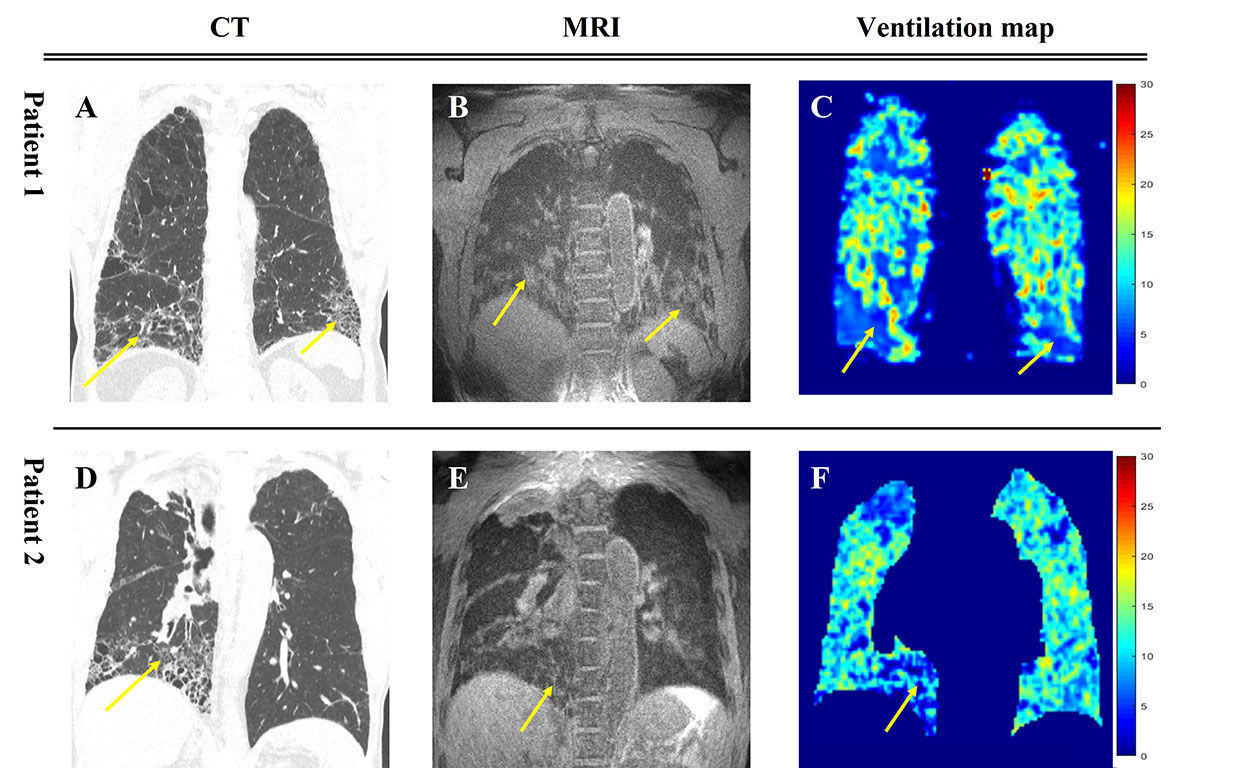
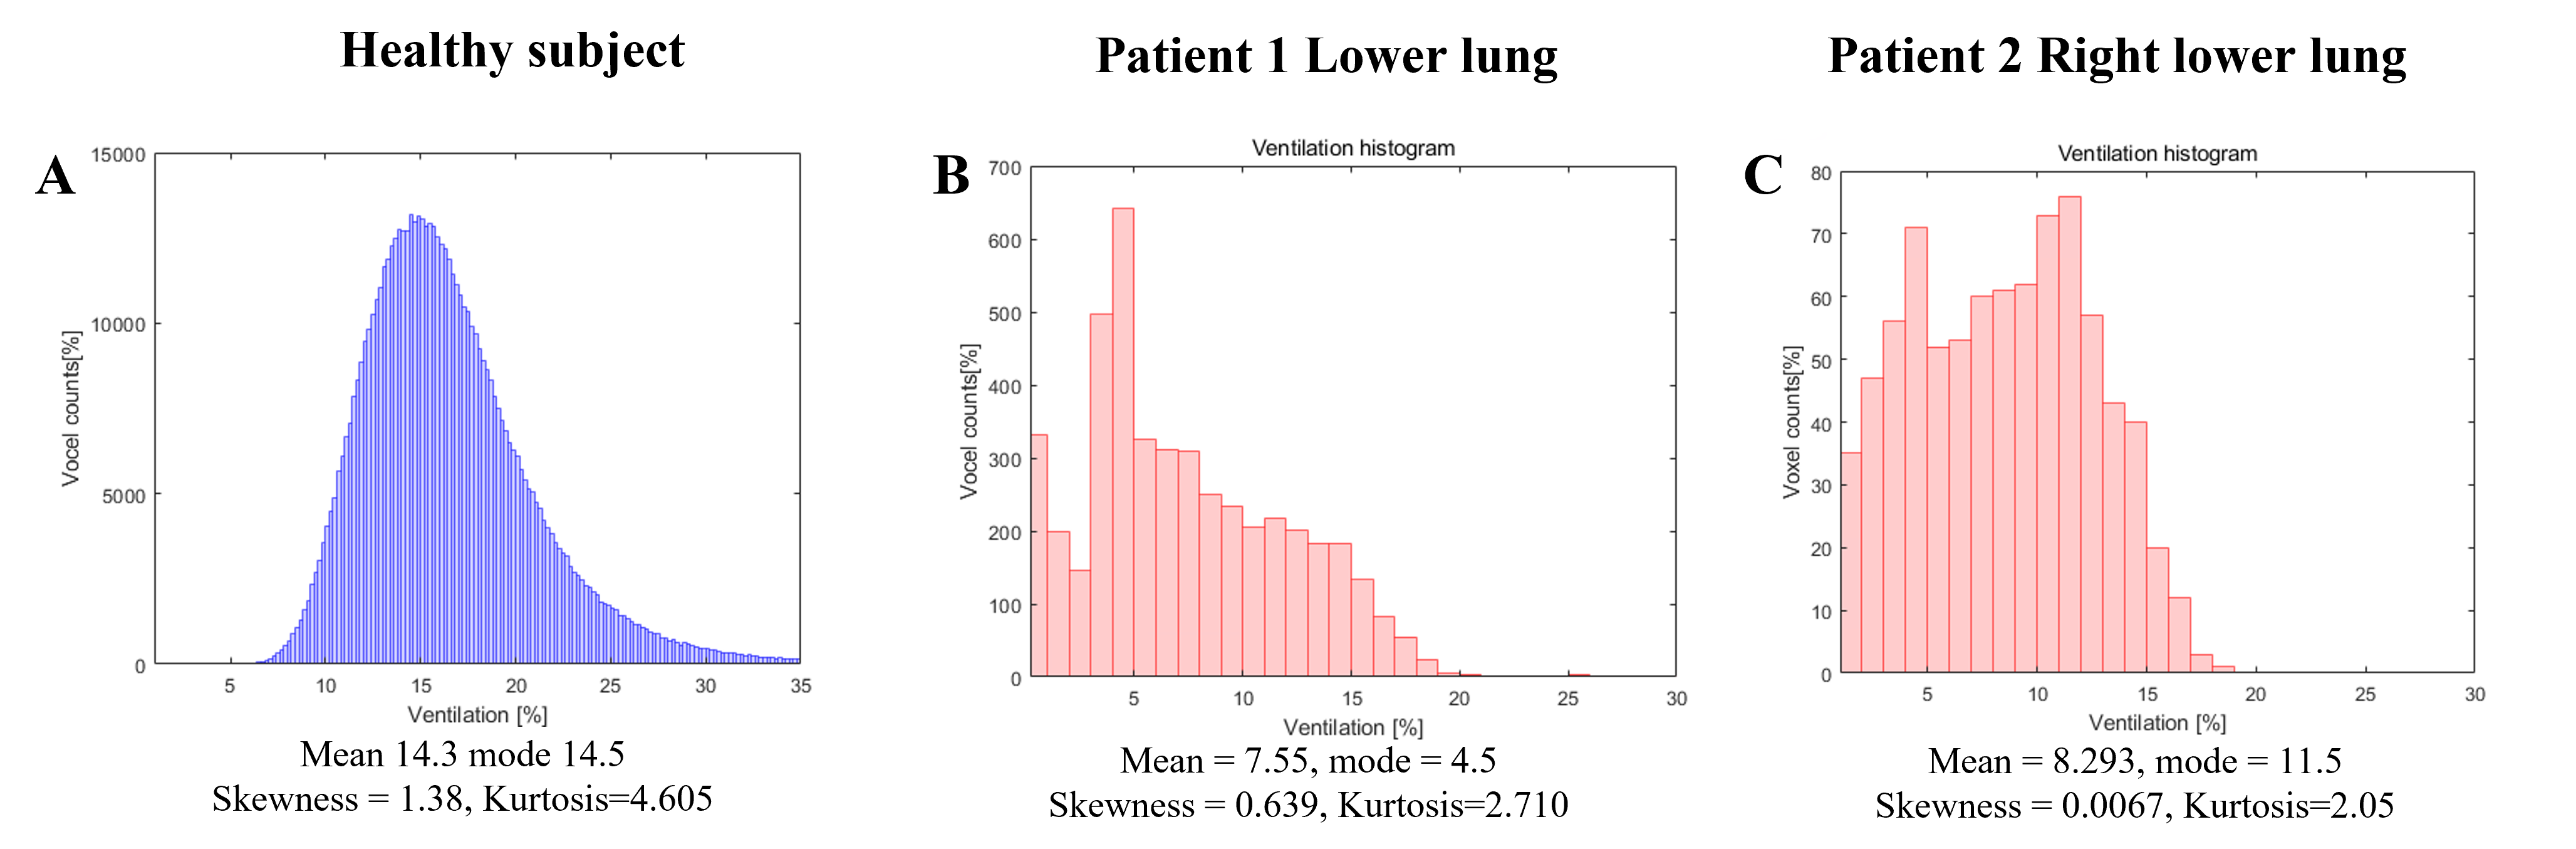
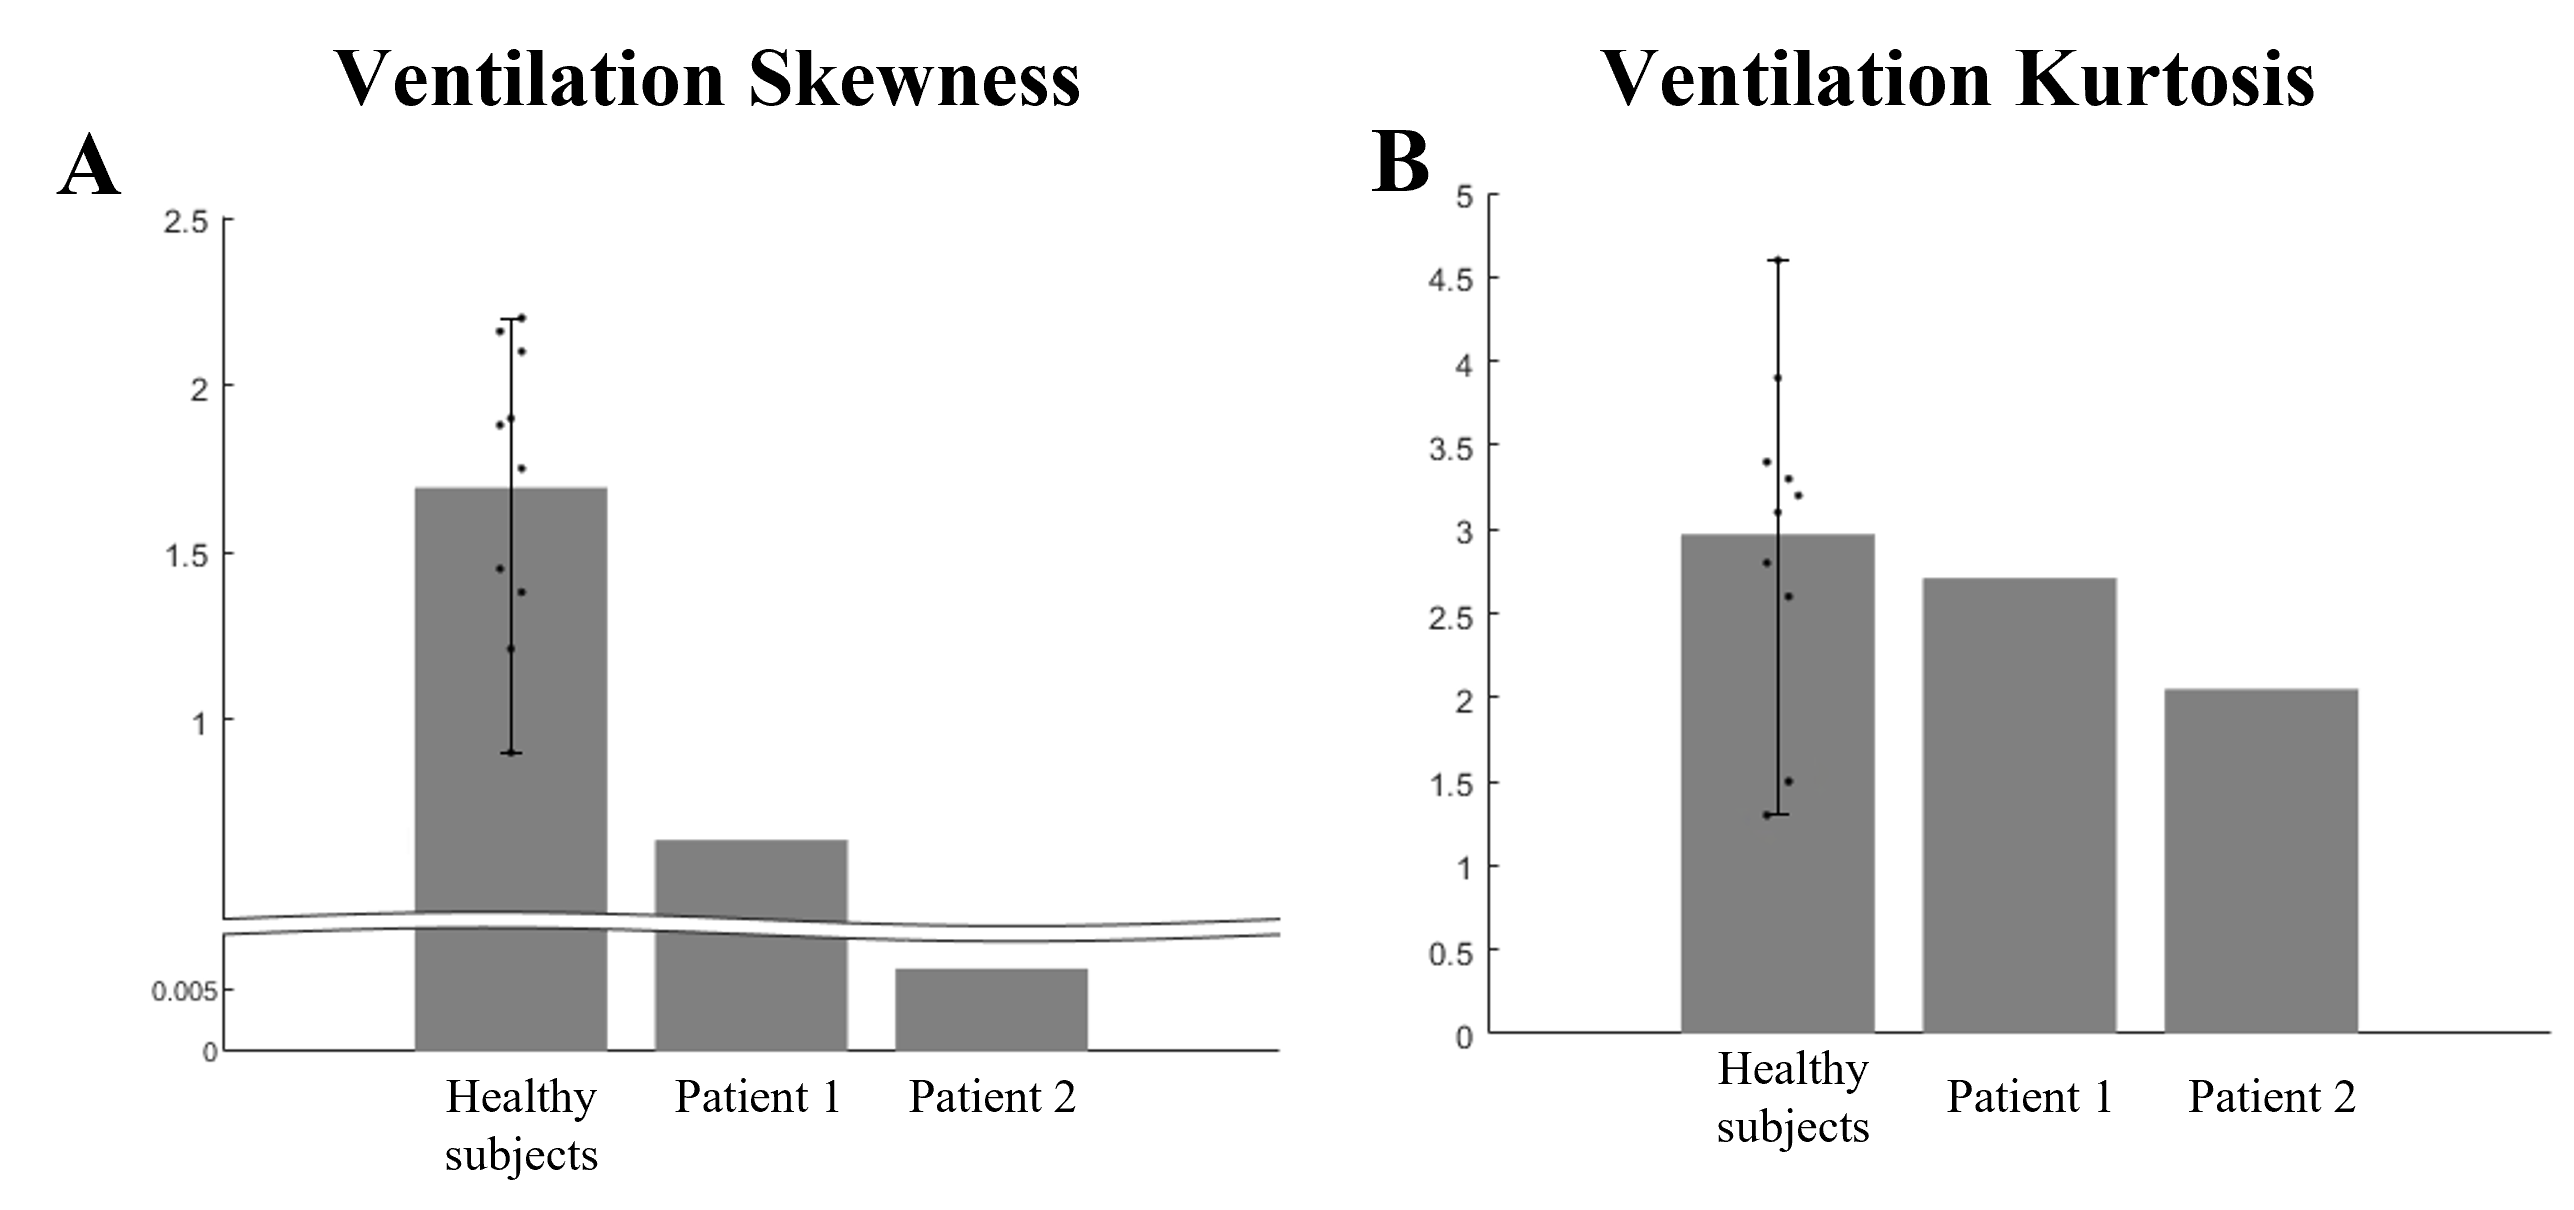
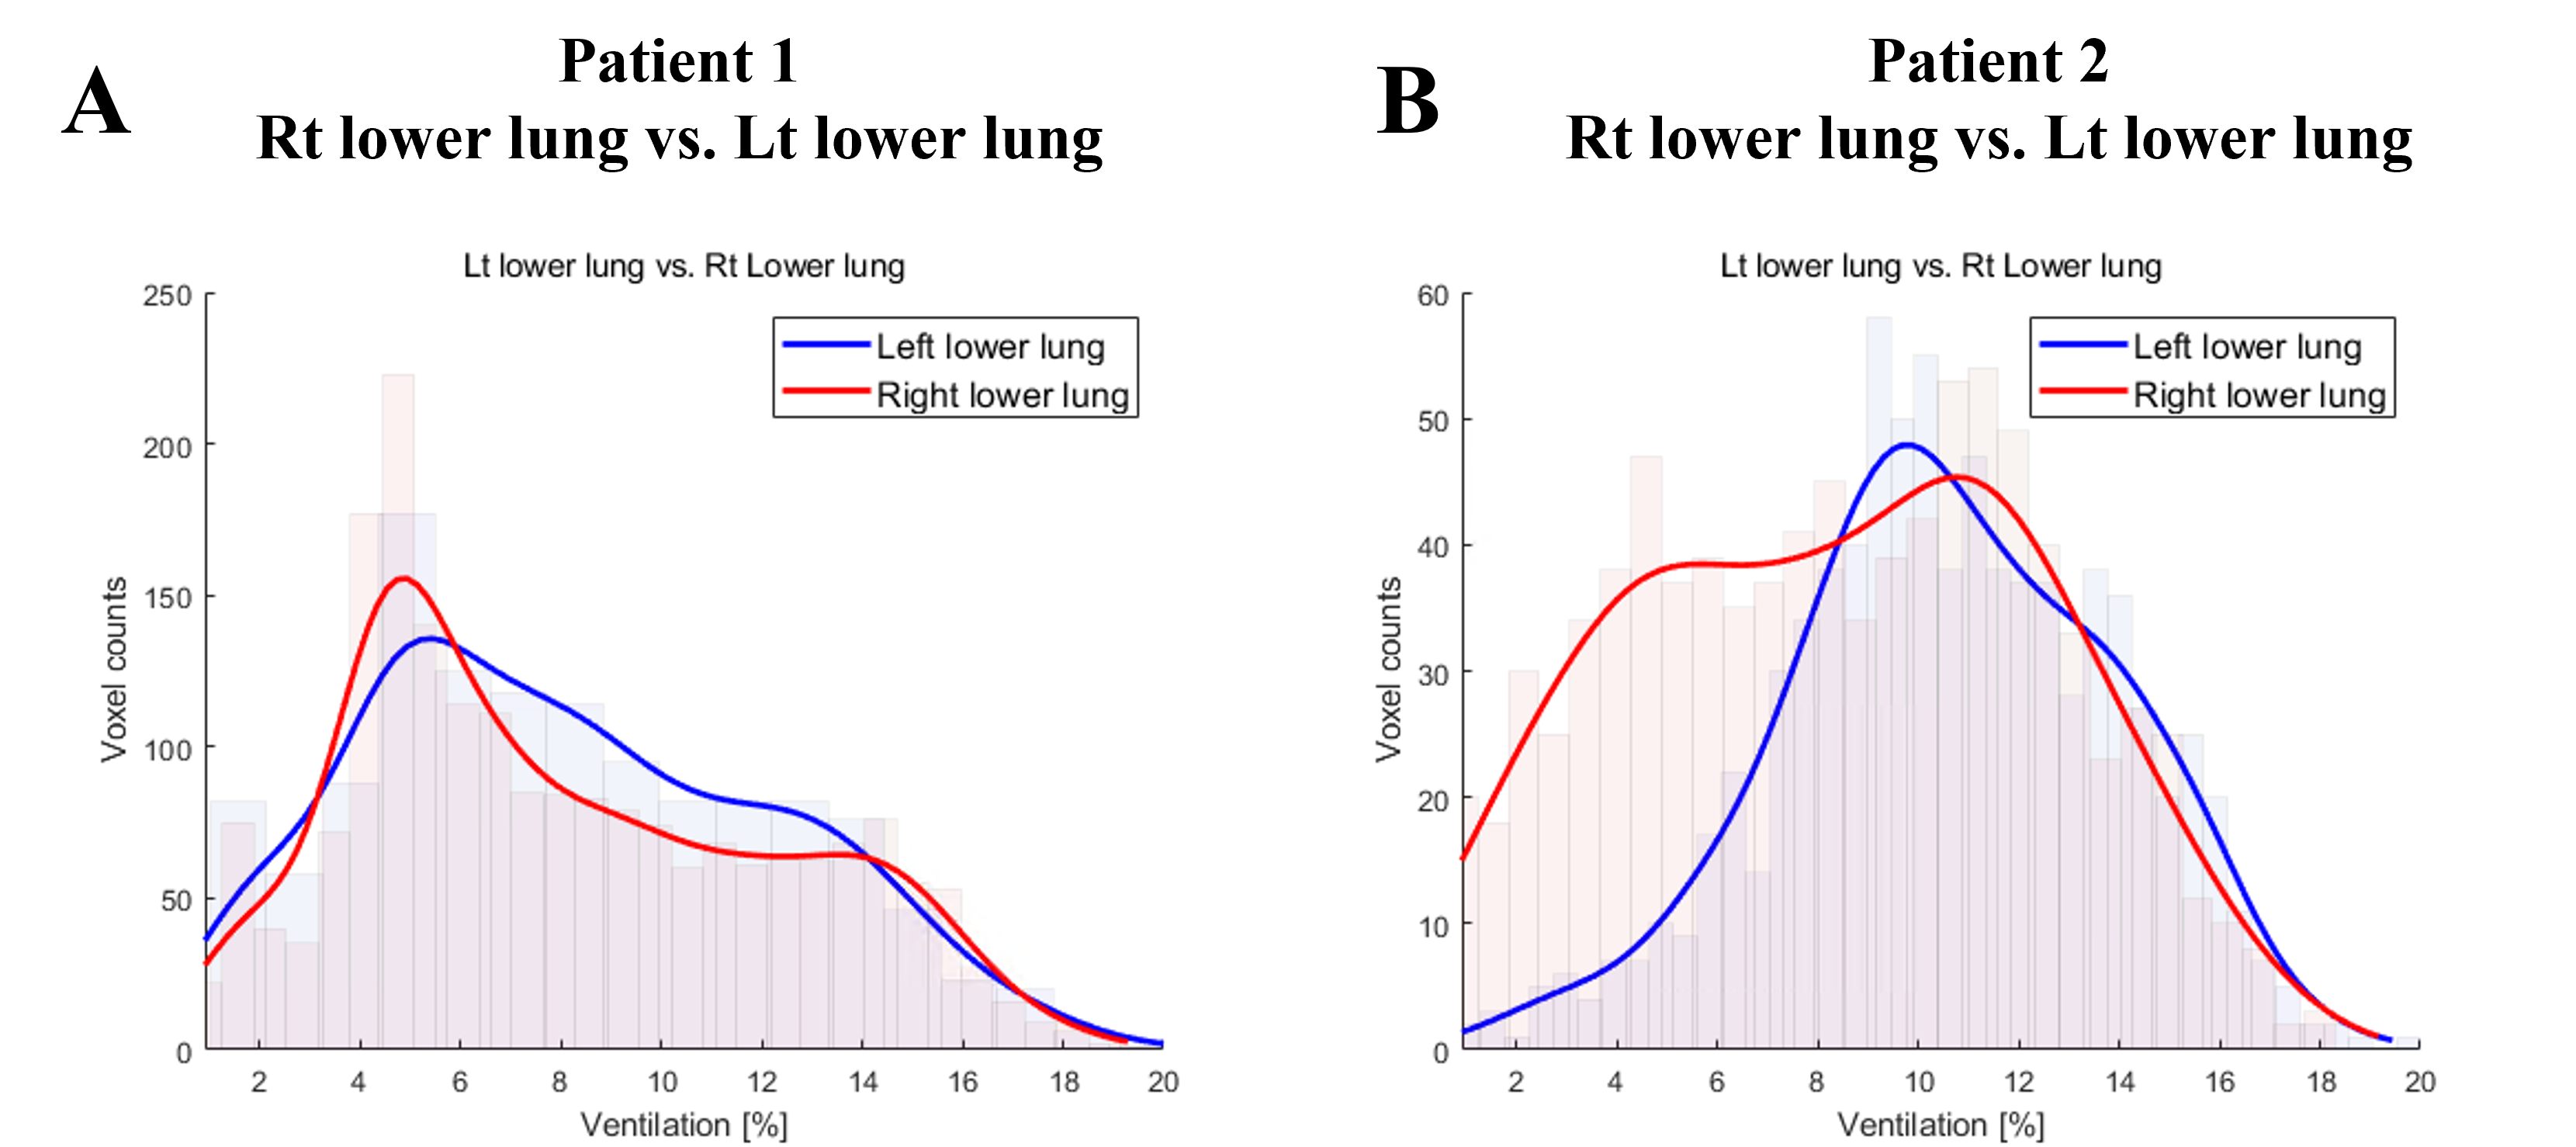
Figure 1 show the anatomical images of lung CT and UTE-MRI acquired at end-expiration(A,B,D,E) and show the pulmonary function map(C,F). As indicate by yellow arrows, the lesions seen in the CT images were also identified in the UTE images in the lower lobes. CT images(yellow arrows) clearly identify focal lesions and structural UTE images show fibrotic lung lesions. However, the signal of the lesion is low in the ventilation maps.Figure 2 shows histograms obtained from UTE-based functional maps for healthy subjects(A) and patients 1,2(B,C). Healthy subjects constructed histograms for the whole lung, however patients 1 and 2 constructed histograms for the lobe of the lesion, respectively. Figure 3 shows histograms of skewness (A) and kurtosis (B) for UTE-based ventilation function in healthy subjects and patients. For ventilation skewness, patients had lower skewness than healthy subjects. The reason is that the ventilation values of healthy subjects tend to have a higher signal than patients 1,2, and the skewness is skewed to the right because these ventilations are higher than the mean values of healthy subjects. Figure 4 shows histograms showing the ventilation signals in the left lower lung(LLL) and right lower lung(RLL) of patient 1 and patient 2, respectively. Patient 1's histogram (A) showed lesions of the IPF on bilateral basal lung, structural MRI (Fig.1B) and ventilation maps(Fig.1C). Plotting this on a histogram shows that the signal distributions for RLL and LLL are similar(A). In contrast, in patient 2, RLL had IPF lesions and LLL had no lesions. For this reason, the histogram(B) shows an RLL(red line) with a low signal distribution and an LLL(blue line) with a relatively high signal distribution. These results show that the ventilation map works well and can be used as a biomarker for using ventilation function based on the presence of lesions.
Conclusion
We also applied ventilation maps and structural UTE-MRI to IPF to show differences in lesion signals. We also found differences between healthy and IPF patients with respect to histograms of ventilation maps. Although only ventilation was analyzed in this preliminary study, phenotypic analysis, or early diagnosis of IPF disease is expected in parallel with ventilation flow14,15 analysis that can quantify airways. Further studies in a large patient population with restrictive lung disease are needed. It is expected that it will be possible to diagnose ventilation defects in lesions in patients with IPF using UTE-based 3D ventilation maps and histograms in combination with 3D UTE structural images.Acknowledgements
This work was supported by the National Research Foundation of Korea (NRF) grant funded by the Korea government (MSIT): NRF-2020R1A2B5B02002676, NRF-2021R1A4A5032806 and NRF-2018-Global Ph.D. Fellowship Program.References
1. Raghu G, Collard HR, Egan JJ et al An official ATS/ERS/JRS/ALAT clinical practice guideline: treatment of idiopathic pulmonary fibrosis: an update of the 2011 clinical practice guideline. Am J Respir Crit CareMed 2015 192(2):e3–e19.
2. Kolb M, Collard HR. Staging of idiopathic pulmonary fibrosis: past, present and future. Eur Respir Rev. 2014;23(132):220–4.
3. Sul, B., Flors, L., Cassani, J. et al. Volumetric characteristics of idiopathic pulmonary fibrosis lungs: computational analyses of high-resolution computed tomography images of lung lobes. Respir Res 2019 20, 216.
4. Scharm, Sarah C et al. Quantification of dual-energy CT-derived functional parameters as potential imaging markers for progression of idiopathic pulmonary fibrosis.European radiology vol. 31,9 2021: 6640-6651.
5. Robbie, Hasti et al. Evaluating disease severity in idiopathic pulmonary fibrosis. European respiratory review : an official journal of the European Respiratory Society vol. 26,145 170051. 6 Sep. 2017.
6. Wang, Jennifer M et al. Using hyperpolarized 129Xe MRI to quantify regional gas transfer in idiopathic pulmonary fibrosis. Thorax vol. 73,1 (2018): 21-28.
7. Johnson, Kevin M et al. Optimized 3D ultrashort echo time pulmonary MRI. Magnetic resonance in medicine vol. 70,5 (2013): 1241-50.
8. Mendes Pereira et al. UTE-SENSCEFUL: first results for 3D high-resolution lung ventilation imaging. Magn. Reson. Med. 2018;1-10
9. Zapke M et al. Magnetic resonance lung function--a breakthrough for lung imaging and functional assessment? A phantom study and clinical trial. Respir Res. 2006 Aug 6; 7:106. Radiology. 2019 Jul;292(1):216-225.
10. Jinil Park and Jang-Yeon Park. Reducing Streak Artifacts in 3D Radial Imaging Using Volume-Selective Signal Acquisition. Proc. Intl. Soc. Mag. Reson. Med. 28 (2020)
11. Jang-Yeon Park et al. Short echo-time 3D radial gradient-echo MRI using concurrent dephasing and excitation. Magn. Reson. Med. 2012; 67 (2): 428–436.
12. Jinil Park et al. A radial sampling strategy for uniform k-space coverage with retrospective respiratory gating in 3D ultrashort-echo-time lung imaging. NMR Biomed. 2016; 29: 576–587.
13. Jinil Park et al. A Robust Self-navigation for Respiratory Gating in 3D Radial Ultrashort Echo-time Lung MRI using Concurrent Dephasing and Excitation. Journal of the Korean Physical Society, Vol. 73, No. 1, July 2018, pp. 138∼144..
14. Andreas Voskrebenzev et al. Feasibility of quantitative regional ventilation and perfusion mapping with phase-resolved functional lung (PREFUL) MRI in healthy volunteers and COPD, CTEPH, and CF patients. Magn Reson Med . 2018 Apr;79(4):2306-2314.
15. Seokwon Lee et al. Identification of COPD Lesions Using 3D Ultrashort Echo-Time Imaging with Ventilation Map and Ventilation Flow Map. Proc. Intl. Soc. Mag. Reson. Med. 3223 (2021)
Figures