4263
A Strategy of Whole Blood Metabolomics Based on Magnetic Resonance Spectroscopy by Mixing Blood with Silica Powder1Radiology, Massachusetts General Hospital, Boston, MA, United States, 2Harvard Medical School, Boston, MA, United States, 3Nanjing University, Nanjing, China, 4Molecular Pathology, Massachusetts General Hospital, Boston, MA, United States, 5Imperial College London, London, United Kingdom
Synopsis
Keywords: Screening, Spectroscopy, Gelified Biofluids
Currently, blood metabolomics analysis has to choose between serum and plasma: the former leaves blood in room temperature and therefore causing metabolic alterations; and the latter has interfering chemicals added during acquisition of samples, which make results complicated. Here, using HRMAS MRS, we studied gel samples of whole mouse blood by mixing them with silica powder. The obtained spectra agreed, in general, with the correlating serum samples, which proved the robustness of this method. Taking advantage of tiny amounts of samples (μl) and simple and rapid pretreatment, our new technique demonstrates a novel approach to metabolomic analysis and clinical applications.Introduction
Metabolomics is an emerging research field for the global assessment and validation of small-molecule metabolites in affording a better understanding of biological systems1. Various biofluids are available for employment including blood, serum, urine, saliva, and cerebrospinal fluid and each has a number of advantages that have made metabolomics a versatile tool in research practice2.Among biofluids for metabolomic analysis, the advantages of blood in clinical practice, namely that it is readily accessible and minimally invasive to patients have made it one of the most commonly used types. Most metabolomic analyses were performed either on plasma or serum. However, which one is more suitable for metabolomic analysis remains controversial3. While a number of studies have turned to whole blood analysis in an effort to find another solution, complicated chemical extraction or pretreatments were required for the samples of whole blood and direct investigation of the whole blood was avoided4, 5. Moreover, relatively larger sample volumes have prevented improvement in the efficiency and accuracy of metabolomic studies. Inspired by a urine silica get study, here we tested the utility of the method in studying mouse whole blood6.
Methods
Silica powder was purchased from ThermoFisher Scientific. 6-week-old Nod.Cg-PrkdcSCIDIL2Rγ/SzJ (NSG) mice (Jackson Laboratories) were implanted subcutaneously with two different PDX (patient-derived xenograft) models of diffuse large B-cell lymphoma. Mice were monitored twice weekly by caliper measurement to assess tumor volume. At sacrifice, to test the feasibility of this whole-blood-measuring method, one whole blood silica gel sample and one serum sample for each mouse were obtained. The Mice were euthanized by CO2 asphyxiation at day 51 post-implantation, and 500 μl of blood was drawn from the heart via cardiac puncture. Serum was isolated from the whole blood samples by placing the whole blood sample in ice for 30 minutes and then centrifuge (4 degrees) at 500g for 5 minutes. For each mouse, 80 μL of the whole blood was added to a cryogenic vial containing 12 mg of prepared silica powder, then the mixture was stirred until thoroughly combined to make a uniform blood gel. All serum and whole blood samples were stored at -80°C until metabolomics analyses.For MAS measuring, 10 μL of the serum sample (thawed overnight) or 8~10 mg whole blood sample (blood gel without thawing) was added to the rotor in addition to 2.0 μL of D2O. HRMAS MRS data were collected on a Bruker AVANCE III HD 600MHz instrument, at 4ºC, with a spinning rate of 5000 Hz, and with rotor-synchronized CPMG method. Correction of the spectra was carried out in Nuts Pro, then the ppm and intensity values were exported into text files.
To quantify the similarity between the metabolomic measurement results of the whole blood and serum, a program based on Python 3.9 was developed. Text files containing ppm and intensity values were imported, according to which the images of spectra were plotted. By employing a method of image similarity calculation on the basis of pixel variance analysis, the difference between the generated spectral images was calculated and presented as a percentage. The output “difference” in the program was defined as:
$$Difference=\frac{variance\space of\space whole\space blood -variance\space of\space serum}{variance\space of\space serum}$$
The program had been used to test other spectra in previous studies and had been proven reliable. In addition, the differences were further analyzed statistically by paired t-test in Microsoft Excel 2019, where the intensity values of the whole blood sample and of the serum sample in the same region from the same mouse were paired.
Results
Following the best blood-silica ratio, the blood gels were homogeneous and suitable for HRMAS MRS measurement. Without the presence of protons, the silica would cause no interference in the 1H MRS measurement.The examples of spectra generated are shown in Fig 1, with the difference between whole blood and serum samples of mouse (a) reaching 9.63% in program testing, while for mouse (b) it was only 0.01%. According to our previous studies, two spectra can be considered significantly similar with a difference below 10%, which indicates the metabolomic measurement results of whole blood and serum samples of both mice were similar. This was further validated by a paired t-test between the whole blood and serum samples, with the p values of both mice close to 1, suggesting a significant similarity between them.
Discussion & Conclusion
The results indicated that whole blood could be used to substitute serum for metabolomic analysis. As an innovative pilot study probing into the capabilities of whole blood in MRS-based metabolomic analysis with micro-scale blood samples and an interference-free chemical, our method provided an alternative option for metabolomic profiling approach of blood. In addition to the current comparisons between the metabolomic measurement results of whole blood and serum samples, further comparisons between whole blood and plasma samples from groups of mouse types are currently underway for a more comprehensive evaluation of this methodology. This reported method simplifies procedures for whole blood MRS tests and requires only samples in a 10-microliter scale that can be sampled with a finger prick blood sampling for human applications.Acknowledgements
This study is supported in part by NIH grants AG070257, CA273010, and by MGH Martinos Center for Biomedical Imaging.
References
1. Emwas AM, Salek RM, Griffin JL, et al. NMR-based metabolomics in human disease diagnosis: applications, limitations, and recommendations. Metabolomics. 2013;9:1048-1072.
2. Zhang A, Sun H, Wang P, et al. Recent and potential developments of biofluid analyses in metabolomics. Journal of Proteomics. 2011;75:1079-1088.
3. Wedge DC, Allwood W, Dunn W, et al. Is Serum or Plasma More Appropriate for Intersubject Comparisonsin Metabolomic Studies? An Assessment in Patients with Small-Cell Lung Cancer. Anal. Chem. 2011;83:6689-6697.
4. Bailey SAB, Niemuth JN, McClellan-Green PD, et al. 1H-NMR metabolomic study of whole blood from hatchling loggerhead seaturtles (Caretta caretta)exposed to crude oil and/or Corexit. R. Soc. Open. Sci. 2017;4:171433.
5. Kennedy AD, Ford L, Wittmann B, et al. Global biochemical analysis of plasma, serum and whole blood collected using various anticoagulant additives. PLoS ONE. 2021;16(4): e0249797.
6. Takis PG, Tenori L, Ravera E, Luchinat C. Gelified Biofluids for High-Resolution Magic Angle Spinning 1H NMR Analysis: The Case of Urine. Anal Chem. 2017 Jan 17;89(2):1054-1058.
Figures
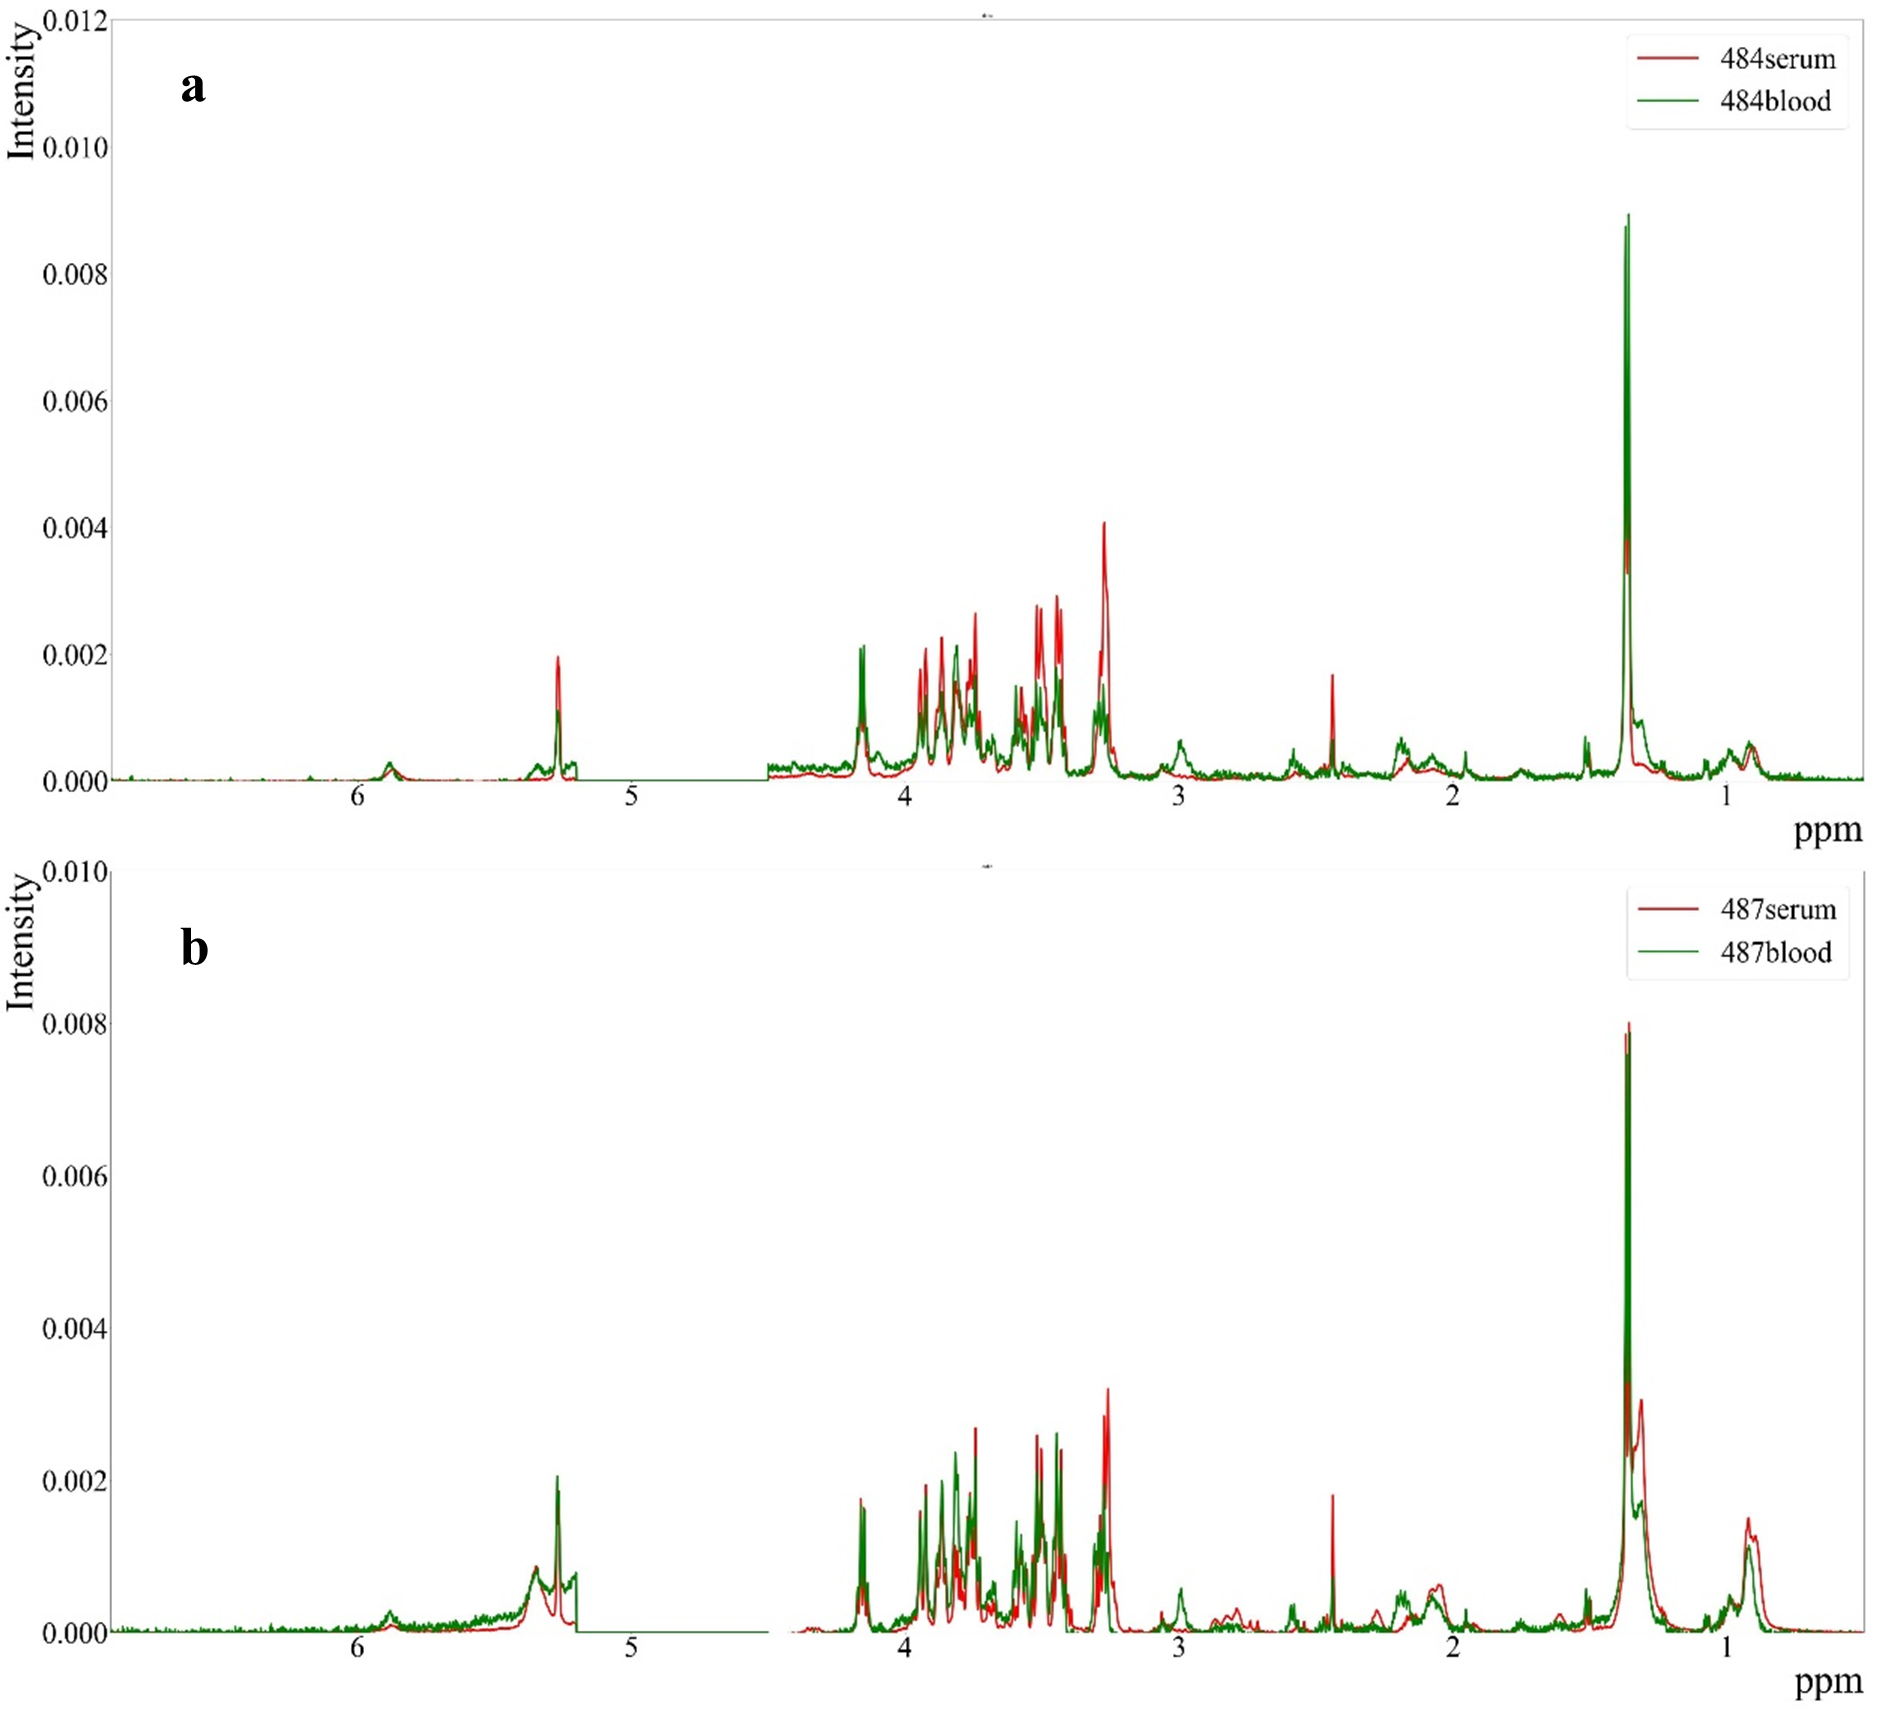
Fig 1. Comparisons between spectral intensities of whole blood and serum samples from mouse (a) and (b)