4225
Estimation of isotropic and anisotropic biomechanical properties of the lower leg muscle during muscle contraction using DTI and MR elastography1Charité - Universitätsmedizin Berlin, Berlin, Germany
Synopsis
Keywords: Elastography, Elastography
In this study, DTI and multifrequency MR elastography (MRE) were applied to 6 subjects to investigate the changes of fiber orientation and the biomechanical properties of the lower leg muscle during passive plantarflexion and dorsiflexion. Using the pentation angle estimated from DTI, MRE data were processed to obtain both isotropic shear wave speed (c) and anisotropic shear moduli (μ12, μ13) as well as Young’s modulus (E3). Preliminary findings showed significant changes of the biophysical properties upon lower leg muscle contraction.Introduction
Lower leg muscle has an anisotropic and highly hierarchic tissue structure. Therefore, biomechanical characterization of these muscle requires knowledge of anisotropy, that is fiber orientation and directionality of stiffness parameters1. In this study, we used a three-parameter shear wave inversion method2 based on the theory of linear elasticity of incompressible transverse isotropic (TI) materials to quantify the anisotropic biomechanical properties of lower leg muscle and their changes with muscle function. To account for local fiber orientation and to align MRE wavefields to the coordinate system that is prescribed by the muscle architecture, tractography based on DTI was performed.Methods
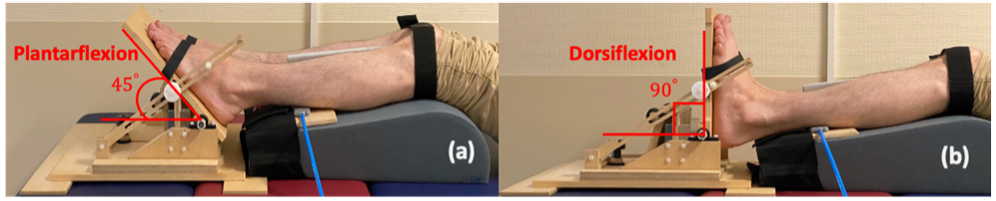
Six male healthy subjects (age: 29 years±3) were recruited and two lower-leg muscle groups (tibialis anterior (TibA), tibialis posterior (TibP)) were investigated using a 3T MRI scanner (MAGNETOM Lumina, Siemens Healthineers) with a 12-channel phased array surface coil. Both legs of the patient were scanned simultaneously. For imaging, an MRI-compatible device was designed to passively contract the muscle of both legs by providing feet fixation and adjustable ankle bending. As shown in Fig.1, 45° and 90° angle settings on the device were considered as plantarflexion and dorsiflexion, respectively. For MRE, mechanical vibrations (30, 40 and 50 Hz) were applied sequentially to the muscle groups through two compressed-air powered pads3 which were fixed onto a wooden board and equally positioned directly under the lower legs (Fig.1). The 3D wave fields were acquired by a single-shot SE-EPI sequence with a bipolar flow-compensated motion-encoding gradient (MEG). Eight dynamics of a wave cycle were measured. Thirty consecutive transversal slices with voxel size of 2x2x2 mm3 were acquired in approximately 4 minutes. DTI data were acquired with 20 gradient directions for b-values of 0 and 500 s/mm2 in approximately 6 minutes and the image resolutions were identical to that of MRE. In addition to MRE and DTI, axial T1w images with voxel size of 0.82x0.82x4 were acquired for anatomical references. For MRE postprocessing, two inversion approaches were used: first, isotropic wavenumber-based (k) multifrequency elasto-visco (k-MDEV) method4 yielded maps of shear wave speed (c in m/s) which surrogates stiffness. Second, anisotropic inversion was used to obtain µ12, µ13 and E3 which correspond to two shear moduli (within the planes of isotropy and symmetry of TI materials) and Young’s modulus (along the principal fiber axis). Prior to the anisotropic inversion, wave field was rotated to align with the muscle fiber orientation. Angles used for rotation were calculated taking projections of the pennation angles (PA) obtained from DTI tractography. DTI data was processed using FSL5 for quantifying fractional anisotropy (FA) and mean diffusivity (MD), tractography was performed using DSI studio6. MRE and DTI data were co-registered and the regions of interest (ROIs) were manually drawn in all slices. For statistical analysis, Wilcoxon signed-rank test was used.Results
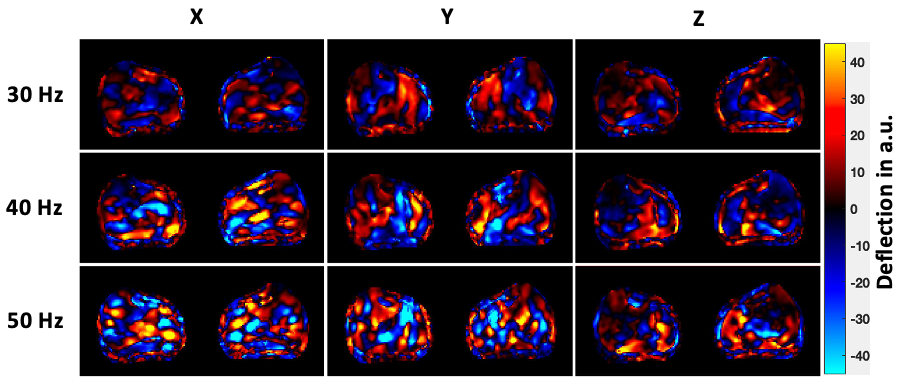
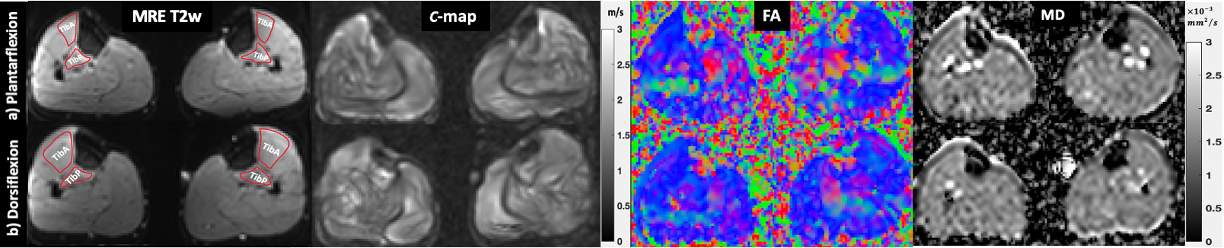
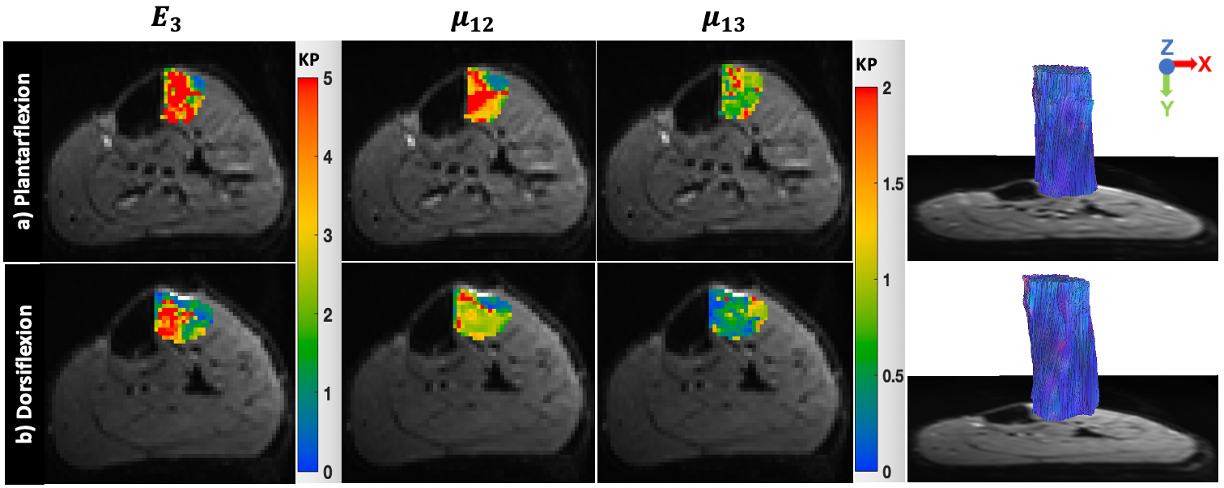
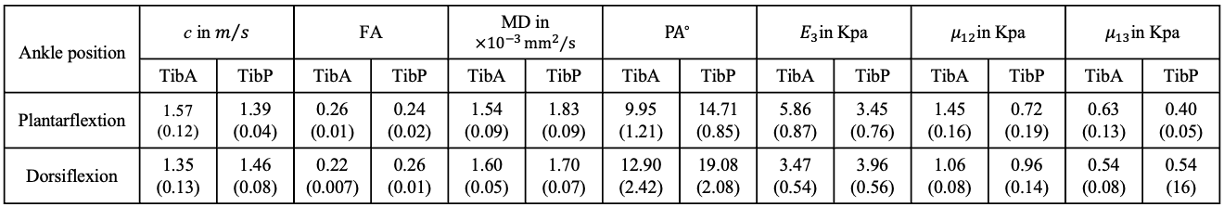
Wave images at 30, 40 and 50 Hz propagating at three MEG directions are selectively shown for one subject in Fig.2. MRE T2w magnitude image and the corresponding c, color-coded FA- and MD-maps of the same volunteer are presented in Fig.3. Tractography results and maps of anisotropic parameter for TibA are depicted in Fig.4. Based on the group mean values, we found that from plantarflexion and dorsiflexion, TibP displayed a significant increase in c, FA, PA, µ12, µ13 and E3 (p=0.03) which was accompanied by a significant decrease in MD (p=0.031). In contrast to TibP, TibA softened significantly at dorsiflexion along with significantly lower c, FA, µ12, µ13 and E3 (p=0.03) and a significant increase in MD and PA (p=0.03). Mean values of all imaging parameters in the muscle groups at different ankle position are collected in a table shown in Fig.5.Discussion
Based on our preliminary results, we firstly observed that both stiffness and fiber anisotropy of TibA and TibP behaved in the opposite way when moving between plantarflexion and dorsiflexion. This observation was consistent with anatomic and functional changes in these two muscles as TibA antagonizes TibP. Secondly, increase in stiffness was associated with elevated FA, and vice versa. More specifically, muscles elongation (for TibP from plantarflexion to dorsiflexion, for TibA from dorsiflexion to plantarflexion) resulted in a higher degree of fiber alignment and, consequently, increase in anisotropy (FA). In addition, elongation of the muscle reduced inter fiber space, thereby restricting water mobility7 which resulted in the observed reduction of MD. Biomechanically, muscle elongation led to increased muscle tension and fiber anisotropy resulting in a ‘wave-guide’ effect8 that accelerated the shear wave propagation and increased c values and moduli µ12, µ13 and E3.Conclusion
In this preliminary study, we have characterized the biophysical properties of the lower leg muscles at a plantarflexion and dorsiflexion ankle position in healthy volunteers using MRE and DTI. Both biomechanical properties and water diffusion revealed changes in the microstructure such as alignment of muscle fibers in the lower leg upon alteration of the ankle position. DTI was used to align MRE wave fields to the muscle fiber tracts and to explore the optimal ‘wave-guide’ effect caused by tissue anisotropy. Our results were promising but need further validation in other muscle groups.Acknowledgements
No acknowledgement found.References
1. Green, M. A., Geng, G., Qin, E., Sinkus, R., Gandevia, S. C., & Bilston, L. E. (2013). Measuring anisotropic muscle stiffness properties using elastography. NMR in Biomedicine, 26(11), 1387-1394.
2. Guo, J., Hirsch, S., Scheel, M., Braun, J., & Sack, I. (2016). Three‐parameter shear wave inversion in MR elastography of incompressible transverse isotropic media: Application to In Vivo Lower Leg Muscles. Magnetic resonance in medicine, 75(4), 1537-1545.
3. Braun, J., Hirsch, S., Heinze, T., & Sack, I. (2015). Feasibility of a new actuator type for magnetic resonance elastography based on transient air pressure impulses. In Proc 23rd Annual Annual Meeting ISMRM.
4. Tzschätzsch, H., Guo, J., Dittmann, F., Hirsch, S., Barnhill, E., Jöhrens, K., ... & Sack, I. (2016). Tomoelastography by multifrequency wave number recovery from time-harmonic propagating shear waves. Medical image analysis, 30, 1-10.
5. Woolrich, M. W., Jbabdi, S., Patenaude, B., Chappell, M., Makni, S., Behrens, T., ... & Smith, S. M. (2009). Bayesian analysis of neuroimaging data in FSL. Neuroimage, 45(1), S173-S186.
6. Yeh, F. C., Verstynen, T. D., Wang, Y., Fernández-Miranda, J. C., & Tseng, W. Y. I. (2013). Deterministic diffusion fiber tracking improved by quantitative anisotropy. PloS one, 8(11), e80713.
7. Schwenzer, N. F., Steidle, G., Martirosian, P., Schraml, C., Springer, F., Claussen, C. D., & Schick, F. (2009). Diffusion tensor imaging of the human calf muscle: distinct changes in fractional anisotropy and mean diffusion due to passive muscle shortening and stretching. NMR in Biomedicine: An International Journal Devoted to the Development and Application of Magnetic Resonance In vivo, 22(10), 1047-1053.
8. Romano, A., Scheel, M., Hirsch, S., Braun, J., & Sack, I. (2012). In vivo waveguide elastography of white matter tracts in the human brain. Magnetic resonance in medicine, 68(5), 1410-1422.
Figures