4224
Magnetic resonance fingerprinting thermometry (MRFT) versus PRFS thermometry: comparative temperature prediction in ex vivo bovine muscle
Enlin Qian1, Pavan Poojar2, Maggie Fung3, Zhezhen Jin4, John Thomas Vaughan1, Devashish Shrivastava1, David Gultekin1, and Sairam Geethanath2
1Columbia Magnetic Resonance Research Center, Columbia University, New York, NY, United States, 2Accessible MR Laboratory, Biomedical Engineering and Imaging Institute, Dept. of Diagnostic, Molecular and Interventional Radiology, Icahn School of Medicine at Mt. Sinai, New York, NY, United States, 3GE Healthcare, New York, NY, United States, 4Department of Biostatistics, Columbia University, New York, NY, United States
1Columbia Magnetic Resonance Research Center, Columbia University, New York, NY, United States, 2Accessible MR Laboratory, Biomedical Engineering and Imaging Institute, Dept. of Diagnostic, Molecular and Interventional Radiology, Icahn School of Medicine at Mt. Sinai, New York, NY, United States, 3GE Healthcare, New York, NY, United States, 4Department of Biostatistics, Columbia University, New York, NY, United States
Synopsis
Keywords: Safety, Safety
We explored T1-based magnetic resonance fingerprinting thermometry (MRFT) and compared it with proton resonance frequency shift (PRFS) thermometry in ex vivo bovine muscle data. We conducted temperature sensitivity calibration experiments for both methods. We compared MRFT and PRFS thermometry predicted temperatures in bovine muscles, validated by fluoroptic probe measurements. We observed strong correlation in temperature sensitivity calibration experiments (R2>0.958). Both methods predict temperature accurately (RMSE<1.37 ℃ and RMSE<0.93 ℃ for MRFT and PRFS, over a range of 25 ℃). We observed strong correlation between PRFS and MRFT predicted temperature in heated bovine muscle (R2>0.93).Introduction
MR thermometry provides noninvasive temperature measurements in near real-time. Proton resonance frequency shift (PRFS) MR thermometry is the most commonly used method clinically but is vulnerable to challenges such as inter-scan motions, temperature underestimation in adipose tissues, and requirements of reference scans 1.In this work, we demonstrate magnetic resonance fingerprinting thermometry (MRFT) by exploiting T1 relaxation time’s dependence on temperature and compare it with PRFS thermometry by comparing predicted temperatures in ex-vivo bovine muscles.
Methods
MRF implementationThe TR/FA scheme of the MRF sequence used parameters reported in previous literature 2, 3. The raw data were reconstructed using singular value decomposition (SVD) based dictionary matching in MATLAB (MathWorks, Nattick, MA).
MRFT temperature sensitivity calibration experiment
Figure 1(a) shows the setup for the temperature sensitivity calibration experiment. The MR protocol for the calibration experiment consisted of a turbo spin echo (TSE) structure scan, followed by an MRF sequence every five minutes for two hours. The linear relationship between temperature (T) and T1 can be expressed as in ref 1:
$$T1 = m*T+b$$
Where m and b are tissue-specific and can be determined using calibration methods.
PRFS temperature sensitivity calibration experiment
Figure 1(b) shows the setup for the temperature sensitivity calibration experiment. We performed the calibration experiment using a SPoiled Gradient-Recalled (SPGR) sequence with the following parameters: TR=100 ms, TE=4.2 ms, flip angle=36°, FOV of 25 cm × 25 cm, slice thickness=5 mm, matrix size=225×225, excitation bandwidth=1.3 kHz, readout bandwidth=0.5 kHz/pixel, acquisition time=16 sec. The MR protocol for the calibration experiment consisted of a turbo spin echo (TSE) structure scan, followed by an SPGR sequence every five minutes for two hours.
We calculated Δs based on the equations presented in ref 4, 5. The linear relationship between change in temperature (ΔT) and change in phase (Δɸ) can be expressed as:
$$Δs=⍺ΔT+b$$
Where ⍺ is the thermal coefficient in ppm/°C and b is a constant.
MRFT/PRFS thermometry experiment
We repeated the same setup in Figure 1, but with different bovine muscle samples. The experiment protocol included a turbo spin echo (TSE) structure scan, followed by an MRF sequence and an SPGR sequence every five minutes for two hours. We produced the temperature maps using the calibration equations described above. The results from both methods were compared with the gold standard fluoroptic probes measurements.
Results/Discussion
MRF temperature sensitivity calibration experimentFigure 2(a) shows that the T1 decreased as the heated bovine muscle (bottom) cooled down and T1 increased as the cold bovine muscle (top) heated up for the first 110 minutes of the calibration experiment. The cold muscle showed longer T1 than the heated muscle because the heated muscle lost water during the heating process which we drained. Figure 3(a) presents the best fit line for the center of cold muscle and the center and periphery of heated muscle and their respective R2 statistics using simple linear regression. The R2 values indicate a strong linear relationship (R2>0.9883). The slopes for probe 3 and probe 4 are very similar (5 ms/°C) because they are from the same heated bovine muscle. This linear relationship between temperature and T1 agrees with previous literature 6.
PRFS temperature sensitivity calibration experiment
Figure 2(b) shows that the Δs increased as the heated bovine muscle (bottom) cooled down and Δs decreased as the cold bovine muscle (top) heated up for the first 110 minutes of the calibration experiment. Figure 3(b) presents the best fit line for the center of cold muscle and the center and periphery of heated muscle and their respective R2 statistics using simple linear regression. The R2 values indicate a strong linear relationship (R2>0.9583). The thermal coefficient ⍺ of cold bovine muscle is larger than heating muscle because heated muscle lost water during the heating process. Our values of ⍺ agree with previous literature 1.
MRFT/PRFS thermometry experiment
Figure 4 shows the comparison of PRFS thermometry predicted temperature, MRFT predicted temperature, and fluoroptic probe measurements. The RMSE of PRFS and MRFT are presented in the figure. Errors may be attributed to temporal averaging during data processing. PRFS thermometry produced a smaller RMSE compared to MRFT. Heated muscle produced larger errors compared to cold muscle due to inhomogeneous heating for both methods.
Figure 5 presents the correlation plots between PRFS thermometry and MRFT predicted temperature for probe 3 and probe 4. We observed a strong correlation for probe 3 and probe 4 (R2>0.926). No correlation was performed for probe 1 because the change in temperature was too small. No meaningful correlation could be observed between PRFS thermometry and MRFT predicted temperature for probe 1.
Conclusion
In this study, we investigated the feasibility of measuring temperature using T1-based MRF thermometry. The calibration experiments show strong correlations for both methods (R2 > 0.958). We observed MRFT is able to predict temperature accurately (RMSE<1.3688 °C), similar to PRFS thermometry predicted temperature (RMSE<0.934 °C). PRFS thermometry and MRFT predicted temperature show strong correlations (R2 > 0.926) for heated bovine muscle center and periphery. The T1-based MRFT can mitigate challenges in PRFS thermometry such as motion and inaccuracies in adipose tissues.Acknowledgements
This work was supported, in part, by GE-Columbia research partnership grant and also performed at Zuckerman Mind Brain Behavior Institute MRI Platform, a shared resource, and Columbia MR Research Center site. The subject matter, content, and views presented do not represent the views of the Department of Health and Human Services (HHS), US Food and Drug Administration (FDA), and/or the United States.References
- Odéen H, Parker DL: Magnetic resonance thermometry and its biological applications – Physical principles and practical considerations. Progress in Nuclear Magnetic Resonance Spectroscopy 2019:34–61.
- Jiang, Y., Ma, D., Seiberlich, N., Gulani, V., & Griswold, M. A. (2015). MR fingerprinting using fast imaging with steady state precession (FISP) with spiral readout. Magnetic Resonance in Medicine. https://doi.org/10.1002/mrm.25559
- Shridhar Konar A, Qian E, Geethanath S, et al.: Quantitative imaging metrics derived from magnetic resonance fingerprinting using ISMRM/NIST MRI system phantom: An international multicenter repeatability and reproducibility study. Med Phys 2021.
- Winter L, Oberacker E, Paul K, et al.: Magnetic resonance thermometry: Methodology, pitfalls and practical solutions. Int J Hyperthermia 2016; 32:63–75.
- Peters RD: Magnetic resonance thermometry for image-guided thermal therapy. Toronto: University of Toronto 2000.
- Nelson TR, Tung SM: Temperature dependence of proton relaxation times in vitro. Magn Reson Imaging 1987; 5:189–199.
Figures
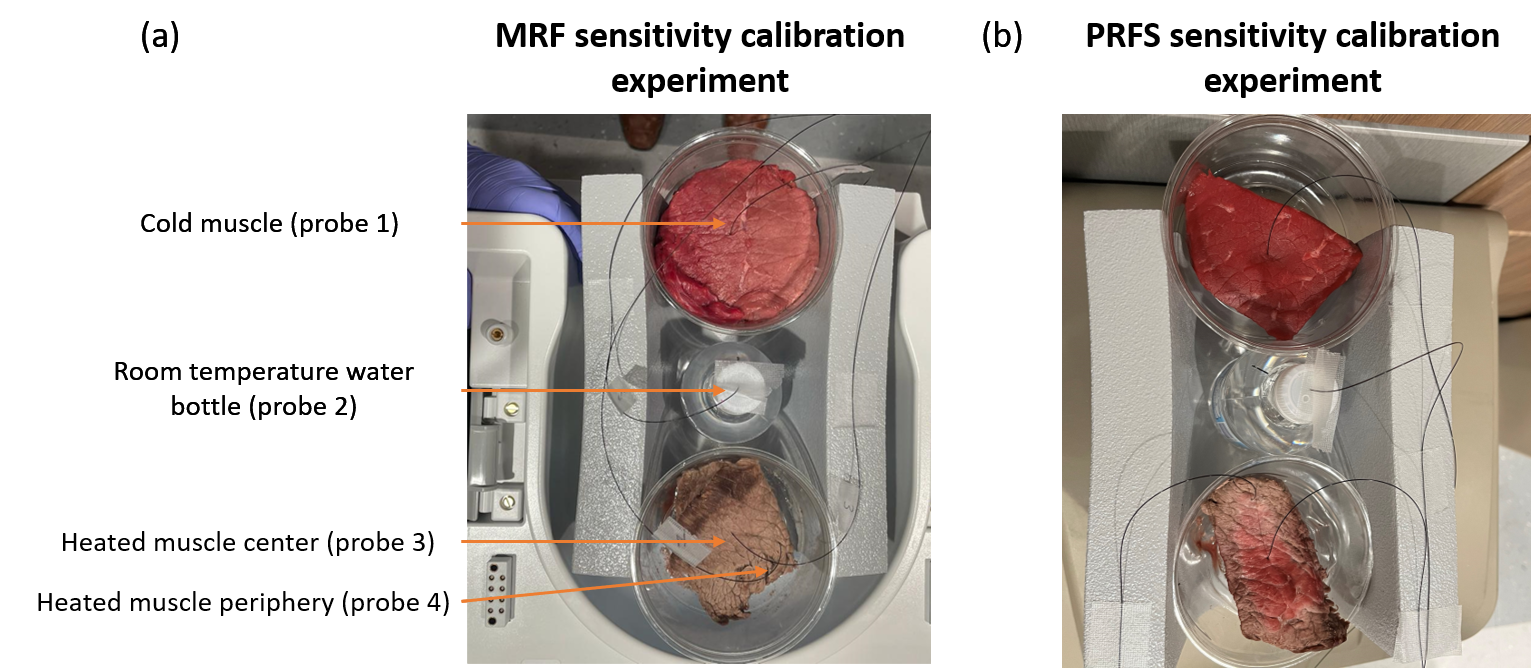
Figure 1: Figure 1 shows the setup for (a) MRF temperature sensitivity calibration experiment and (b) PRFS temperature sensitivity calibration experiment. The calibration experiment and MRFT/PRFS experiment consist of three parts: cold muscle, a room temperature water bottle, and heated muscle. Four fluoroptic probes were used to measure the temperature of the center of a cold muscle, the room temperature water bottle, and the center and periphery of the heated muscle. Different muscle samples were used for two experiments.
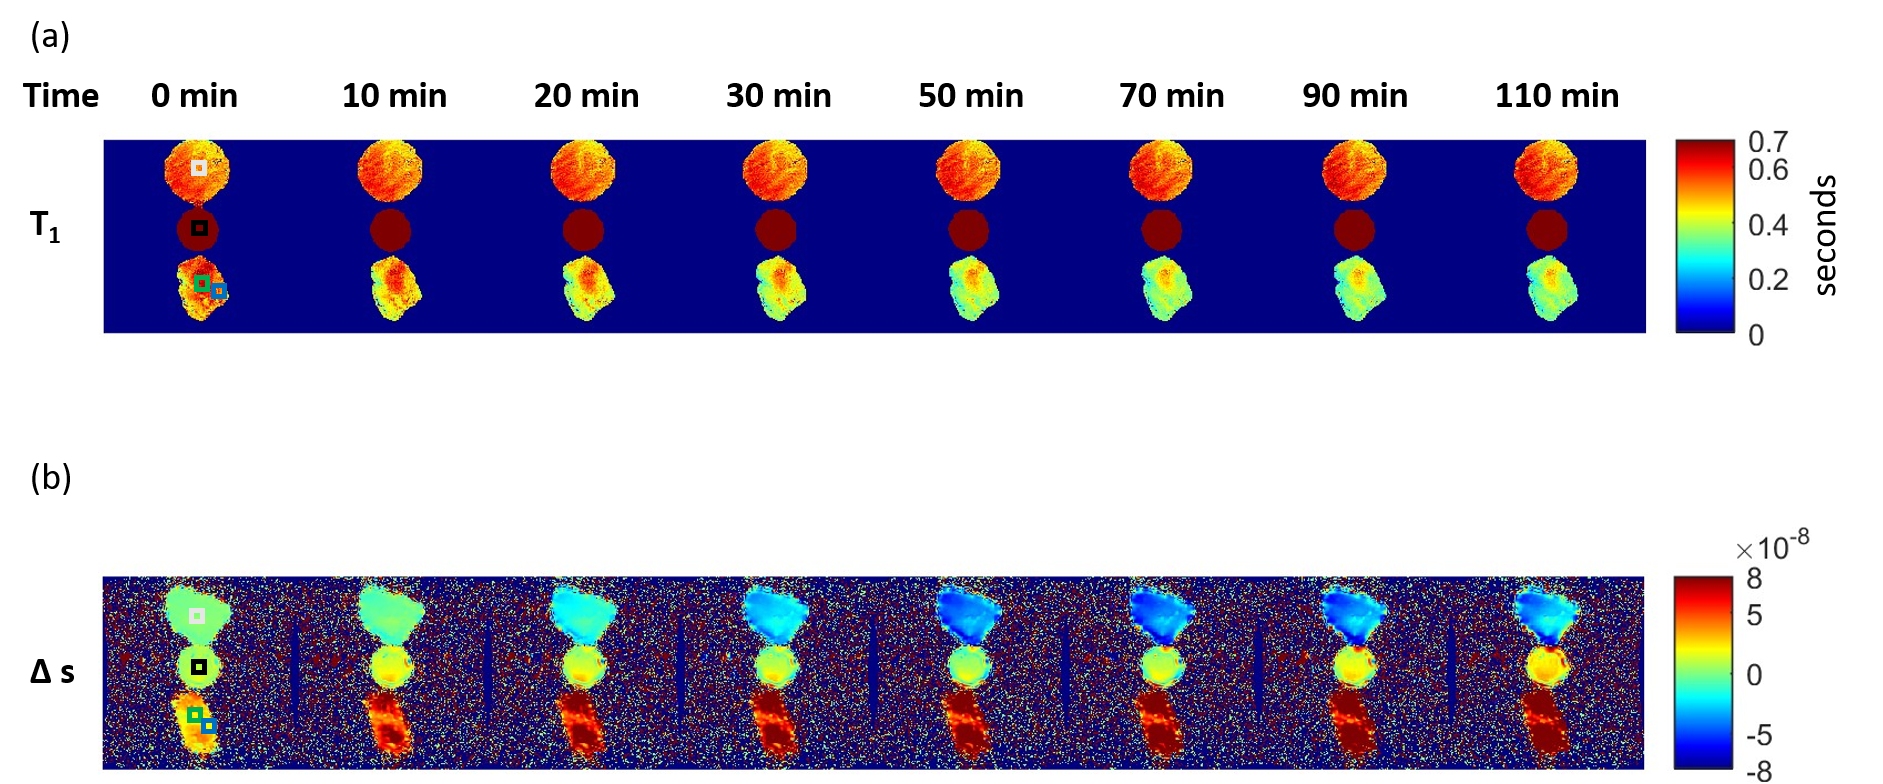
Figure 2: Figure 2 shows (a) a series of T1 maps acquired using MRF at the first 110 minutes during the calibration experiment. The time represents the total time from the beginning of the experiment. Regions of interest (ROI) are drawn based on the locations of the probes to calculate the T1 estimations around the probes. Each ROI contains 60 voxels. (b) a series of Δs maps acquired using SPGR at the first 110 minutes during the calibration experiment. The time represents the total time from the beginning of the experiment.
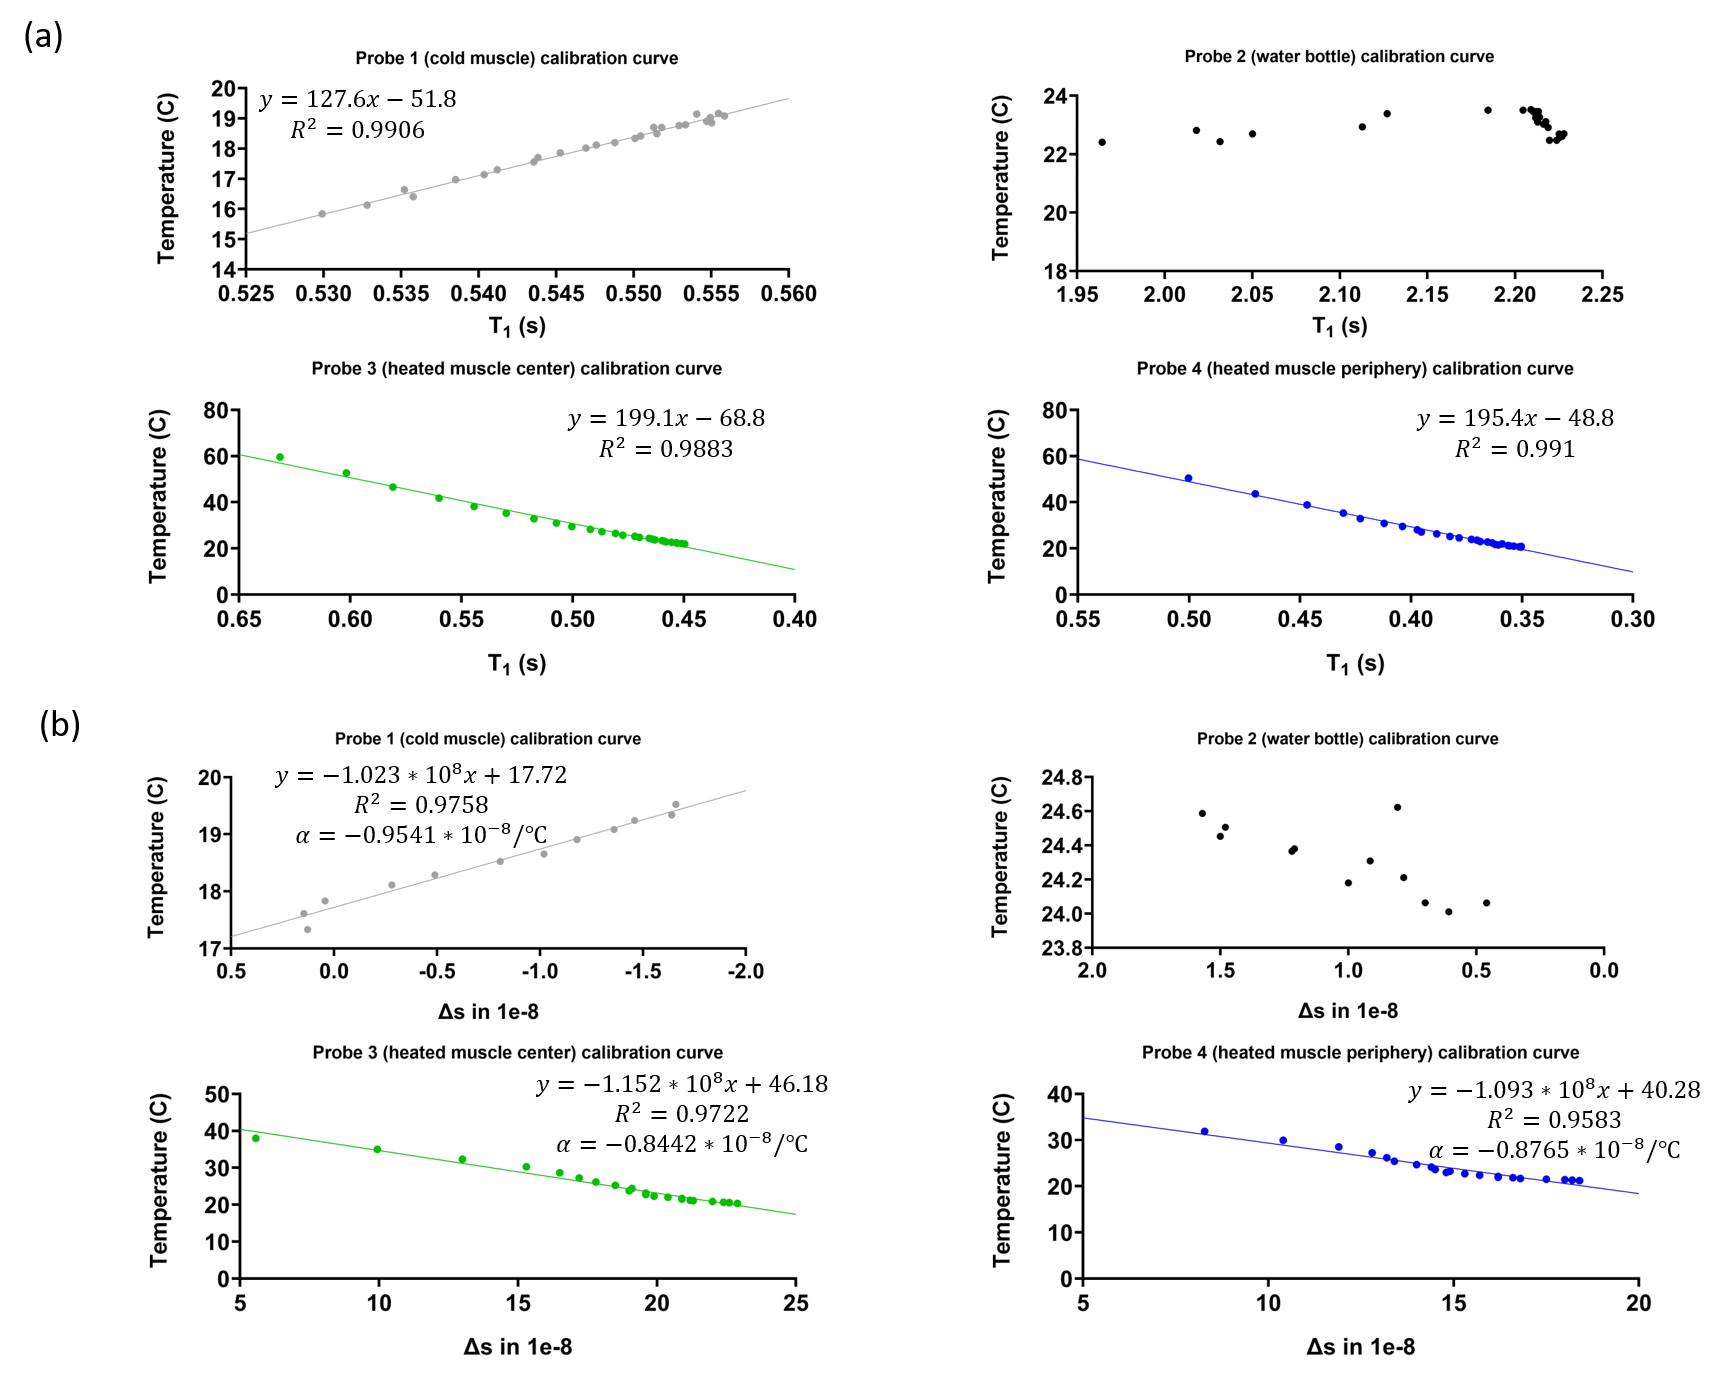
Figure 3: Figure 3 shows (a) The mean of T1 estimations calculated using ROIs over the measured fluoroptic probe temperatures for all probes and the resulting fit using least squared fitting. The best equation for the best-fitted line and their R2 values are presented in the figure. No fitting was performed for the reference water. (b) The mean of Δs estimations were calculated using ROIs over the measured fluoroptic probe temperatures for all probes and the resulting fit using least squared fitting. The best equation for best-fitted line and their R2 values are presented in the figure.
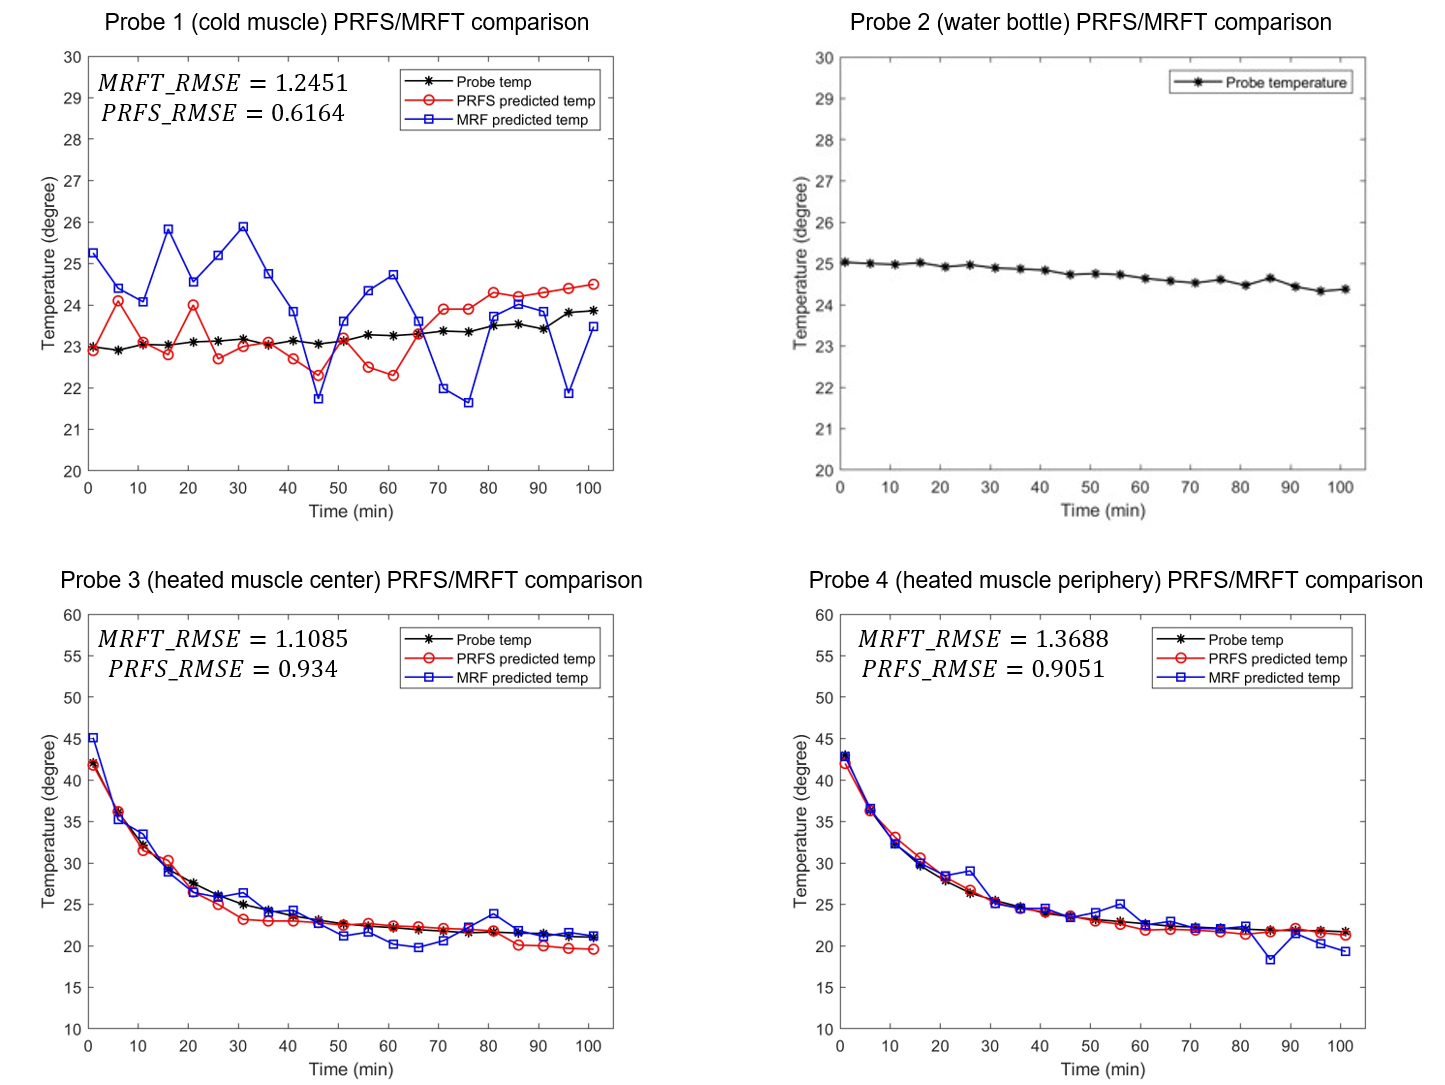
Figure 4: Figure 4 shows the comparison of PRFS thermometry predicted temperature, MRF thermometry predicted temperature, and fluoroptic probe measurements from the MRFT/PRFS comparison experiment. Regions of interest (ROI) are drawn based on the locations of the probes to calculate the Δs and T1 around the probes. Each ROI contains 60 voxels. No temperature prediction was performed for the reference water.
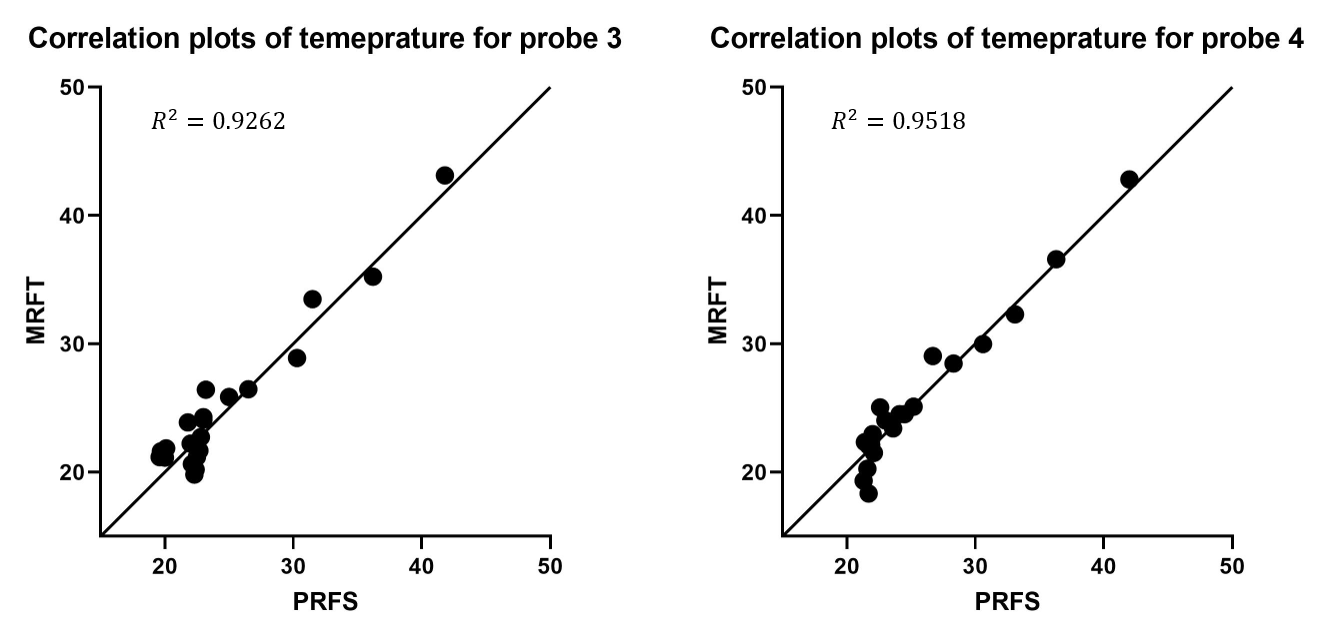
Figure 5: Figure 5 presents the correlation plots between PRFS thermometry and MRFT for probe 3 and probe 4. The R2 value is 0.9262 and 0.9518 for probe 3 and probe 4, respectively. No correlation was performed for probe 1 due to the small temperature range. No meaningful correlation was found for probe 1.
DOI: https://doi.org/10.58530/2023/4224