4223
Longitudinal quantitative imaging of skeletal muscles and peripheral nerves in CMT1A patients using Double-Echo in Steady-State at 7 Tesla1Radiology, Massachusetts General Hospital, Boston, MA, United States, 2Radiology, Harvard Medical School, Boston, MA, United States, 3Harvard-MIT Health Sciences and Technology,, Cambridge, MA, United States, 4Physics, Harvard University, Cambridge, MA, United States, 5Neurology, Massachusetts General Hospital, Boston, MA, United States
Synopsis
Keywords: Nerves, Quantitative Imaging
Charcot-Marie-Tooth (CMT) is a neuromuscular disease causing progressive loss of muscle mass and function as well as nerve damage. Quantitative MRI offers the ability to investigate the condition of nerves and skeletal muscle non-invasively. In this work, we report findings from measuring various quantitative neuromuscular metrics in four CMT1A patients in high-resolution images obtained at 7T, measured at two time points.Introduction
Charcot-Marie-Tooth (CMT) disease is an inherited neuromuscular condition that manifests in progressive nerve damage and loss of muscle mass and function. Disease progression is typically assessed by asking the patient to complete scored tasks, measuring nerve conduction or by taking biopsies, but such approaches are invasive or rely on subjective patient participation. Quantitative MRI can provide measurements of various biomarkers in tissue, such as T2, diffusivity, and fat fraction, in addition to macrostructural anatomical information. Such biomarkers could potentially complement more invasive or subjective monitoring methods, contributing to a more holistic assessment of CMT progression. In this work, we obtained high-resolution images, T2 maps, and fat fraction maps of peripheral nerves and skeletal muscle in four CMT1A patients at two timepoints, obtained with quantitative Double-Echo in Steady-State (DESS) at 7T. We assessed whether significant longitudinal differences in the quantitative measurements was observed, potentially indicating progression of the disease.Methods
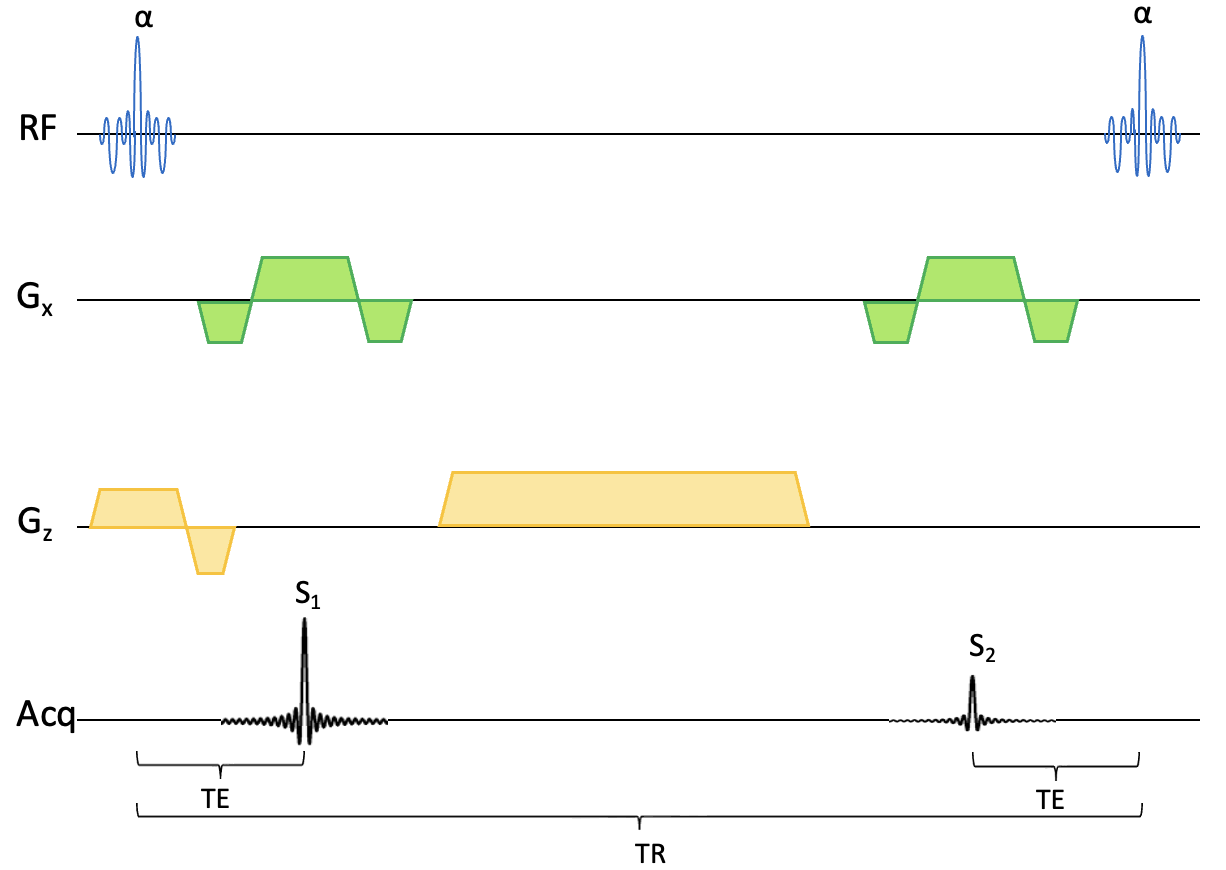
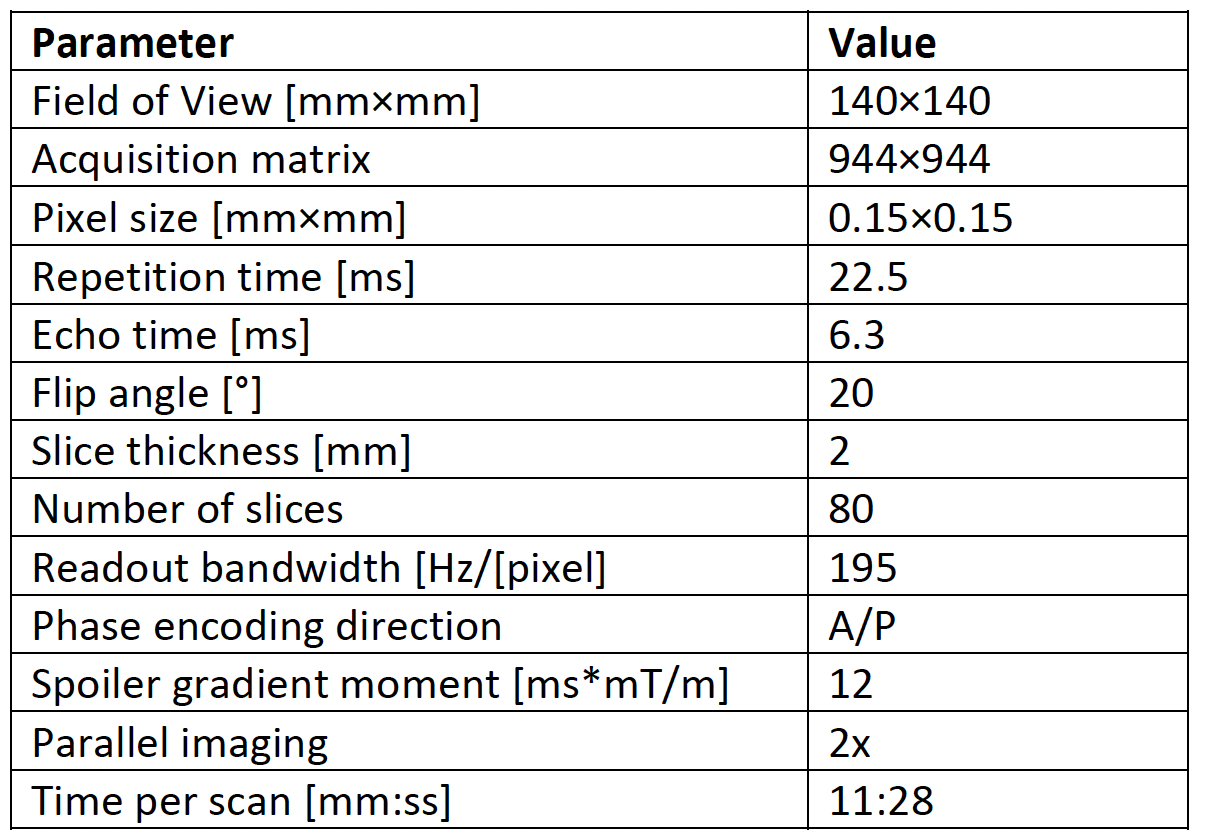
We acquired 3D DESS1-2 scans in the lower right thigh of four CMT1A patients in the axial plane. The pulse diagram is shown in Figure 1. The scans were performed on an ultra-high field 7T Terra scanner (Siemens Healthineers, USA) with at 28-channel transmit/receive knee coil. The scan parameters are shown in Figure 2. The T2 relaxation was estimated by comparing the signal amplitude of the first (FISP) signal before the DESS spoiler gradient and the second (PSIF) signal after the spoiler gradient. We ran the sequence both with water excitation and with fat excitation, and by comparing their amplitudes, we estimated the fat fraction (FF) in nerve and muscle tissue. Fat-water shift was corrected by shifting the fat image to match the water image. The DESS spoiler momentum was kept small enough to not induce any diffusion weighting. Two slices were examined: One at the bifurcation of the sciatic nerve into the tibial and fibular (peroneal) nerve (slice A), and the other 10 mm distally from the prior slice (slice B). Regions of interest (ROIs) were drawn in all distinguishable nerve fascicles in the sciatic nerve (in slice A) and the tibial and fibular nerves (in slice B) and their cross-sectional areas, T2, and FF were measured. In slice A, ROIs were similarly drawn in several skeletal muscles and the same parameters measured. The patients were scanned twice, with 6-20 months between scans, and parameters compared between the two time points. In one of the baseline scans, the FF was not measured. Significant differences were calculated with a two-sided t-test with α = 0.05.Results
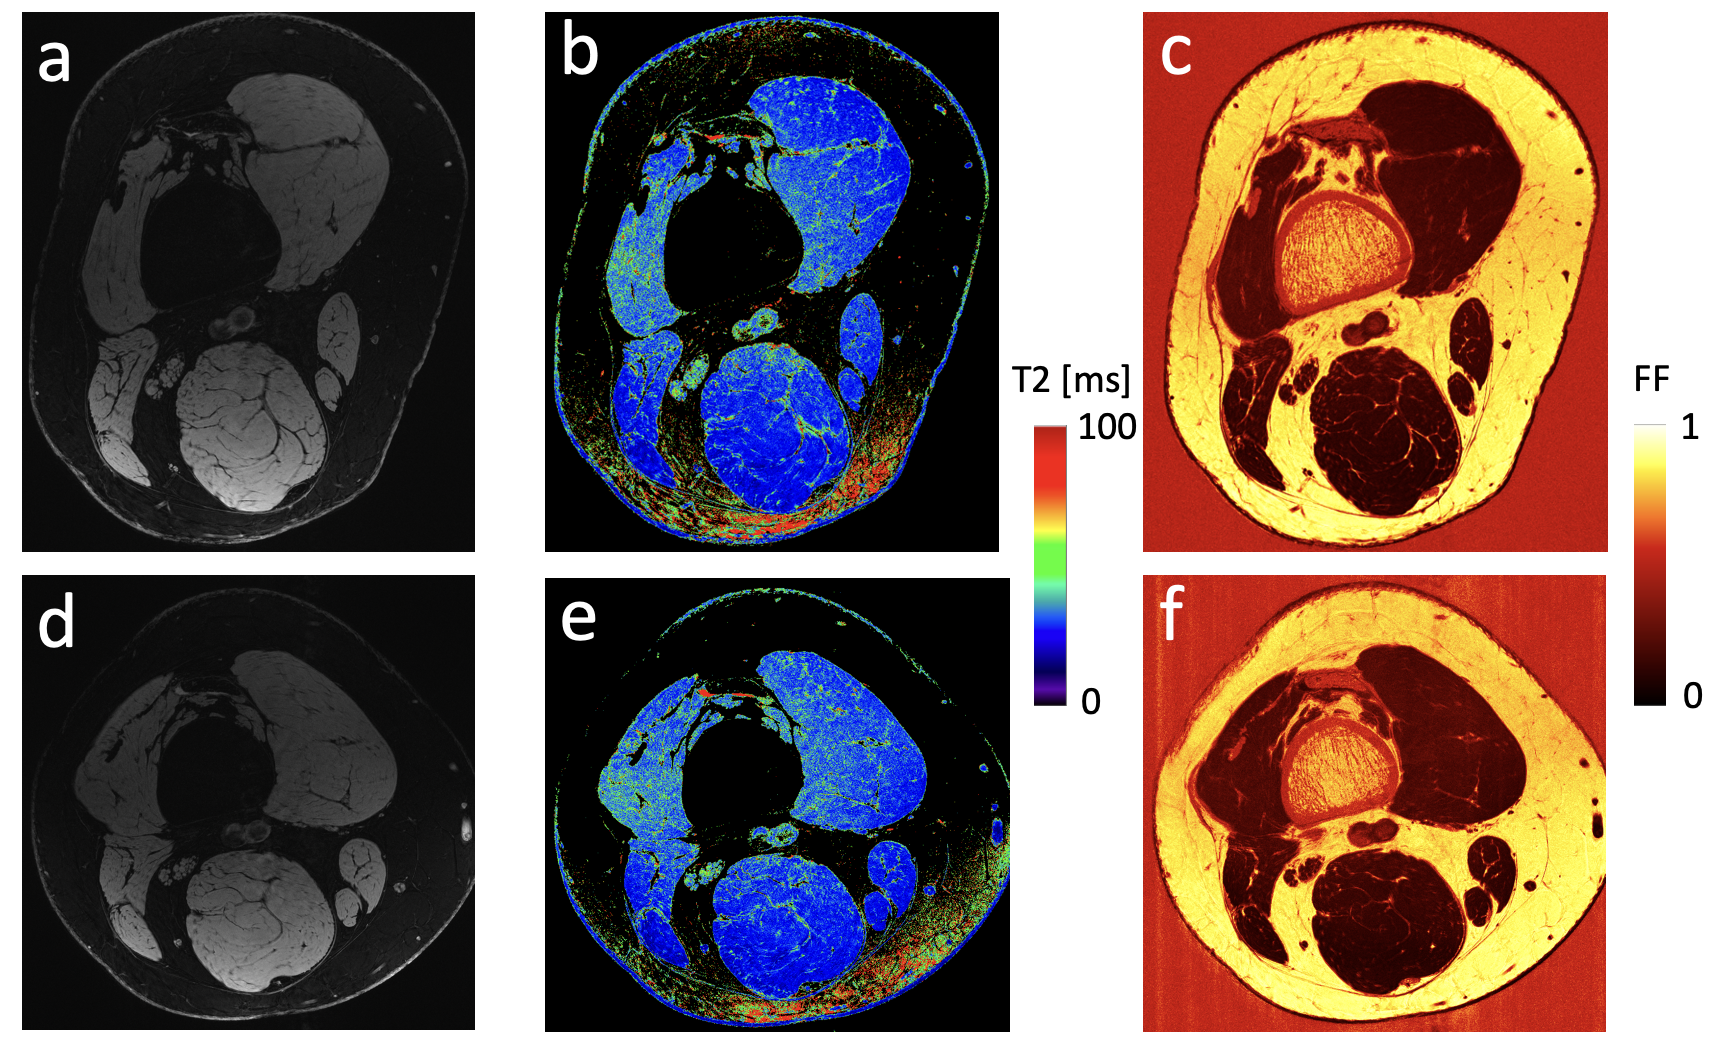
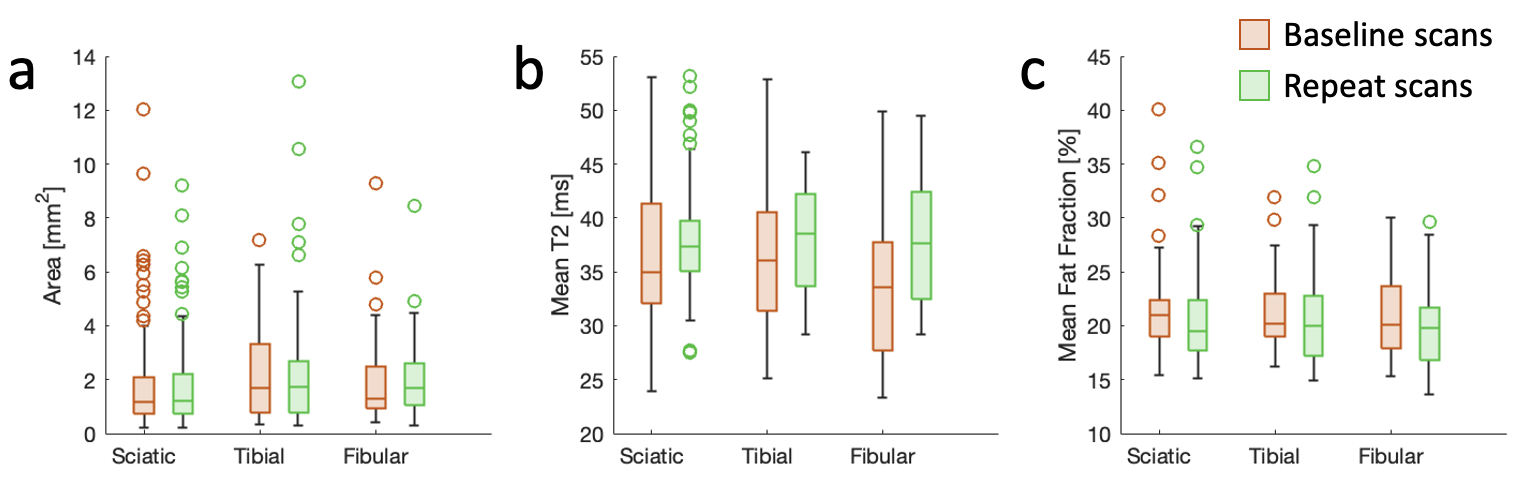
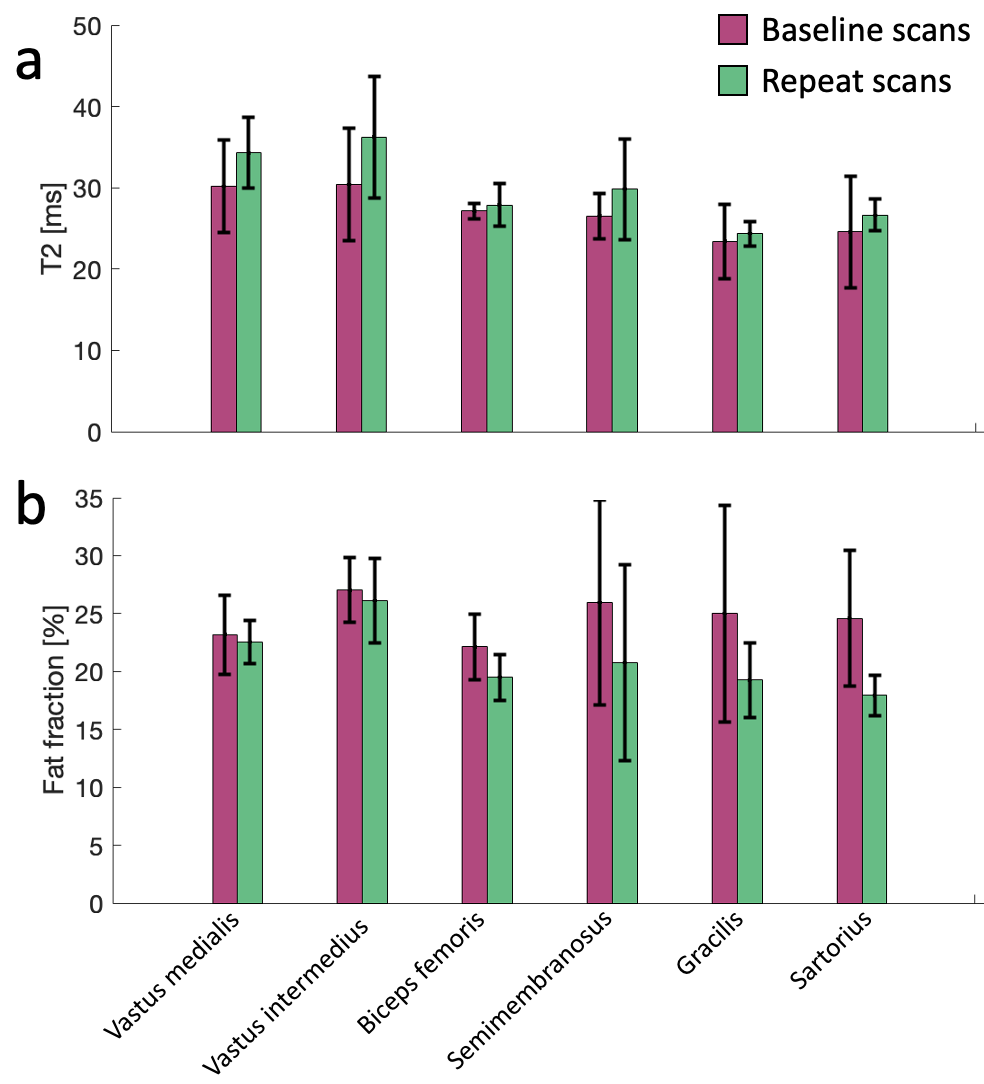
Sample images from a patient at baseline and at the repeat scan are shown in Figure 3, showing anatomy, T2, and fat fraction. The method was generally successful in capturing high-resolution images, but some shading and breakdown of fat/water separation at the edges was observed, as well as pulsation artifacts from the popliteal artery. Notably, the high resolution, enabled by the high magnetic field, the high-quality coil, and the SNR efficiency of the pulse sequence, enables straightforward delineation of individual fascicles within the peripheral nerve. Figure 4 shows aggregated fascicle distributions for the cross-sectional area, T2, and fat fraction in the sciatic, tibial, and fibular nerves in the form of a box plot. These measurements are shown for both the baseline scans and the repeat scans. Figure 5 shows results from T2 and FF measurements in 6 skeletal muscle groups in slice A. No significant differences were found between the two time points for any of the measured parameters.Discussion
While no significant differences were found for this small cohort in either the nerve data or the muscle data, observationally the T2 in the nerve fascicles and skeletal muscle had higher mean values in the repeat scans, while the FF in the skeletal muscle was lower in the repeat scans. Prior studies have found that nerve cross sectional area is larger in CMT1A patients3-5 and that this correlates with disease severity6. Another study found that T2 relaxation in the peripheral nerves did not correlate with disease7. Furthermore, muscle fat fraction has been found to correlate with disease severity and to increase over time in CMT1A patients8. Expanding the patient cohort to increase the statistical power of this study could elucidate whether any significant differences are observed between the DESS 7T biomarkers and existing literature. Future work could also involve gathering functional patient data, measuring physical function, along with the images to examine correlations with imaging biomarkers. Establishing correlations between physical function and such combined high-resolution biomarkers in nerves and skeletal muscle could provide a valuable tool for monitoring and developing treatment for CMT1A and other neuromuscular diseases.Conclusion
The DESS sequence can be used to obtain high-resolution anatomic and quantitative images of peripheral nerves at 7T, yielding measurements that can potentially complement existing methods for monitoring disease progression.Acknowledgements
Imaging was performed at the Athinoula A. Martinos Center for Biomedical Imaging at the Massachusetts General Hospital using resources provided by the Center for Functional Neuroimaging Technologies (P41EB015896) and the Center for Mesoscale Mapping (P41EB030006), Biotechnology Resource Grants supported by the National Institute of Biomedical Imaging and Bioengineering, National Institutes of Health (NIH). The NIH also provided support through grants K99AG066815, R01EB027779, R01EB028797, and S10OD023637. This research was also supported in part by the MGH/HST Athinoula A. Martinos Center for Biomedical Imaging. Siemens Healthineers provided technical support. We thank Peter Lally at Imperial College London and Daniel Park at Massachusetts General Hospital for pulse sequence assistance.References
1. Bruder H, Fischer H, Graumann R, Deimling M. A new steady-state imaging sequence for simultaneous acquisition of two MR images with clearly different contrasts. Magn Reson Med. 1988;7:35-42.
2. Redpath TW, Jones RA. FADE – A new fast imaging sequence. Magn Reson Med. 1988;6:224-234.
3. Goedee SH, Brekelmans GJ, van den Berg LH, Visser LH. Distinctive patterns of sonographic nerve enlargement in Charcot-Marie-Tooth type 1A and hereditary neuropathy with pressure palsies. Clin Neurophysiol. 2015;126:1413-1420.
4. Padua L, Coraci D, Lucchetta M, et al. Different nerve ultrasound patterns in Charcot-Marie-Tooth types and hereditary neuropathy with liability to pressure palsies. Muscle Nerve. 2018;57:E18-E23.
5. Sugimoto T, Ochi K, Hosomi N, et al. Ultrasonographic nerve enlargement of the median and ulnar nerves and the cervical nerve roots in patients with demyelinating Charcot-Marie-Tooth disease: distinction from patients with chronic inflammatory demyelinating polyneuropathy. J Neurol. 2013;260:2580-2587.
6. Zanette G, Tamburin S, Taioli F, Lauriola MF, Badari A, Ferrarini M, Cavallaro T, Fabrizi GM. Nerve size correlates with clinical severity in Charcot–Marie–Tooth disease 1A. Muscle Nerve. 2019;60(6):744-8.
7. Vaeggemose M, Vaeth S, Pham M, Ringgaard S, Jensen UB, Tankisi H, Ejskjaer N, Heiland S, Andersen H. Magnetic resonance neurography and diffusion tensor imaging of the peripheral nerves in patients with Charcot‐Marie‐Tooth Type 1A. Muscle Nerve. 2017;56(6):E78-84.
8. Morrow JM, Evans MR, Grider T, Sinclair CD, Thedens D, Shah S, Yousry TA, Hanna MG, Nopoulos P, Thornton JS, Shy ME. Validation of MRC Centre MRI calf muscle fat fraction protocol as an outcome measure in CMT1A. Neurology. 2018;91(12):e1125-9.
Figures