4221
Longitudinal evaluation of fasciculation in a healthy population using muscle DTI1Radiology, University Medical Centre Utrecht, Utrecht, Netherlands, 2Neurology, BG-University Hospital Bergmannsheil gGmbH, Bochum, Germany
Synopsis
Keywords: Muscle, Muscle
Spontaneous motor unit (MU) contractions (fasciculation) are a hallmark of motor neuron diseases and can be measured with motor unit MRI. Previous work used a dedicated sequence with one optimized b-value. Here, we demonstrated that muscle DTI with variable b-values can also detect fasciculation. This allows simultaneous assessment of muscle architecture and fasciculation. Furthermore, we presented a retrospective analysis of fasciculation in healthy cohort muscle DTI data. This reveals higher and more variable fasciculation in lower legs compared to upper legs, and stable fasciculation distribution in repeated measures. Fasciculation detection in patients should therefore preferably focus on the upper legs.Introduction
A MU comprises a lower motor neuron and skeletal muscle fibres it innervates.1,2 When a motor neuron fires, muscle fibres contract which can be detected as signal voids with a pulsed gradient spin-echo diffusion-weighted sequence, i.e. motor unit MRI (MUMRI).3,4 Spontaneous MU contractions (fasciculation) are a hallmark of motor neuron diseases5 and can be measured with MUMRI.4,6 Previous work used a dedicated MUMRI sequence with one optimized b-value. Here, we aim to use muscle DTI with variable b-values to detect fasciculation and compare this to MUMRI. Future work could then use DTI to simultaneously assess muscle architecture and fasciculation. Fasciculation is not disease-specific and is also observed in healthy people. Therefore our second aim is to retrospectively examine fasciculation distribution over time for lower and upper leg muscles using muscle DTI of a healthy cohort.7Materials and Methods
Data-acquisitionMUMRI vs. DTI: Upper legs of three healthy subjects were scanned with MUMRI and DTI using a 3T Philips MR scanner and multi-element anterior-posterior coils. Sequence settings were:
· MUMRI: SE-EPI, 45 images of b=200s/mm2 and three diffusion sensitisation directions, TR/TE=3950/42ms, slices=33, resolution=3x3x6mm, fat suppression.
· DTI: SE-EPI, 27 images with b=20(3x), 50(3x), 200(6x) and 500(15x) s/mm2, TR/TE=5994/50ms, slices=33, resolution=3x3x6mm, fat suppression.
DTI in cohort: Lower extremities of 28 healthy controls were scanned with a set-up as described above using DTI with settings: SE-EPI, 42 images with b=0(1x), 1(6x), 10(3x), 25(3x), 100(3x), 200(6x), 400(8x), 600(12x) s/mm2, TR/TE=5000/50ms, resolution=3x3x6mm, fat suppression.
We acquired one stack for the lower legs and two stacks for the upper legs. Seven subject were examined three times.
Data-processing
MUMRI vs. DTI: Images were processed with QMRITools.8 Images were denoised and registered with elastix.9 Muscle tissue was manually delineated. Fasciculation was detected by looking for transient signal voids in muscle tissue. Signal voids were defined as groups of connected voxels (minimum size=4voxels), where the signal intensity dropped more than a certain number of standard deviations from the mean signal over the voxel’s times-series, using an iterative approach. This requires a constant signal intensity over time, which DTI does not have with its altering b-values. Therefore, each image was normalized to its average signal in segmented muscle tissue (Fig.1A/B).
After detection, we calculated for each dataset the fasciculation detection chance and median fasciculation size.
$$\frac{Number\ of\ fasciculations}{Number\ of\ analysed\ images}\times100\%$$ The SD threshold will influence fasciculation detection chance and size, therefore we examined different thresholds (1SD to 7SD, step=0.5SD).
DTI in cohort: Fasciculations were detected using the optimized SD threshold in eight upper and seven lower leg muscles (manually segmented). Fasciculation measures were calculated using the whole-compartment mask and for each muscle mask separately.
Results
MUMRI vs. DTIVideos of MUMRI and DTI datasets and the time-profile of a single voxel pre-normalisation and post-normalisation are displayed in Fig.1A/B. Post-normalisation both MUMRI and DTI signals are stable over time. However, the DTI signal shows slightly higher variability. Both methods allow the detection of fasciculation in the upper leg (Fig.1C).
Both methods show a similar dependency on the chosen threshold, i.e. fasciculation detection chance decreases with higher SD thresholds, and fasciculation size first decreases and later increases (Fig.2). DTI overestimated fasciculation detection chance for low SD thresholds, and underestimates it for high SD thresholds. For 3SD and 3.5SD, fasciculation detection chance and size are comparable between methods, wherefore threshold=3.5SD is chosen for further analysis.
DTI in cohort
Fig.3 shows examples of fasciculation maps. Fasciculation detection chance is larger and more variable in the lower legs compared to upper legs (11.9±14.8% vs. 3.7±3.8%, p=0.001) with the largest detection chances observed in the lower leg’s posterior compartment(Fig4.A/B). In the upper legs, fasciculation detection chance is the largest in the semimembranosus.
The median fasciculation size was also larger in lower legs compared to the upper legs (0.38±0.10cm3 vs. 0.48±0.16cm3,p=0.003)(Fig.4C). This difference was not observed within individual muscles, because large fasciculations, covering multiple muscles, are divided into smaller signal voids within individual muscles (Fig.4C).
The distribution of fasciculation detection chance in our cohort is stable over time (Fig.5), i.e. the probability density curve is very similar for the three visits within 1 year.
Discussion and conclusion
Muscle DTI detects fasciculation comparable to dedicated MUMRI. It is, however, important to realize that DTI has higher b-values, making DTI on one hand more sensitive to fasciculation. On the other hand, though, these high b-value images have lower SNR, wherefore DTI is more likely to miss fasciculation when using stringent thresholds. Reported fasciculation rates for MUMRI and DTI highly depend on the detection threshold, making absolute comparisons between studies using different acquisitions difficult.Our retrospective analysis presents the fasciculation distribution over the whole lower extremity in healthy people, revealing higher fasciculation detection chances in lower legs compared to upper legs. This difference is driven by the lower leg’s posterior compartment, in line with a MUMRI study in lower leg muscles only.10 The fasciculation distribution remained stable over time in our cohort. Therefore, we can conclude that DTI can be used to detect fasciculation and that for diagnostic purposes one should preferably focus on upper legs instead of lower legs since in healthy people the fasciculation rate in those muscles is lowest and the least variable.
Acknowledgements
We like to thank all participants for their participation and Marlena Rohm for segmenting the muscles of the healthy cohort.References
1. Buchthal F, Schmalbruch H. Motor unit of mammalian muscle. Physiol Rev 1980;60(1):90–142.
2. Heckman CJ, Enoka RM. Motor Unit. Compr Physiol 2012;2(4):2629–2682.
3. Steidle G, Schick F. Addressing spontaneous signal voids in repetitive single-shot DWI of musculature: Spatial and temporal patterns in the calves of healthy volunteers and consideration of unintended muscle activities as underlying mechanism. NMR Biomed 2015;28(7):801–810.
4.Whittaker RG, Porcari P, Braz L, et al. Functional magnetic resonance imaging of human motor unit fasciculation in amyotrophic lateral sclerosis. Ann Neurol 2019;85(3):455–459.
5.Shefner JM, Al-Chalabi A, Baker MR, et al. A proposal for new diagnostic criteria for ALS. Clinical Neurophysiology 2020;131(8):1975–1978.
6. Heskamp L, Birkbeck M, Hall J, et al. Whole-body fasciculation detection in Amyotrophic Lateral Sclerosis (ALS) using motor unit MRI (MUMRI). Proceedings ISMRM 2022;
7. Forsting J, Rohm M, Froeling M, et al. Quantitative muscle MRI captures early muscle degeneration in calpainopathy. Accepted in Scientific Reports 2022;
8. Froeling M. QMRTools: a Mathematica toolbox for quantitative MRI analysis. J Open Source Softw 2019;4(38):1204.
9. Klein S, Staring M, Murphy K, et al. elastix: A Toolbox for Intensity-Based Medical Image Registration. IEEE Trans Med Imaging 2010;29(1):196–205.
10. Birkbeck M, Heskamp L, Hall J, et al. Spontaneous motor unit activity in a healthy ageing population measured using motor unit MRI (MUMRI). Proceedings ISMRM 2022;
Figures
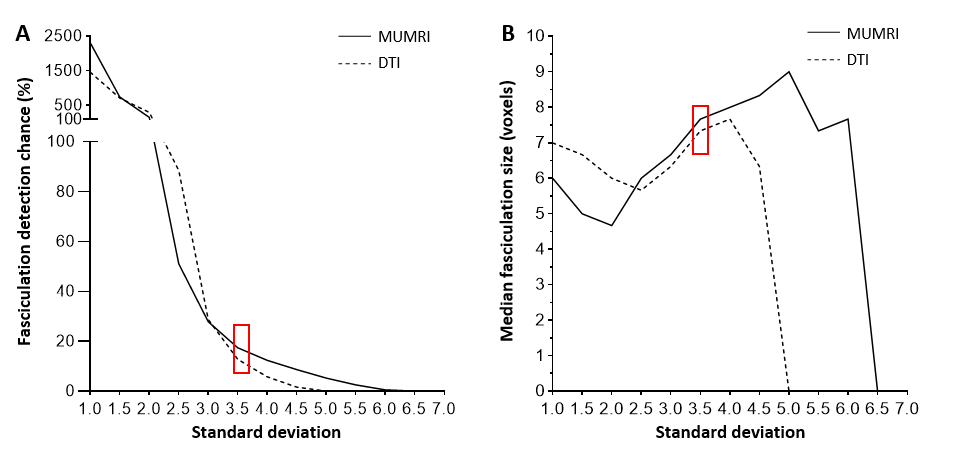
Figure 2: Fasciculation detection chance and median fasciculation size estimated with MUMRI (solid) and DTI (dashed) vs. detection threshold. A) Fasciculation detection chance. B) Median fasciculation size. For both figures, the average of three datasets is displayed. We have chosen the threshold 3.5SD (red rectangular) for further analysis, because at 3.5SD DTI does not overestimate fasciculation rates compared to MUMRI, and the median fasciculation sizes are comparable between both sequences.
Figure 3: Typical examples of fasciculation maps in the upper and lower leg for several healthy controls. A) Video of the normalized DTI data (top) and the corresponding fasciculation map (bottom) for the upper leg and lower leg musles. B) Fasciculation maps of three other healthy participants. These fasciculation maps show that the distribution of fasciculation is variable between subjects, but that in all four subjects fasciculation is most prone in the posterior compartment of the lower legs.
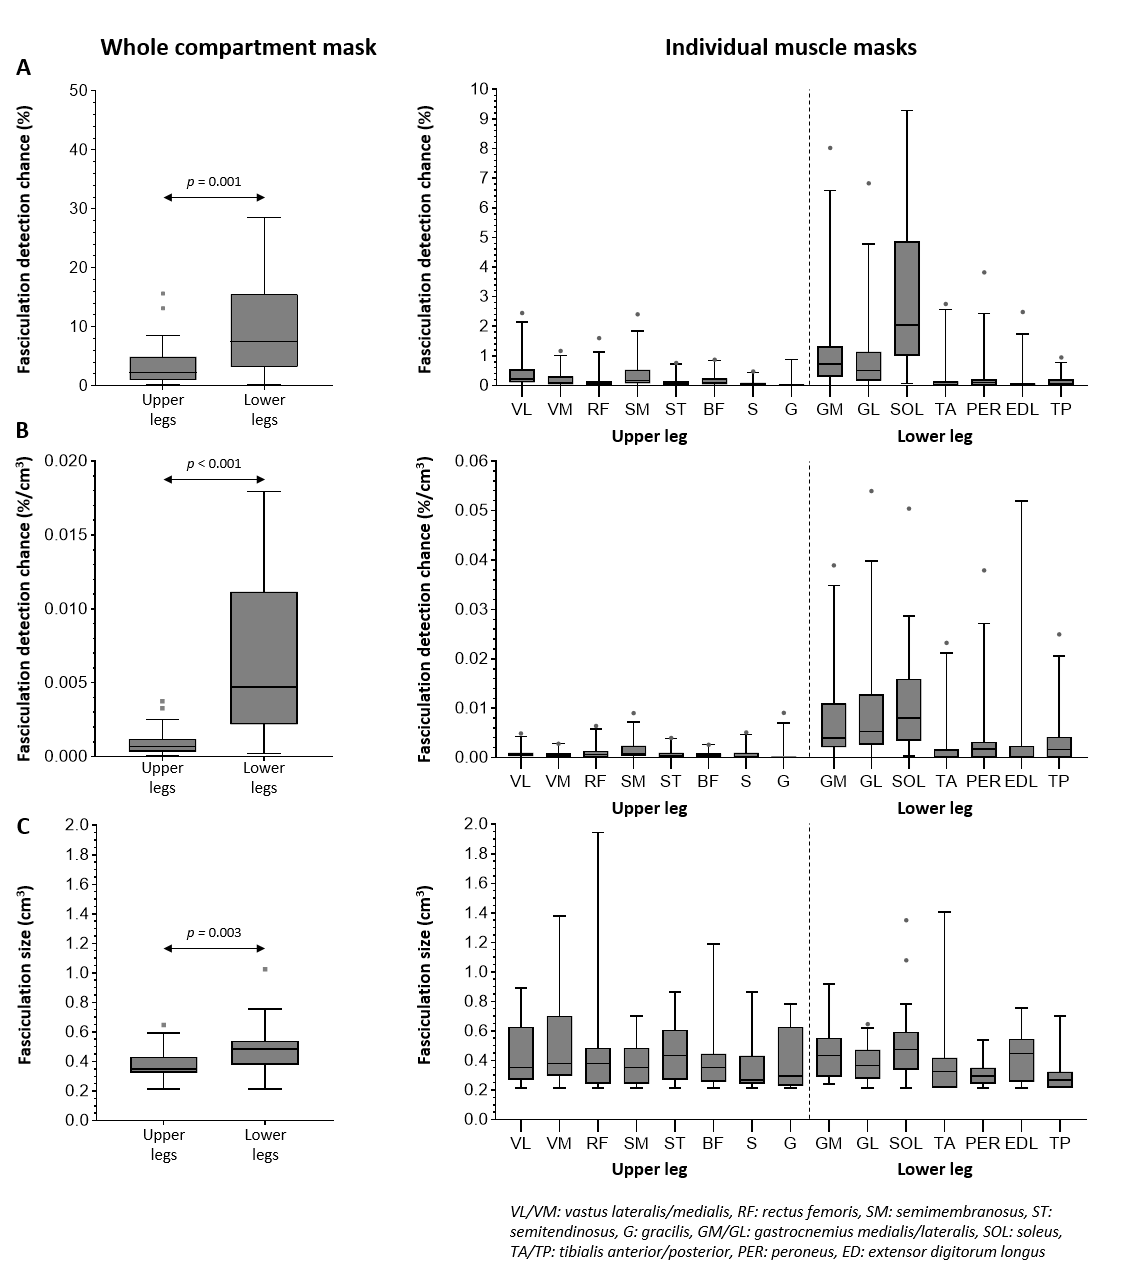
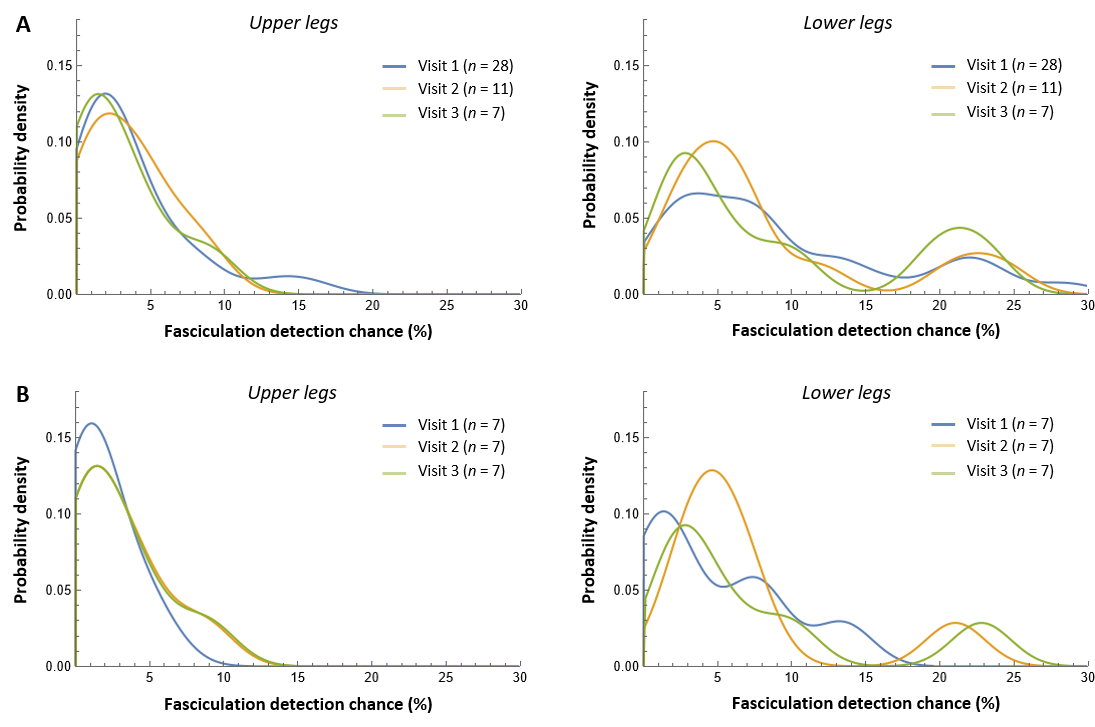
Figure 5: Probability distribution of the fasciculation detection chance over the three visits within 1 year. A) Probability distribution of the fasciculation detection chance over visit 1 (blue), visit 2 (yellow), and visit 3 (green), including all available datasets and therefore a different number of subjects (n) per visit. B) Probability distribution of the fasciculation detection chance over the three visits for only the seven subjects that were scanned at all three visits.