4218
Quantitative MRI of the upper arm in Duchenne muscular dystrophy: Consistent slice positioning is crucial due to fat-fraction variability1Neurology, Leiden University Medical Center, Leiden, Netherlands, 2C J Gorter MRI Center, Leiden University Medical Center, Leiden, Netherlands, 3Rehabilitation, Amsterdam University Medical Center, Amsterdam, Netherlands
Synopsis
Keywords: Muscle, Fat, Neuromuscular
Skeletal muscle fat fraction determined using quantitative MRI is a promising outcome measure in Duchenne muscular dystrophy (DMD). However, fat fraction varies along the length of muscles in the lower limb, hampering consistency of longitudinal assessments. Our results show that fat fraction also varies over muscles in the upper limb. This variability is reduced when assessments are standardized at 40% of the humerus length. This is important for reproducibly measuring the fat fraction in the muscles of the upper limb in DMD in clinical trials and follow-up.Introduction
Duchenne Muscular Dystrophy (DMD) is an X-linked neuromuscular disease where muscles are progressively replaced by fat and fibrotic tissue, resulting in muscle weakness and wheelchair dependency around the age of 12. Patients have a reduced life expectancy of around 20-30 years.1,2 Skeletal muscle fat fraction (mFF) determined using quantitative MRI is a promising prognostic biomarker and surrogate outcome measure in clinical trials in patients with DMD.3,4,5,6 Most studies have focused on the lower limbs, where it has been shown that mFF varies along the length of the muscles.6,7 The function of the upper limbs is considered important in daily activities (wheelchair operation, drinking/eating, etc). Trials assessing limb function can only be performed in non-ambulant patients with suitable outcome measures for the upper limb. It is unknown if mFF also varies along the length of the muscles in the upper limb. If so, extra care needs to be taken to reproducibly assess mFF over time. In this study, we aim to identify whether there is variation in mFF along the length of the muscles of the upper limb and if there is a relatively stable region in the muscle to facilitate reproducible assessments. We compared different slices over the length of the muscle to the corresponding center slice of that muscle at 40% humerus length.Method
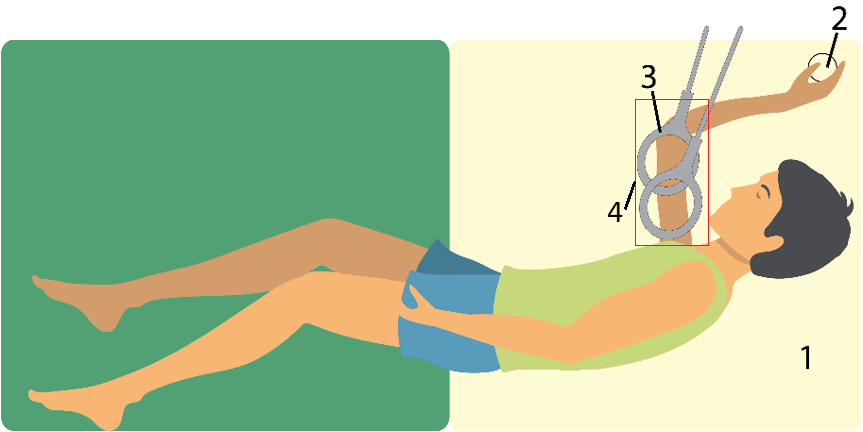
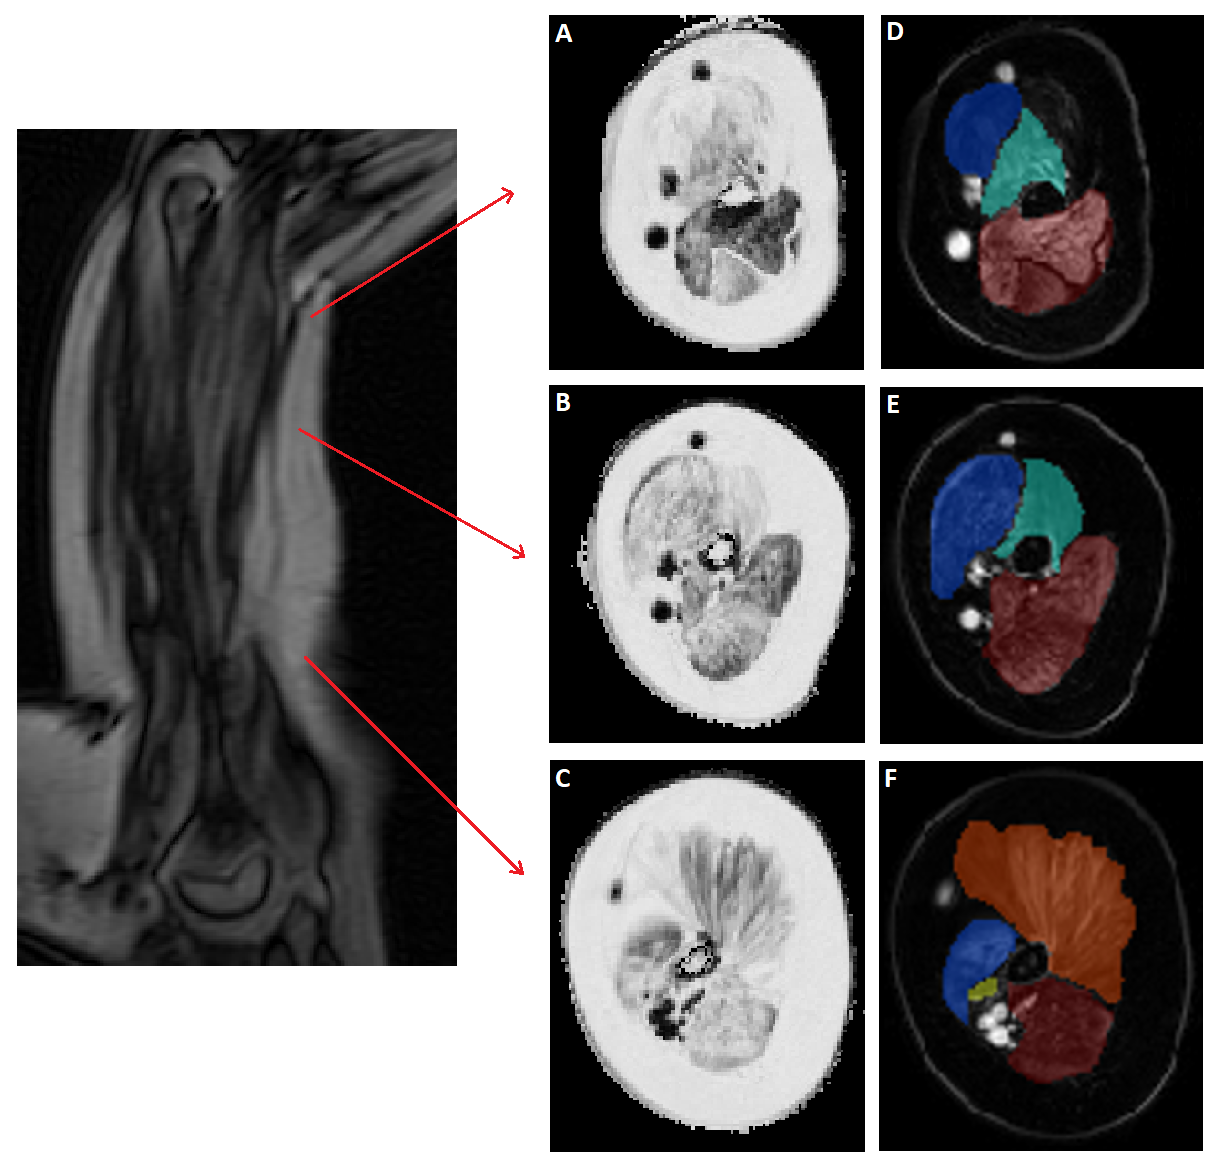
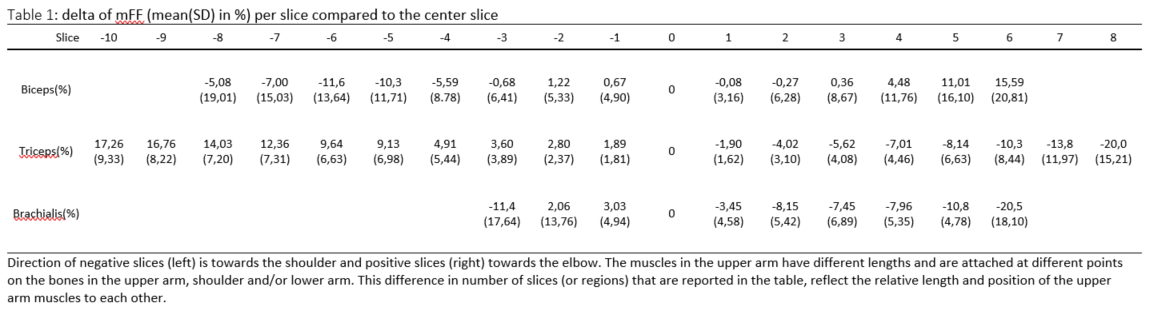
A total of 20 non-ambulant DMD patients were included. Patients were positioned on their right side with the right shoulder and elbow in 90o flexion because this was the most comfortable position while keeping the upper arm as close to the center of the bore as possible. A handgrip was fixed on an arm positioner and was gripped for correct and consistent positioning during longitudinal assessment (Fig 1). Axial four-point chemical-shift-based fat-water separation (Dixon) gradient echo scans were acquired at 3T (Ingenia, Philips Healthcare, Best, The Netherlands) with 2 circular 15cm flex coils for reception (33 slices, voxel size=1x1x10 mm, multi-acquisition, TE/TR/FA/ΔTE:2.4ms/310ms/20°/0.76ms). Data were fitted using an in-house developed water-fat separation Matlab script (2016a) with a 6-peak lipid model. B0 maps were calculated from the phase data of the first and last echoes and used to initialize the Dixon fit. Regions of interest (ROIs) were drawn on the borders of the biceps, brachialis and triceps muscles using MIPAV. ROIs were eroded, 2 voxels from the border, to exclude subcutaneous fat and fascia. The center slice (slice 0) was located at 40% distance from the elbow, based on the length of the humerus bone, and was used as reference to determine the difference (mean and SD) in mFF per slice. A low variability was defined as having a mean difference compared to the center slice of less than half the annual increase of 5%.Results
The mean (SD) difference between the center slice and one slice proximal (10mm toward shoulder) was 0.67% (4.90), 1.89% (1.81) and 3.03% (4.94) for the biceps, triceps and brachialis muscles, respectively (Table 1). Towards the elbow, differences became as large as 15.59% (20.81), 20.0% (15.21) and 20.5% (18.1). In the biceps muscle overall, the mFF increased towards the distal side of the muscle towards the elbow. An opposite trend was apparent for the triceps and brachialis muscles, in which the mFF increased towards the proximal side of the muscle towards the shoulder.Discussion
Our results show that the mFF was variable along the length of a muscle within a single muscle in the upper arm, where moving 1 slice from the center slice to either side in the upper arm resulted in a mFF difference from 0.1 up to 3.5%. with a maximum of 27.19% for the biceps, 37.26% for the triceps and 23.53% for the brachialis muscle compared to the center slice. These differences are in the same order of magnitude as was shown previously in the lower limb, although for some muscles even larger differences were reported.5 In the forearm, differences of around 5.6% for entire muscle compartment have been reported in DMD.10 As the annual increase in mFF is expected to be around ~5-6% 6,9 this would result in unacceptable loss of accuracy when in comparing data over time. The variability was lower around the center slice, especially for the biceps in which the center slice +3 and -3 slices showed a variability of less than 2%, making this a suitable region for longitudinal assessments. The distribution of mFF differed per muscle in the upper arm, but appeared to have a linear distribution in our population, with differences in direction between the biceps and triceps and the brachialis muscle. mFF also varies over the proximodistal axis in the limbs other neuromuscular disorders, where both directionality of the changes and shape of the FF curve over the proximodistal axis can vary.11,12Conclusion
We showed a variation of mFF in the upper arm muscles of DMD patients along the length of the muscle up to 27% over 15 cm for the biceps muscle. To use MRI-measured mFF in the clinical setting as prognostic tool or for evaluating experimental treatments, the same region of the muscle should be measured. For the biceps muscle, the region at 40% humerus length is most suitable for this aim.Acknowledgements
No acknowledgement found.References
1. Emery AE. The muscular dystrophies. Lancet. 2002 Feb 23;359(9307):687-95.
2. Hoffman EP, Brown Jr RH, Kunkel LM. Dystrophin: the protein product of the Duchenne muscular dystrophy locus. Cell 1987;51:919–28.
3. Gaeta M, Scribano E, Mileto A, et al. Muscle Fat Fraction in Neuromuscular Disorders: Dual-Echo Dual-Flip-Angle Spoiled Gradient-Recalled MR Imaging Technique for Quantification - A Feasibility Study. Radiology 2011;259(2):487–494.
4. Wokke BH, van den Bergen JC, Kan HE, et al. Quantitative MRI and strength measurements in the assessment of muscle quality in Duchenne muscular dystrophy. Neuromuscular Disorders 2014;24:409–416.
5. Wokke BH, Bos C, Kan HE, et al. Comparison of Dixon and T1-Weighted MR Methods to Assess the Degree of Fat Infiltration in Duchenne Muscular Dystrophy Patients. J of Magnetic Resonance Imaging 2013;38:619-624.
6. Fischmann A, Hafner P, Fischer D, et al. Quantitative MRI and loss of free ambulation in Duchenne muscular dystrophy. J Neurol 2013;260:969-974.
7. Hooijmans MT, Niks EH, Kan HE, et al. Non-uniform muscle fat replacement along the proximodistal axis in Duchenne muscular dystrophy. Neuromuscular Disorders 2017;27:458–464.
8. Chrzanowski S, Baligand C, Vandenborne K, et al. Multi-slice MRI reveals heterogeneity in disease distribution along the length of muscle in Duchenne muscular dystrophy. Acta Myologica 2017;36:151-162.
9. Naarding KJ, Kan HE, Niks EH, et al. Neurology 2021;97:1737–1742. Association of Elbow Flexor MRI Fat Fraction With Loss of Hand-to-Mouth Movement in Patients With Duchenne Muscular Dystrophy.
10. Ricotti V, Evans MRB, Thornton JS, et al. Upper Limb Evaluation in Duchenne Muscular Dystrophy: Fat-Water Quantification by MRI, Muscle Force and Function Define Endpoints for Clinical Trials: PLoS One 2016 Sep 20;11
11. Van de Velde NM, Hooijmans MT, Niks EH, et al. Selection Aprproach to Identify the Optimal Biomarker Using Quantitative Muscle MRI and Functional Assessment in Becker Muscular Dystrophy; Neurology 2021;97:513-522
12. Janssen BH, Voet NBM, Heerschap A, et al. Distinct Disease Phases in Muscles of Facioscapulohumeral Dystrophy Patients Identified by MR Detected Fat Infiltration. PLoS One 2014;9:1
Figures