4216
Monitoring of T2 changes in skeletal muscles using multiple overlapping-echo detachment imaging1Xiamen University, Xiamen, China, 2Zhejiang University, Hangzhou, China, 3University of Rochester, Rochester, NY, United States
Synopsis
Keywords: Muscle, Muscle, multiple overlapping-echo detachment imaging
Quantitative magnetic resonance imaging (qMRI), a noninvasive imaging tool without ionizing radiation, provides quantitative physiological information, whilst its lengthy scan time hinders its application in dynamic or real-time scenarios. Herein, the MOLED, a single-shot qMRI method we proposed previously, was applied in an ischemia and post-occlusive reactive hyperemia experiment to measure the T2 variation of the musculoskeletal system. The results disclose regular T2 fluctuations of different muscles during different periods. Inter-day repeatability experiments demonstrate that our method is accuracy and reliable.Introduction
Quantitative magnetic resonance imaging (qMRI), independent of specific choices of sequence parameters or hardware setups, supplements quantitative parametric maps with robustness, reliability, and great contrasts.1 Multiple overlapping-echo detachment (MOLED) imaging implements synchronous T2, proton density (M0), and B1 mapping in a single-shot acquisition with the help of a trained convolutional neural network (CNN).2,3 MOLED with short echo time (TE) is suited for the musculoskeletal system due to higher signal-to-noise ratio.4 Herein, an ischemia and post-occlusive reactive hyperemia experiment was performed, revealing that MOLED-short can capture delicate T2 variations of different muscles. Inter-day repeatability measurements demonstrate that the method is accurate and repeatable.Methods
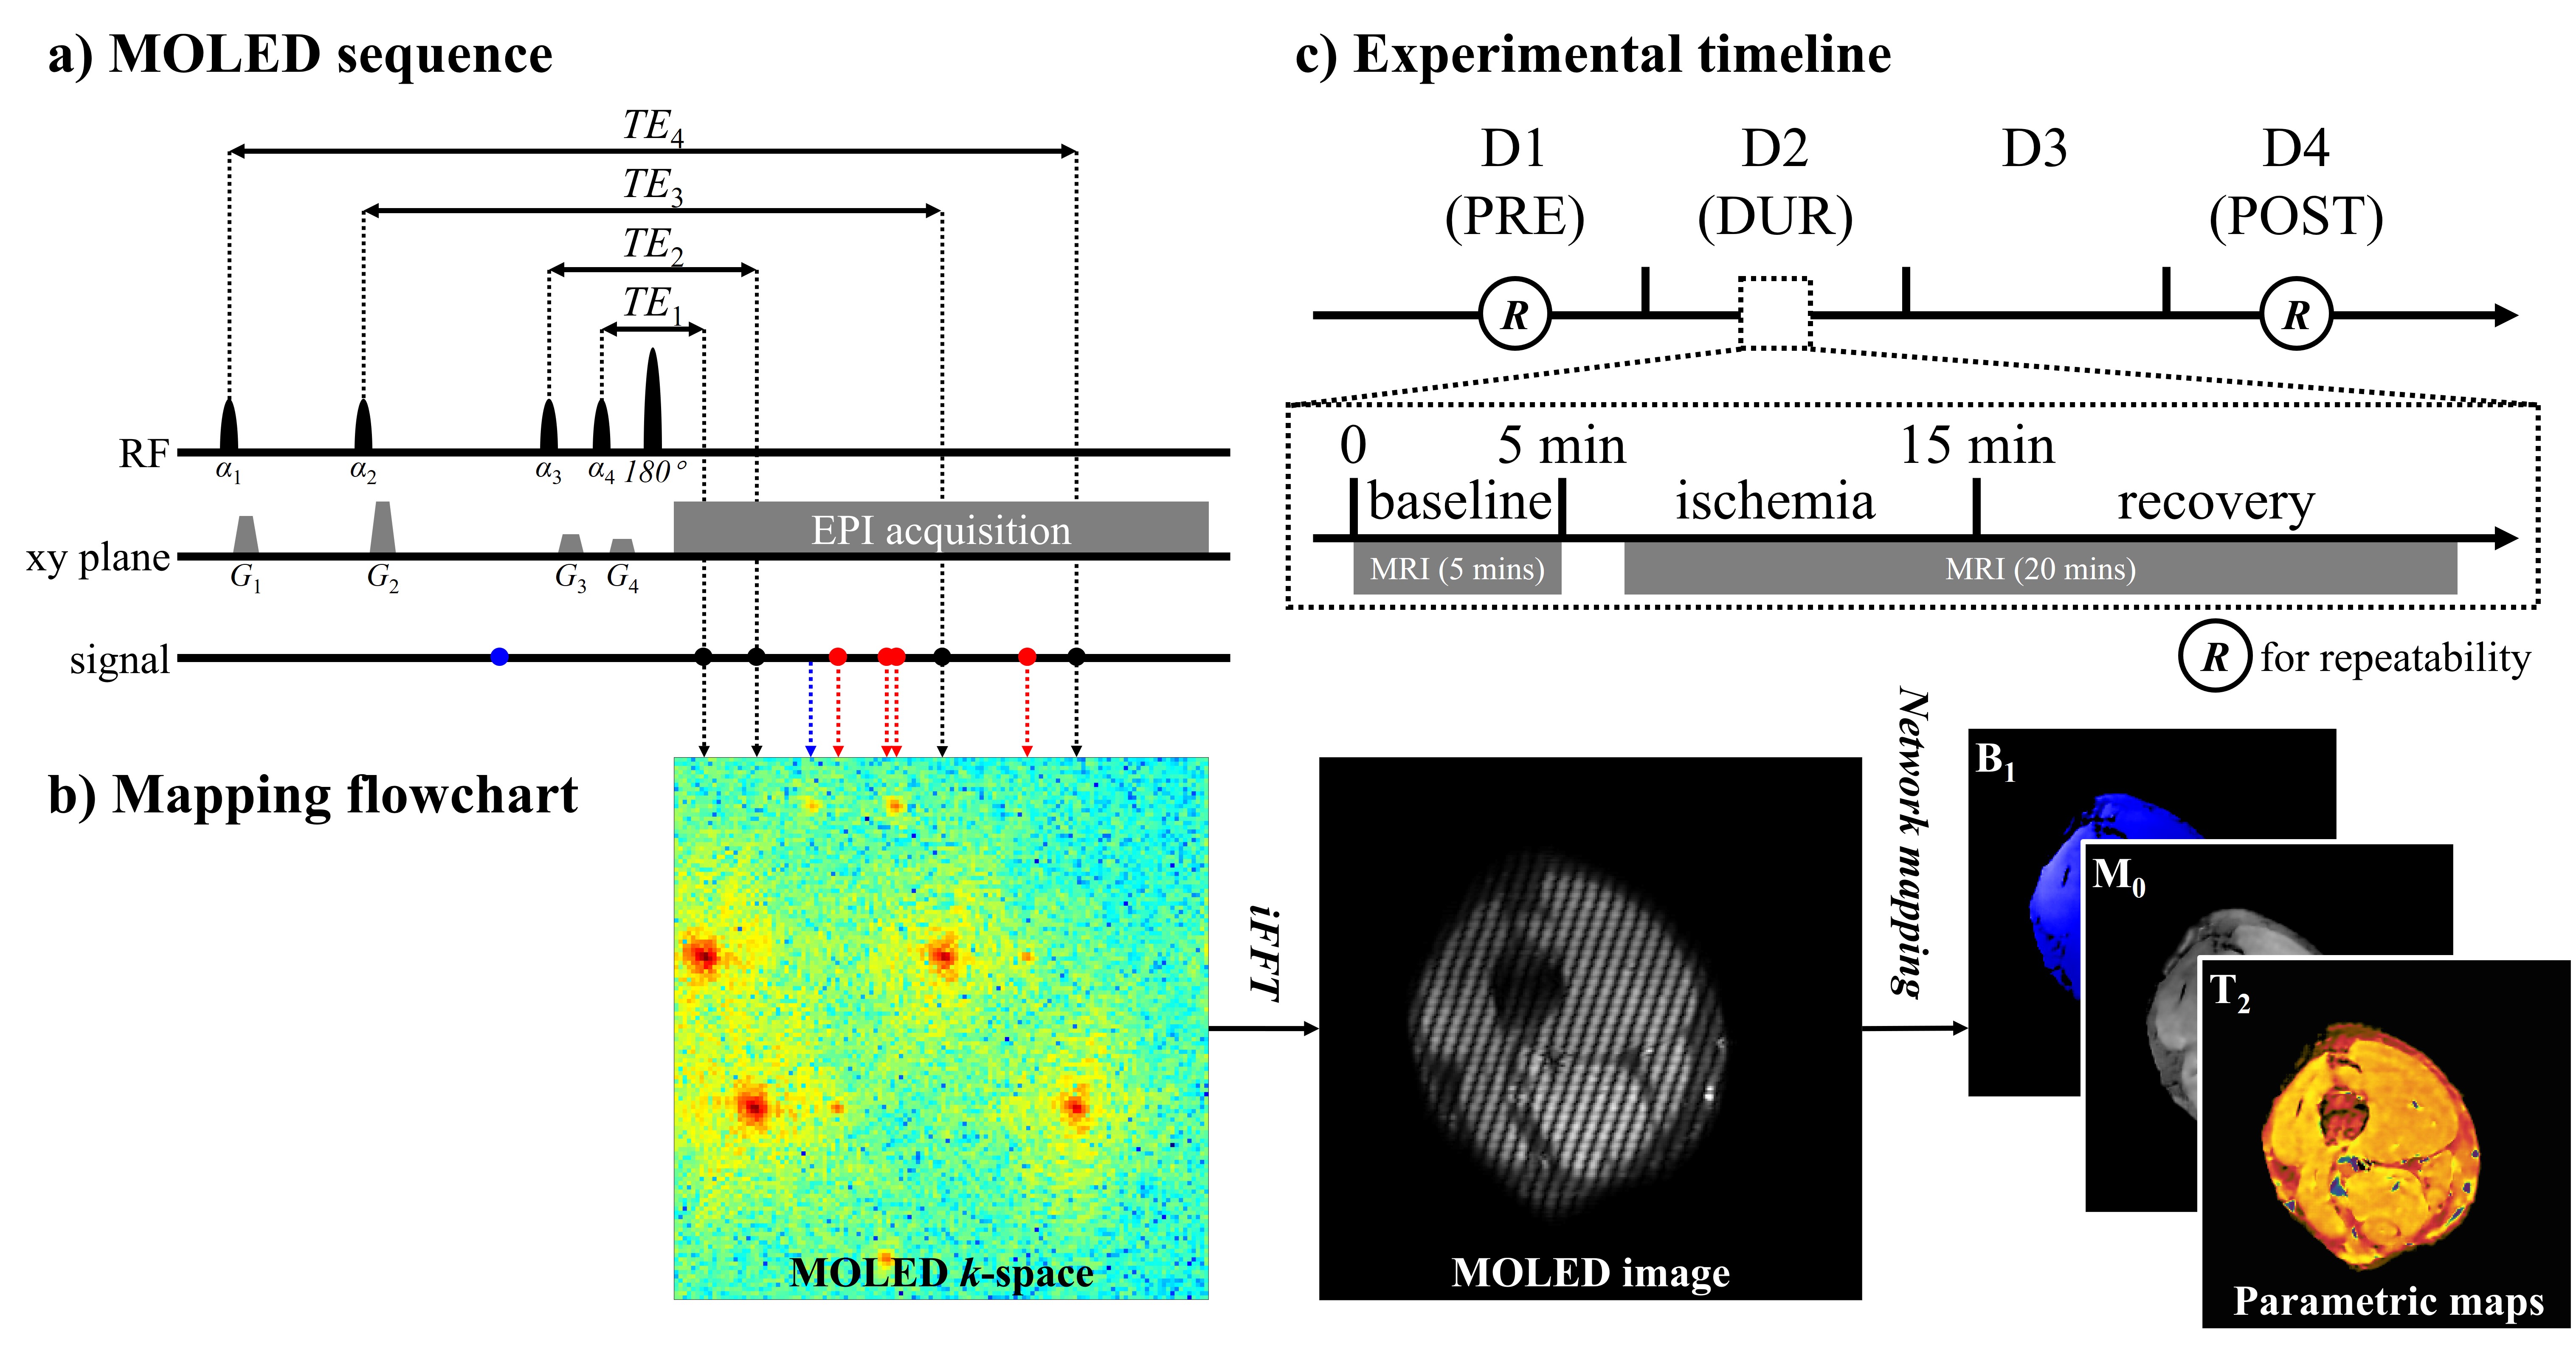
The method workflow and experimental timeline are illustrated in Figure 1. Multiple echoes with different evolution pathways are acquired in a single-shot and overlapped in a k-space. Quantitative maps are obtained through a trained CNN which learns the nonlinear relationship between MOLED images and quantitative maps through synthesized data.3 After a 5-minute baseline scan, a slip knot was manually tied with a rubber tourniquet on the lower third of the thigh, and then a 20-minute scan was performed. Volunteers untied the knot inside the scanner after 10-minute ischemia under the speech instruction of a timekeeper. The time series of measurements was represented as PRE, DUR, and POST, which were one day before, immediately before (within the day), and two days after the ischemia experiment. Measurements on static tissues were performed on PRE, DUR, and POST to track the inter-day variation of tissue T2. Repeatability measurements were performed on PRE and POST, as indicated by circled R in Figure 1c. Three healthy volunteers were recruited (body mass index (kg/m2)/age (years): 23.50/27, 20.78/27, and 18.15/24). Each was positioned feet-first in a supine position with the left calf centered in the magnet. A 3T whole-body MRI system equipped with a 16-channel knee coil (MAGNETOM Prisma, Siemens Healthcare, Erlangen, Germany) was used for data acquisition. Sequence parameters were: field of view = 20 cm×20 cm; slice thickness = 7 mm; TR = 5.0 s; TE = 14, 25, 65, and 94 ms; sampling matrix size = 128×128; acquisition bandwidth = 1302 Hz/pixel; GRAPPA factor = 2; scan time (per slice) = 110 ms. In repeatability measurements, a single-echo spin-echo (SESE) sequence with different TEs (8, 15, 30, and 60 ms) was performed to obtain reference T2 maps, and a turbo SE (TSE) sequence with a sampling matrix size of 256×256 was also performed for detailed structure.Results
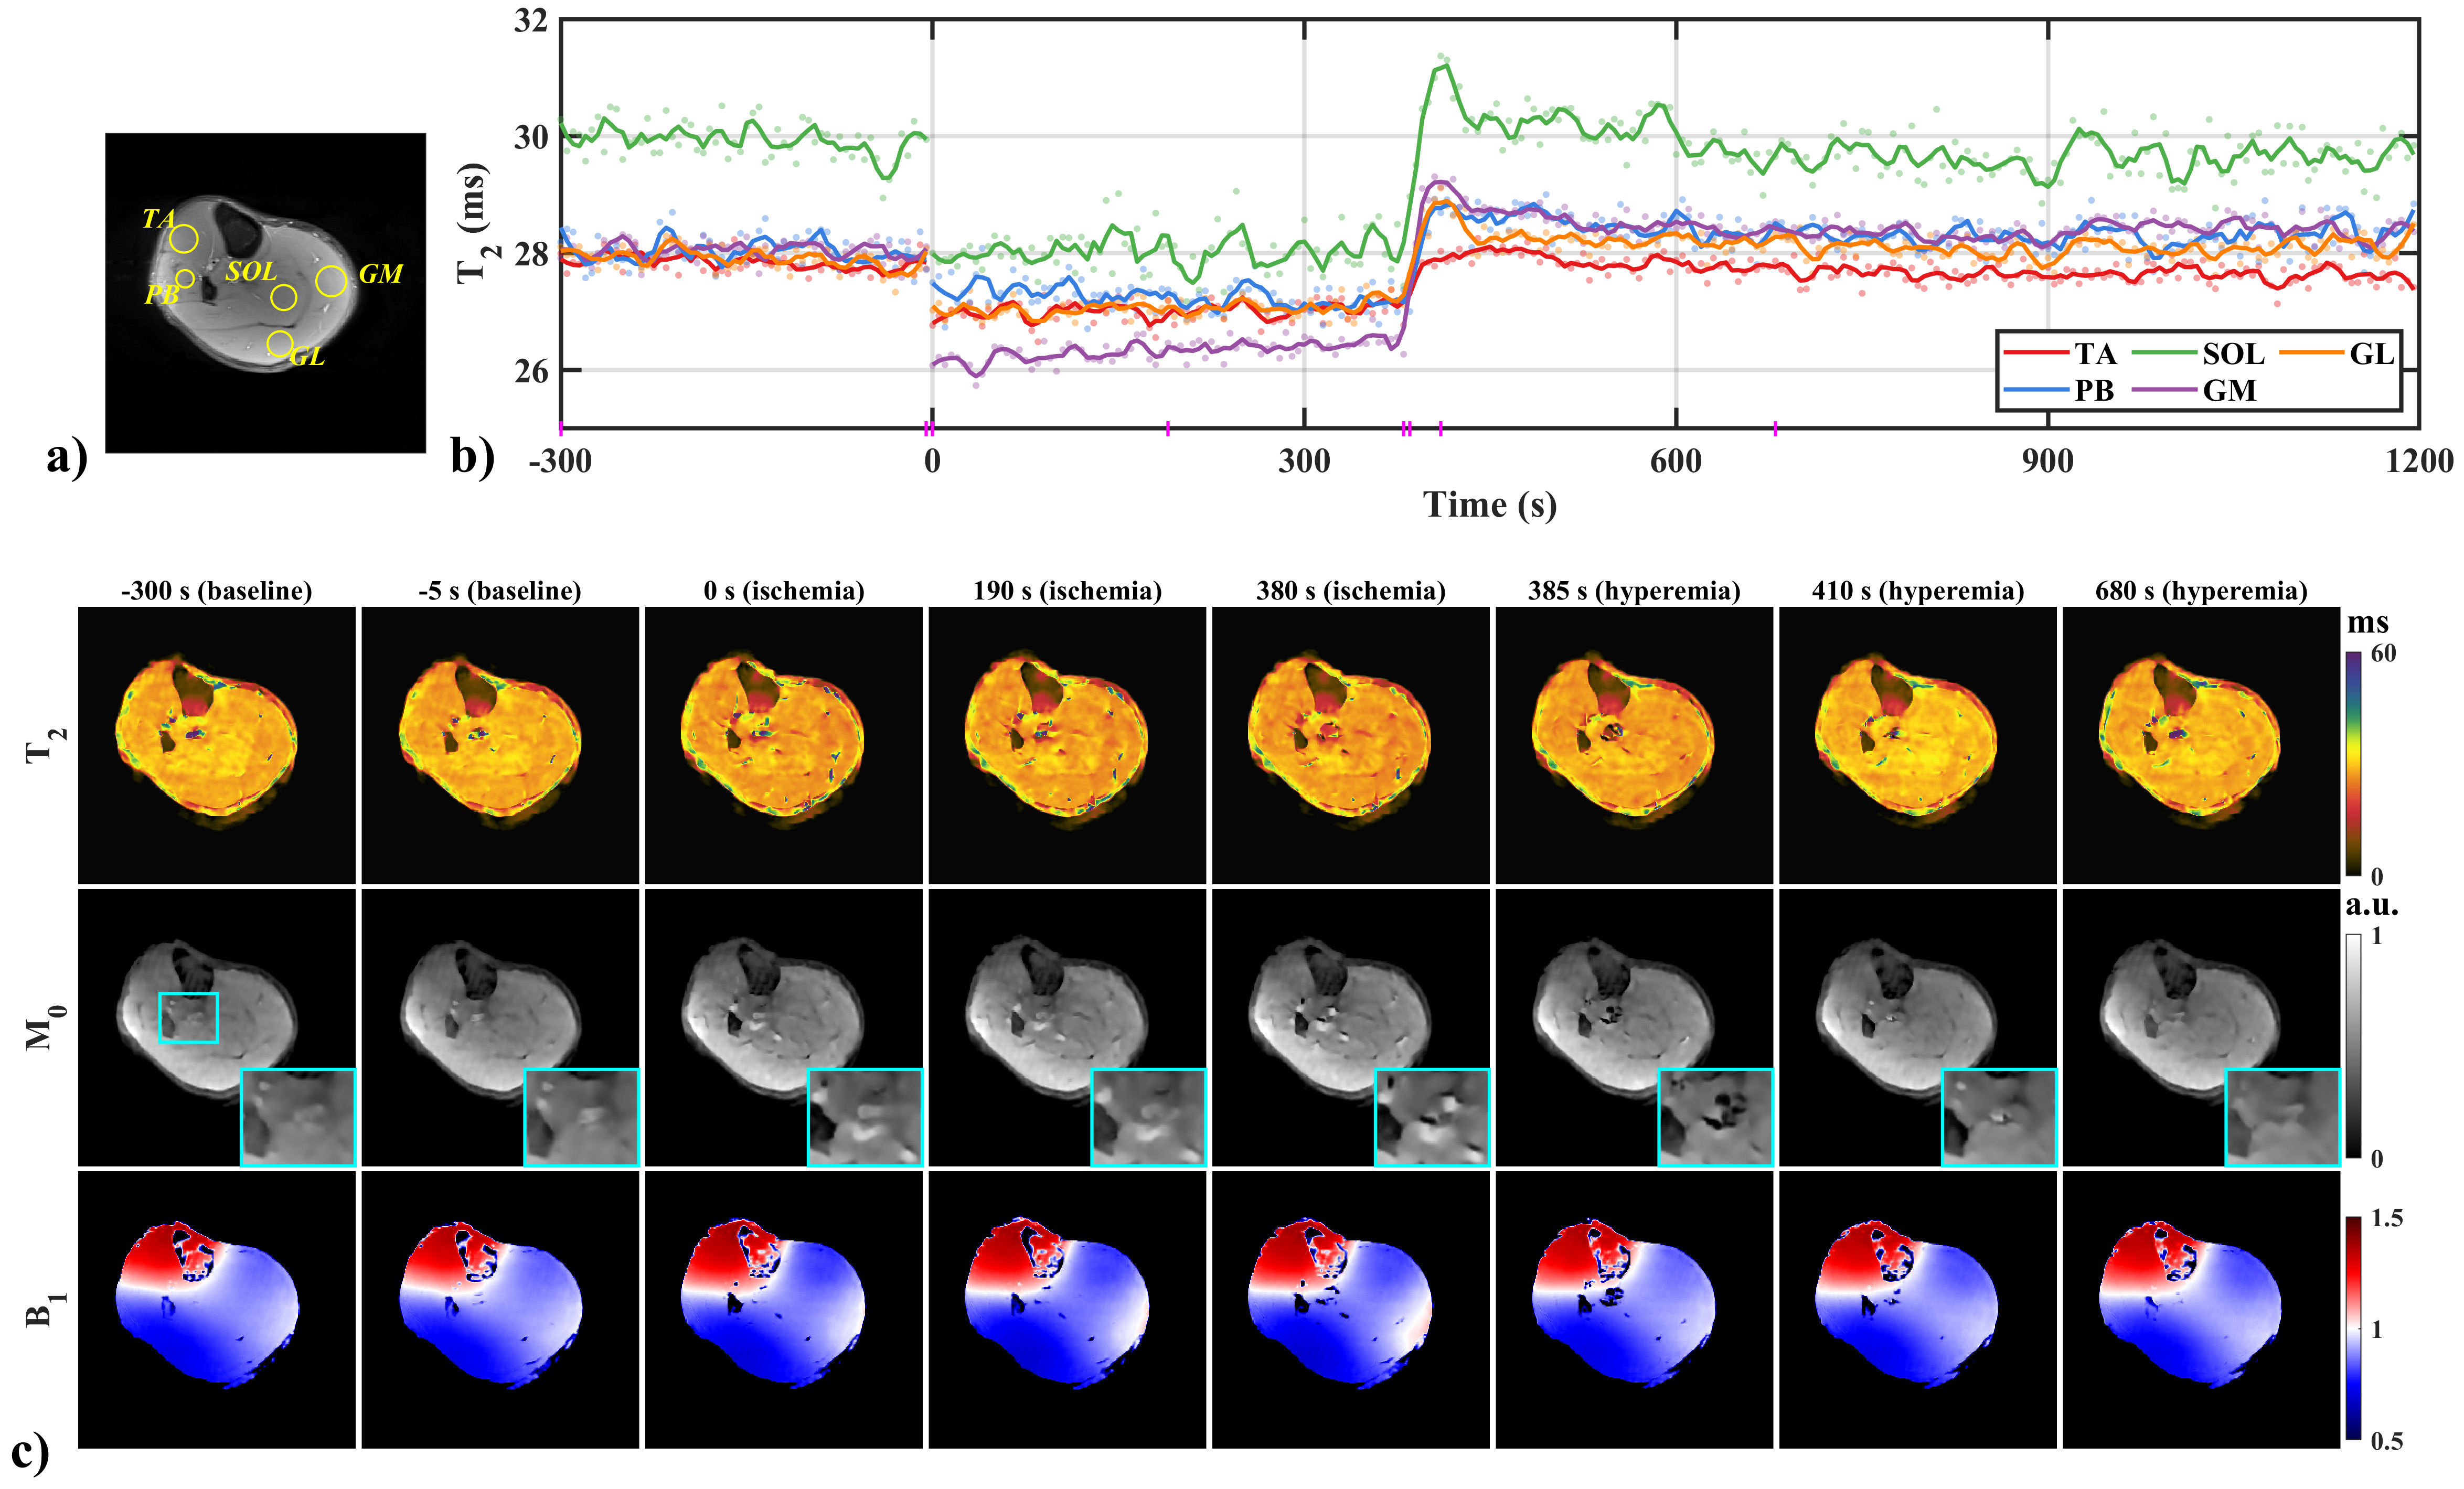
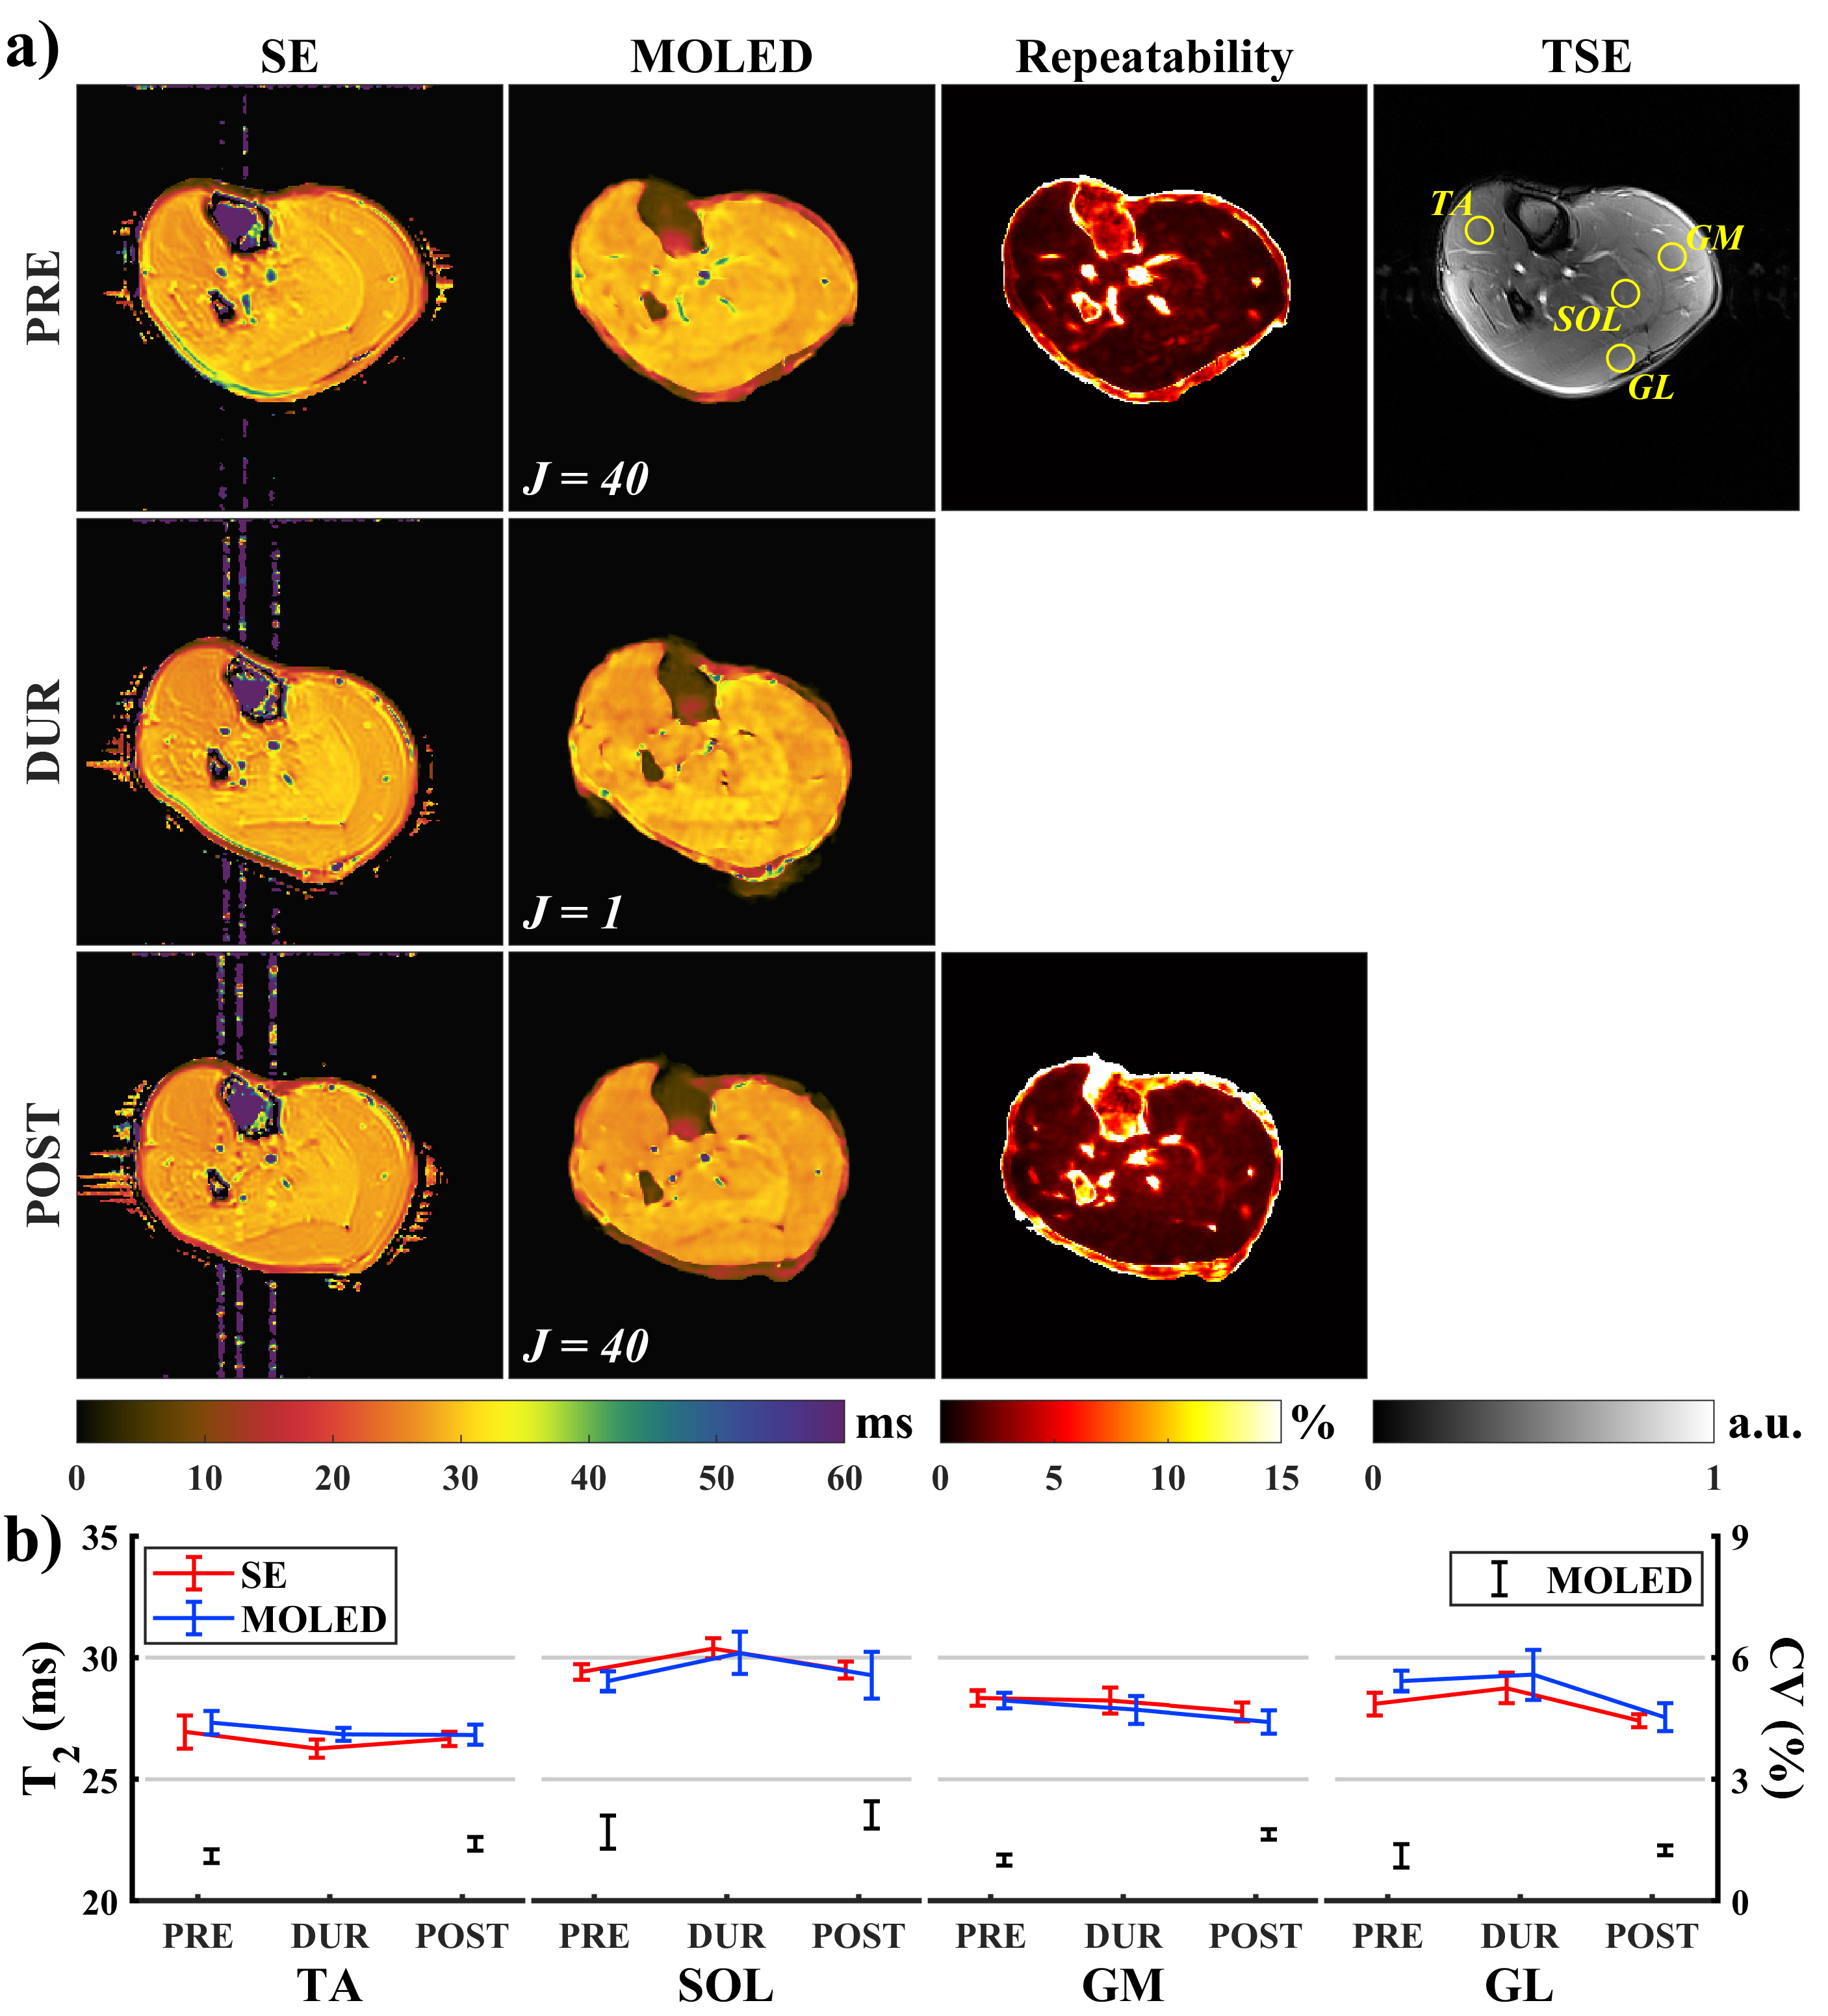
Figure 2 shows the results of the ischemia and post-occlusive reactive hyperemia experiment. Except for only 147 pixels for peroneus brevis (PB), circular regions of interest (ROIs) containing at least 300 pixels were manually delineated, and vessels, nerves, and fasciae were excluded (Figure 1a). Figure 2b discloses T2 decline with different degrees in the ischemia period in contrast to the baselines, and excessive rebound at the beginning of the hyperemia period except tibialis anterior (TA), which restored to baseline values gradually. In soleus (SOL), for instance, the ischemia-induced T2 decline was about 2.92 ms, and the instantaneous T2 increment was about 3.93 ms at the initial 30 seconds of the hyperemia period. Figure 2c displays T2, M0, and B1 maps in some time points (marked on the x-axis of Figure 1b with magenta vertical lines), where an M0 hyperintense of vessels gradually emerged with the deepening of the ischemia and prominent flow voids appeared once the tourniquet was removed (Figure 2c, cyan zoom-in boxes).Figure 3a shows the inter-day T2 variation of tissues and the results of repeatability measurements. In Figure 3b, mean T2 values and CVs were calculated from 195 pixels in each circular ROI (delineated on the TSE image). Two maximum percentage errors of the mean T2 were observed in the gastrocnemius lateralis (GL) at PRE (3.37%) and in the TA at DUR (2.25%), respectively, and the others were less than 2%. Apart from a slightly different variation trend presented in the mean T2 of the TA between DUR to POST, the others were consistent. In the coefficient of variation (CV) map at PRE, large CVs were observed in vessels and nerves, whose structures corresponded to the TSE image. Maximum CV was 2.10% in the SOL at POST, while the others were less than 2%.
Discussion and conclusion
In this work, we evaluated a single-shot qMRI method in dynamic scenarios. Consistent conclusions were found in literature5, corroborating the dynamic tracking potential of our method. Compared to other qMRI methods, the advantages of our method could be summarized as (1) high temporal resolution; (2) immunity to B1 inhomogeneity;2 (3) synchronous multiparametric mapping, which facilitates complementary tissue information and comprehensive tissue characterization. Expectantly, MOLED may provide new insights into the metabolic responses of musculature to human activities.Acknowledgements
This work was supported in part by the Nation Natural Science Foundation of China under 11775184 and 22161142024.References
1. de Mello R, Ma Y, Ji Y, et al. Quantitative MRI musculoskeletal techniques: an update. AJR Am J Roentgenol. 2019; 213: 524- 533
2. Zhang J, Wu J, Chen SJ, et al. Robust single-shot T2 mapping via multiple overlapping-echo acquisition and deep neural network. IEEE Trans Med Imaging. 2019; 38(8): 1801-1811.
3. Ouyang BY, Yang QZ, Wang XY, et al. Single-shot T2 mapping via multi-echo-train multiple overlapping-echo detachment planar imaging and multitask deep learning. Med Phys. 2022, doi:10.1002/mp.15820.
4. Yang QZ, Wang XY, Cai SH, et al. Dynamic T2 mapping on skeletal muscles via multiple overlapping-echo detachment planar imaging. Proc Intl Soc Mag Reson Med. London, UK. 2022; 30: 3096.
5. de Sousa PL, Vignaud A, Fleury S, and Carlier PG, Fast monitoring of T1, T2, and relative proton density (M0) changes in skeletal muscles using an IR-TrueFISP sequence. J Magn Reson Imaging. 2011, 33(4): 921-930.
Figures