4215
Enhanced Precision of the OXPHOS Measurement with integrated CrCEST MRI and Down Field Proton MR Spectroscopy1Radiology, University of Pennsylvania, Philadelphia, PA, United States
Synopsis
Keywords: Muscle, CEST & MT, creatine kinase; OXPHOS; Oxidative Phosphorylation
Creatine recovery time constant (τCr) of exercised muscle is strongly coupled to net mitochondrial oxidative phosphorylation. However, local in vivo pH drop plays the role of a potential confounder, leading to significantly slower creatine recovery. Even under the same prescribed exercised regime, the extent of acidification and hence its impact on τCr would be variable across participant. To the best of our knowledge, this is the first study where downfield 1H-MR spectroscopy and 3D creatine chemical exchange saturation transfer are extensively used to prescribe mild exercise regime in terms of maximal voluntary contraction of participants while avoiding any acidification.Introduction
The abnormality in creatine kinase (CK) kinetics has been implicated in systemic disorders, such as primary mitochondrial disorders [1], diabetes mellitus [2], Alzheimer’s disease [3], Parkinson’s disease [4] and cardiovascular disease [5], as well as other musculoskeletal diseases and disorders. The rate of phosphocreatine (1/τPCr) or creatine (1/τCr) recovery after exercise, governed by the CK reaction, is known to be strongly coupled to net mitochondrial oxidative phosphorylation (OXPHOS) or ATP synthesis. Longer τPCr (or τCr) for a particular muscle group being suggestive of lower OXPHOS capacity [1]. Though phosphorous magnetic resonance spectroscopy (31P-MRS) has traditionally been used as a noninvasive imaging biomarker to assess OXPHOS capacity, its clinical utility is limited due to poor spatial resolution and low sensitivity. In contrast, 2D/3D creatine CEST (CrCEST) with sufficient spatial resolution, sufficient volume coverage, and a temporal resolution of ~30s has been successfully used to measure τCr-values on an inter-muscular basis [6].Inter-muscular τCr-values should only be dependent on intrinsic factors such as skeletal muscle contractile function, the restoration of energy balance, and tissue oxygenation. However, a drop in intracellular pH leads to significant biases in estimated τCr-values, resulting from a significant drop in CrCEST asymmetry as well as a reduction in the forward reaction of creatine enzyme kinetics [7]. In this work, we have investigated the role of different exercise intensities on intracellular pH and τCr-values of the exercised muscle groups using downfield 1H-MR spectroscopy (DF-MRS) and 3D CrCEST respectively. Aided by these two non-invasive imaging modalities, we lay out a systematic approach to prescribe a mild exercise regime which does not lead to acidosis.
Methods
Four subjects (males, 22-44 years old) were scanned under an approved local IRB. All MR images were acquired at a 7T MRI scanner (MAGNETOM Terra, Siemens Healthcare, Erlangen, Germany) using a 28-Channel phased-array knee coil (Quality Electrodynamics, Mayfield Village, USA). First baseline data were acquired for 2 minutes. Following that prescribed in-scanner exercise bouts were performed. Post-exercise, muscle energy was assessed using either CrCEST or DF-MRS.First baseline data were acquired for 2 minutes. Following that prescribed in-scanner exercise bouts were performed. Post-exercise, muscle energy was assessed using either CrCEST or DF-MRS.
Measuring Maximal Voluntary Contraction (MVC): The resistance of the ergometer (Ergospect Trispect, Ergospect, Austria) was adjusted to 95 psi and each participant was asked to push the pedal of the ergometer with maximum force for 4-5 seconds using only calf muscle.
Exercise Work Load Levels (EWLLs): Three EWLLs based on resistance level, push-pedal frequency (PPF) and total duration were tested: mild exercise: (10% MVC, 20 beats per minute or BPM, 2 minutes); moderate exercise: (10% MVC, 30 BPM, 2 minutes); intense exercise: (20% MVC, 30 BPM, work till exhaustion). Maximum angular displacement of 40o was allowed.
Creatine CEST: The prototype sequence consisted of the pulse train (5x100ms Hanning windowed, duty cycle 99%, B1,rms of 2.9 μT ), followed by GRE read out with TR = 3.5ms, TE = 1.47ms, receiver-BW= 710Hz/pixel. Other imaging parameters and the procedure for B0- and B1-correction has been described previously [6].
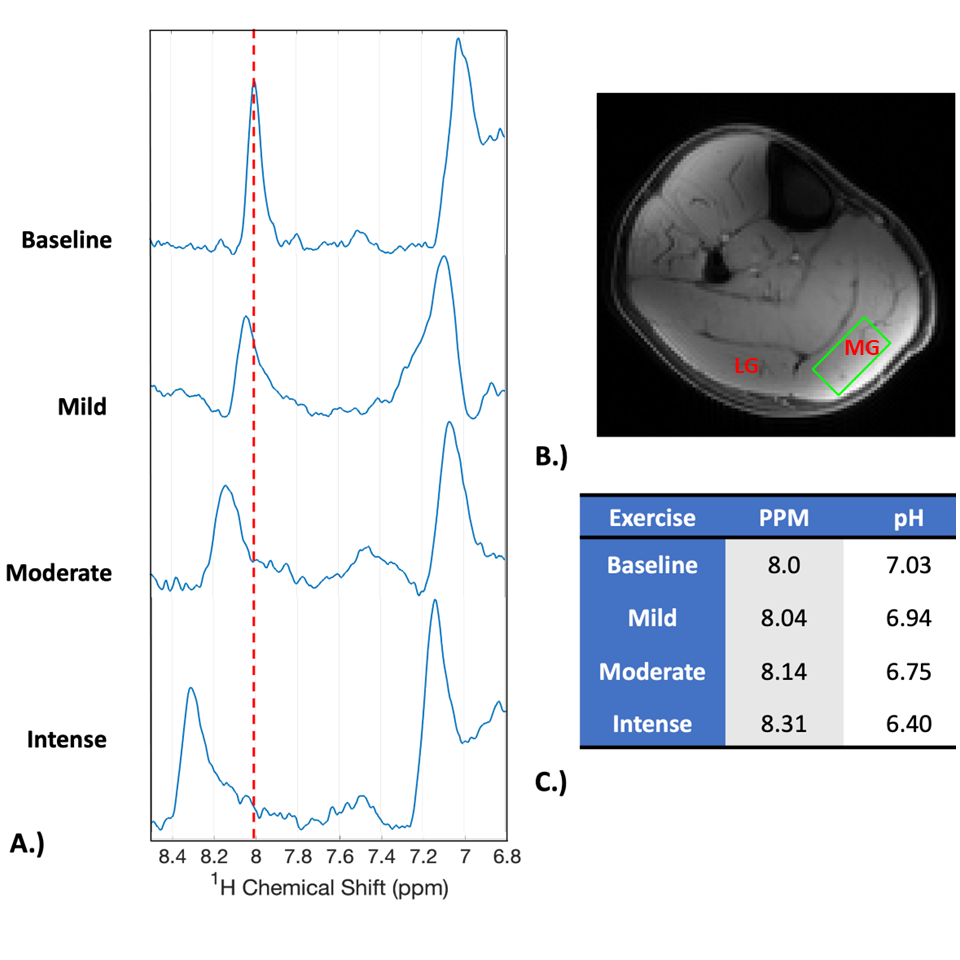
DF-MRS: A spectrally selective 90° E-BURP pulse [8] centered at 7.7 ppm with a excitation bandwidth of 2 ppm and water saturation on, was used to excite the homocarnosine peaks (TR/TE: 1400/18ms, 16 averages), and 3 narrow spatially selective refocusing 180° Shinnar-Le Roux (SLR) pulses (BW: 800Hz) were used for localization as described in our previous study [9]. Other parameters were: receiver bandwidth 2000 Hz, phase cycling factor (PCF) 16, voxel size 30x15x15 mm3, and temporal resolution ~ 22s. The voxel of interest was chosen in medial gastrocnemius (MG) or lateral gastrocnemius (LG) based on the results of CrCEST. The pH shift was calculated using the chemical shift of C2-H homocarnosine resonance based on the adjusted Henderson-Hasselbach equation [10].
Results
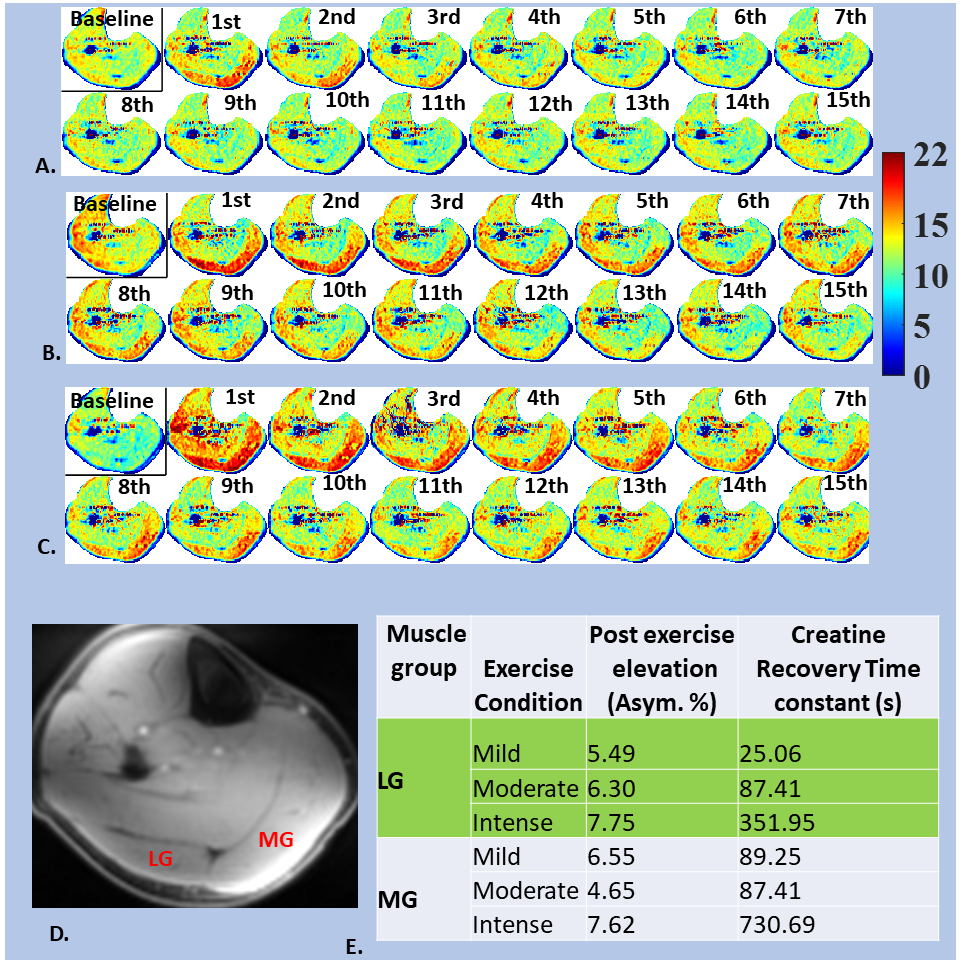
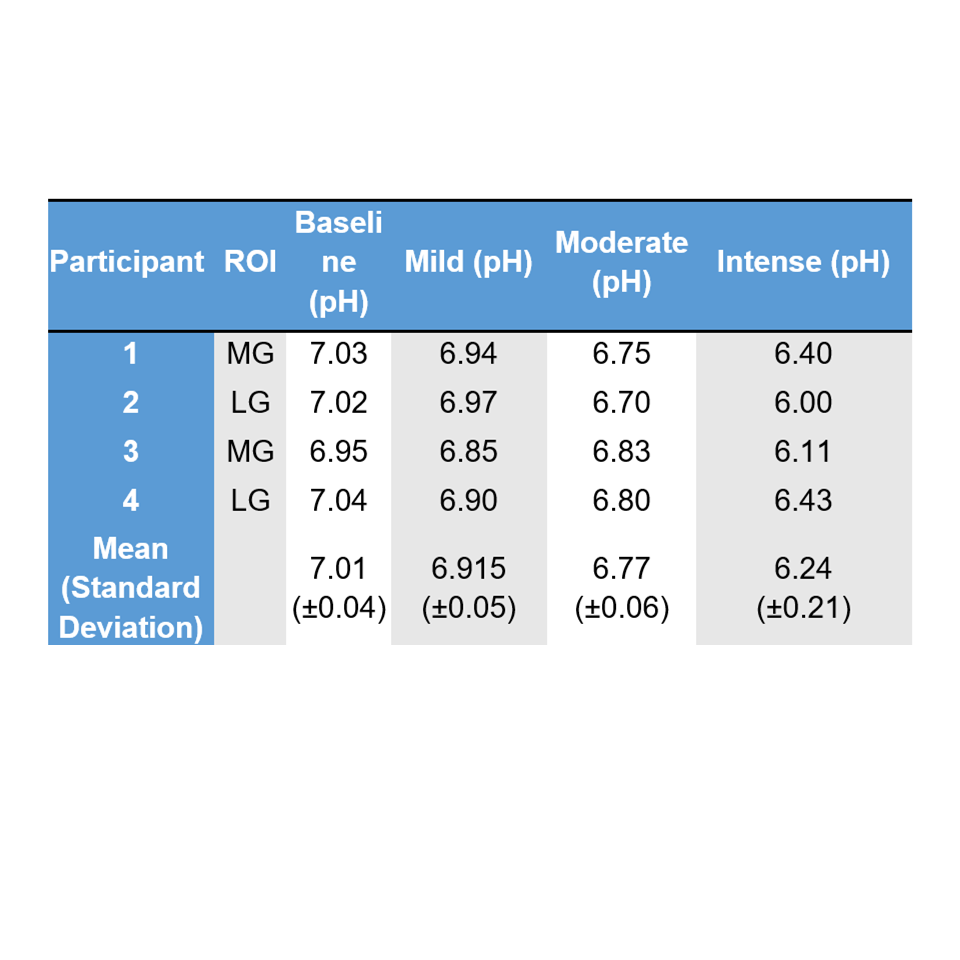
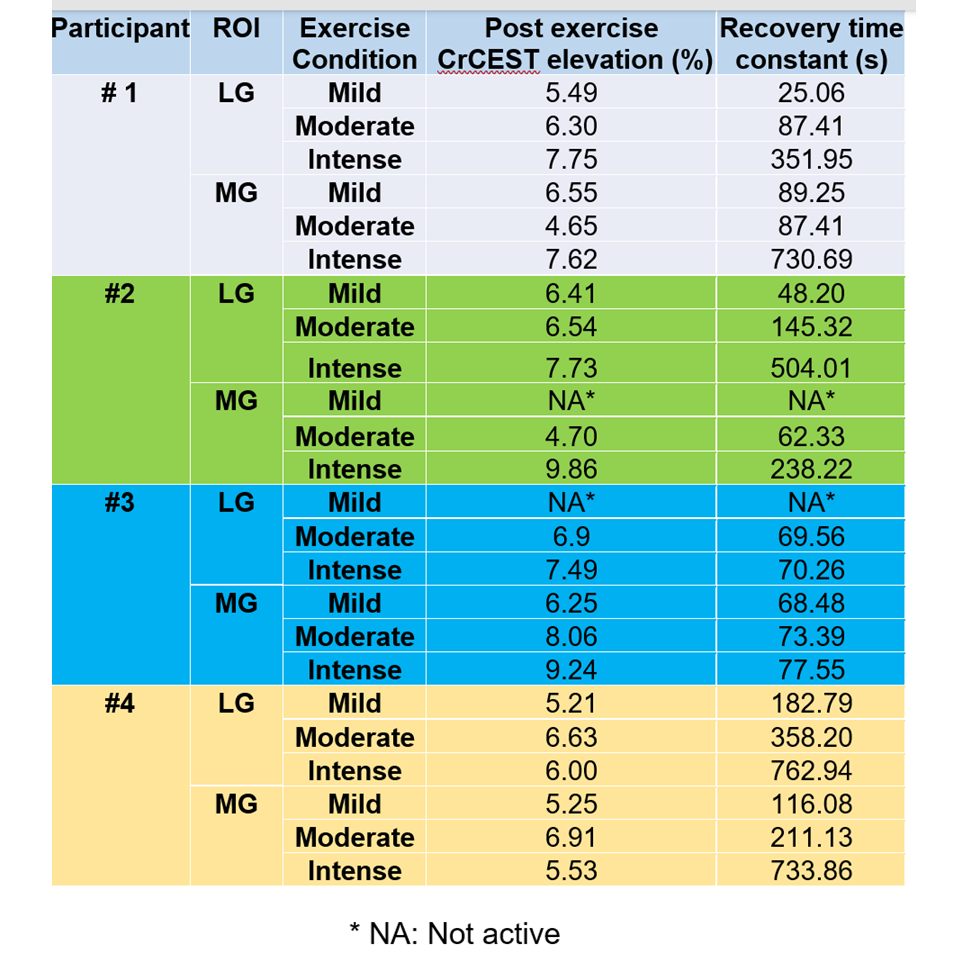
16-step PCF was found to be essential for the stability of post exercise C2-H homocarnosine peak . Though the pre-exercise spectra showed well-resolved peaks of homocarnosine for lower PCF (~2, 4), post-exercise spectra were unstable with significant baseline distortions near 8.0 ppm. Figure 1A shows the chemical shift for three exercise regimes in the MG of a selected participant. The pH shift (~0.1 ppm) was negligible for mild exercise and increased with the increased exercise intensity (Fig. 1C). This trend was shared for all participants (Tab. 1).Fig 2, panel-1 shows representative CrCEST time series for the same volunteer. As evident, the muscle-specific τCr-values also increased with increased exercise intensity (mild: Fig. 2A; moderate: Fig. 2B; intense: Fig 2C). This trend was consistent across all volunteers (Tab. 2).
Discussion
Biased τCr-values measured in the presence of intracellular acidosis do not reflect true OXPHOS capacity. As devolving pH effect would require pH recovery information on subject wise basis and complicated mathematical modelling, it’s more practical to prescribe mild exercise regime that does not lead to pH changes. For the prescribed mild exercise regime, the post-exercise CrCEST elevation was sufficiently high and the recovery time constant sufficiently long to be detected by our CrCEST protocol.Conclusions
DF-MRS based Carnosine spectra can be used to quickly measure pH change induced by a prescribed exercise regime and thus, can facilitate an unbiased measurement of OXPHOS capacity with CrCEST.Acknowledgements
Research reported in this publication was supported by the National Institute of Biomedical Imaging and Bioengineering of the National Institutes of Health under award Number P41EB029460 and R03EB030663, the National Institute of Aging Awards under R56AG062665 and R01AG071725.References
[1] C. DeBrosse et al., “Muscle oxidative phosphorylation quantitation using creatine chemical exchange saturation transfer (CrCEST) MRI in mitochondrial disorders.,” JCI insight, vol. 1, no. 18, p. e88207, 2016, doi: 10.1172/jci.insight.88207.
[2] B. K. Popovich, K. R. Boheler, and W. H. Dillmann, “Diabetes decreases creatine kinase enzyme activity and mRNA level in the rat heart,” Am J Physiol, vol. 257, pp. 573–577, 1989.
[3] S. David, M. Shoemaker, and B. E. Haley, “Abnormal properties of creatine kinase in Alzheimer’s disease brain: Correlation of reduced enzyme activity and active site photolabeling with aberrant cytosol-membrane partitioning,” Mol. Brain Res., vol. 54, no. 2, pp. 276–287, 1998, doi: 10.1016/S0169-328X(97)00343-4.
[4] H. Takubo, S. Shimoda-Matsubayashi, and Y. Mizuno, “Serum creatine kinase is elevated in patients with Parkinson’s disease: A case controlled study,” Park. Relat. Disord., vol. 9, no. SUPPL. 1, pp. 43–46, 2003, doi: 10.1016/S1353-8020(02)00121-9.
[5] D. Ooi, P. Isotalo, and J. Veinot, “Correlation of antemortem serum creatine kinase, creatine kinase-MB, troponin I, and troponin T with cardiac pathology,” Clin Chem., vol. 46, no. 3, pp. 338–344, 2000.
[6] D. Kumar et al., “Recovery kinetics of creatine in mild plantar flexion exercise using 3D creatine CEST imaging at 7 Tesla,” no. October 2019, pp. 1–16, 2020, doi: 10.1002/mrm.28463.
[7] J. ‐F Goudemant, L. Vander Elst, B. Dupont, Y. Van Haverbeke, and R. N. Muller, “pH and temperature effects on kinetics of creatine kinase in aqueous solution and in isovolumic perfused heart. A 31P nuclear magnetization transfer study,” NMR Biomed., vol. 7, no. 3, pp. 101–110, 1994, doi: 10.1002/nbm.1940070302.
[8] H. Geen and R. Freeman, “Band-selective radiofrequency pulses,” J. Magn. Reson., vol. 93, no. 1, pp. 93–141, 1991, doi: 10.1016/0022-2364(91)90034-Q.
[9] P. Bagga et al., “Single-Voxel 1H MR spectroscopy of cerebral nicotinamide adenine dinucleotide (NAD+) in humans at 7T using a 32-channel volume coil,” Magn. Reson. Med., vol. 83, no. 3, pp. 806–814, 2020, doi: 10.1002/mrm.27971.
[10] B. M. Damon, A. C. Hsu, H. J. Stark, and M. J. Dawson, “The Carnosine C-2 Proton’s Chemical Shift Reports Intracellular pH in Oxidative and Glycolytic Muscle Fibers,” Magn. Reson. Med, vol. 49, pp. 233–240, 2003, doi: DOI 10.1002/mrm.10384.
Figures