4214
A multiparametric protocol to investigate the effects of physical activity on lumbar spine muscles1Medical Physics Group, Institute of Diagnostic and Interventional Radiology, Jena University Hospital, Jena, Germany, 2Institute of Diagnostic and Interventional Radiology, Jena University Hospital - Friedrich Schiller University, Jena, Germany, 3Michael Stifel Center for Data-driven and Simulation Science, Friedrich Schiller University, Jena, Germany, 4Abbe School of Photonics, Friedrich Schiller University, Jena, Germany, 5Center of Medical Optics and Photonics, Friedrich Schiller University, Jena, Germany
Synopsis
Keywords: Muscle, Quantitative Imaging
It is well established in literature that MRI quantitative parameters such as T2 or diffusion coefficients change significantly immediately after a strenuous exercise session. In this work, we instead focus on the long-term effects of regular repeated physical activity on three cohorts characterized by different training regimes. A multiparametric protocol was developed to assess T1, T2, fat fraction, and IVIM diffusion values to examine differences in lumbar spine muscle physiology between the different cohorts.Introduction
Low back pain, especially nonspecific low back pain, is the leading cause of disability worldwide, but the mechanisms for its onset and development, as well as the selection of effective treatments, are still not fully understood1,2. Physical activities of various types, from stretching exercises to strength training, are often suggested as treatment, but their effectiveness varies3. The effects of physical activity on skeletal muscle physiology have been extensively studied by MRI in the past, but these MRI studies mostly focused on the differences between parameters before and after an exercise session4,5. In this study, we developed a multiparametric MRI protocol to quantify the values of relevant MR-based parameters in the lumbar spine muscle (specifically the multifidus and erector spinae muscles in the area between L4 and L5). Data were collected from volunteers (healthy men aged 20-30 years) belonging to one of three cohorts: endurance athletes, strength athletes, and a sedentary control group. The athletes trained at least 5 times per week. Lumbar spine muscles were assessed at rest (at least 48h after the last training session) to determine the potential long-term effects of repeated training on muscle physiology.Methods
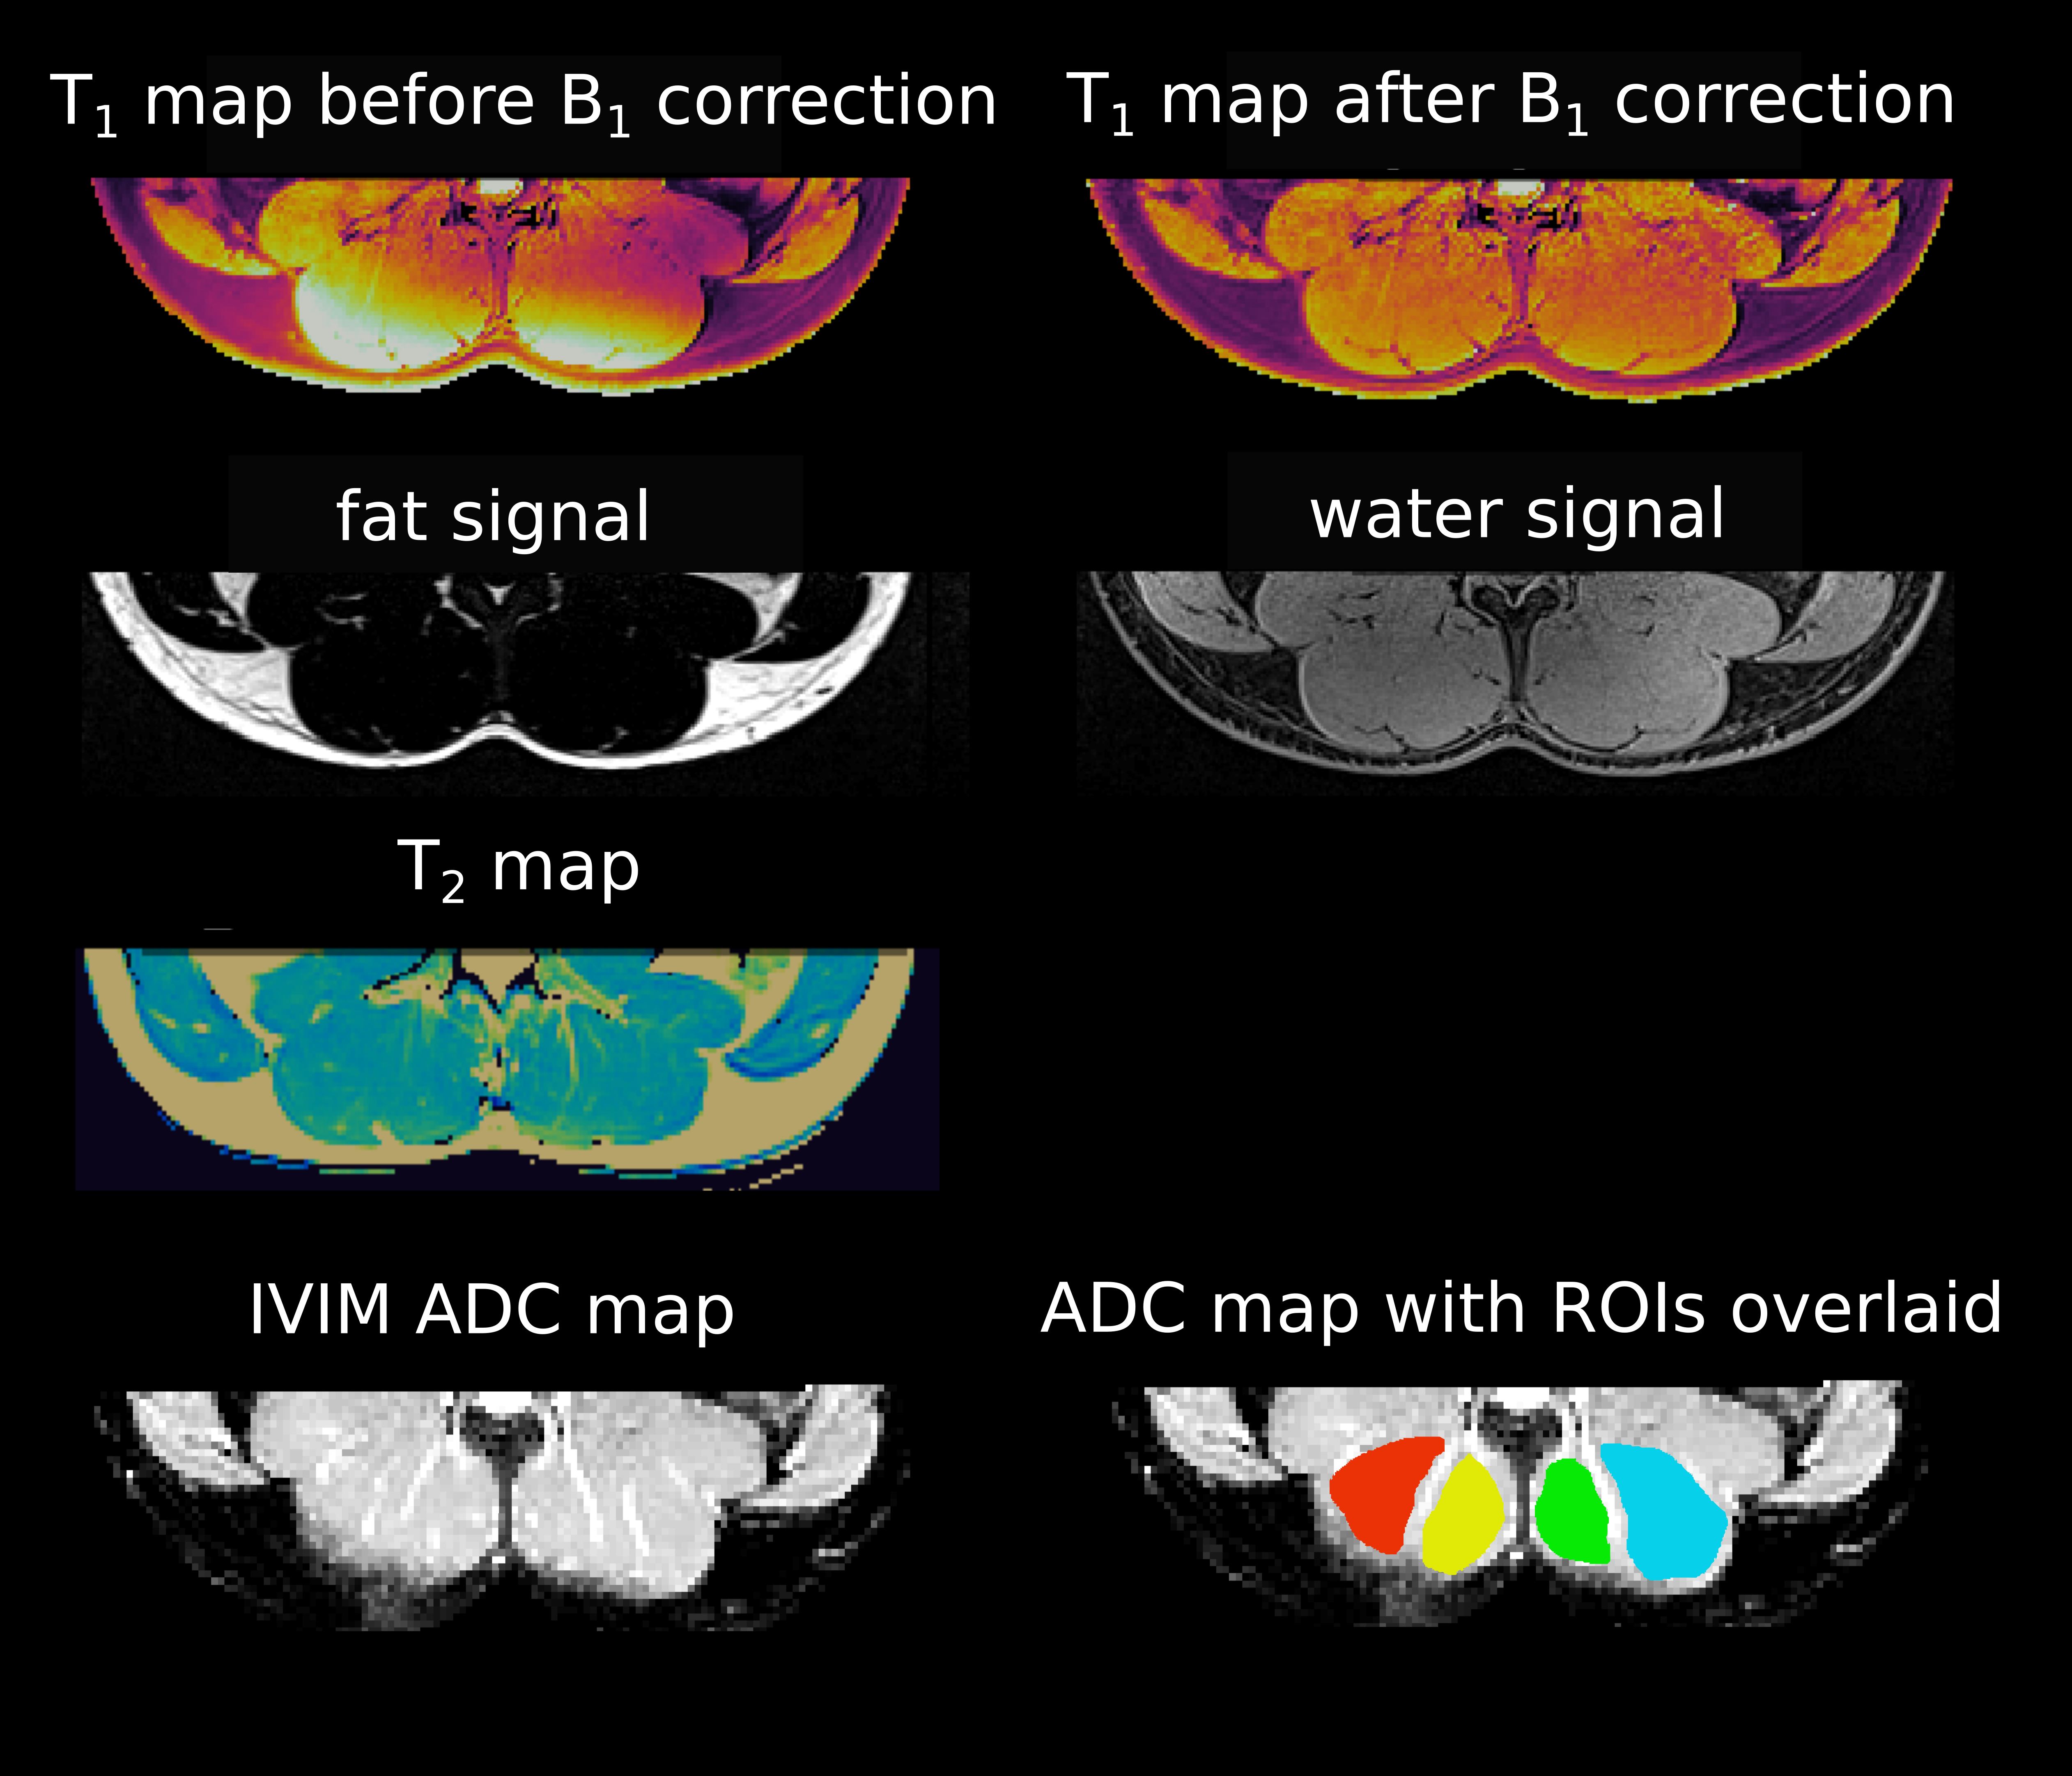
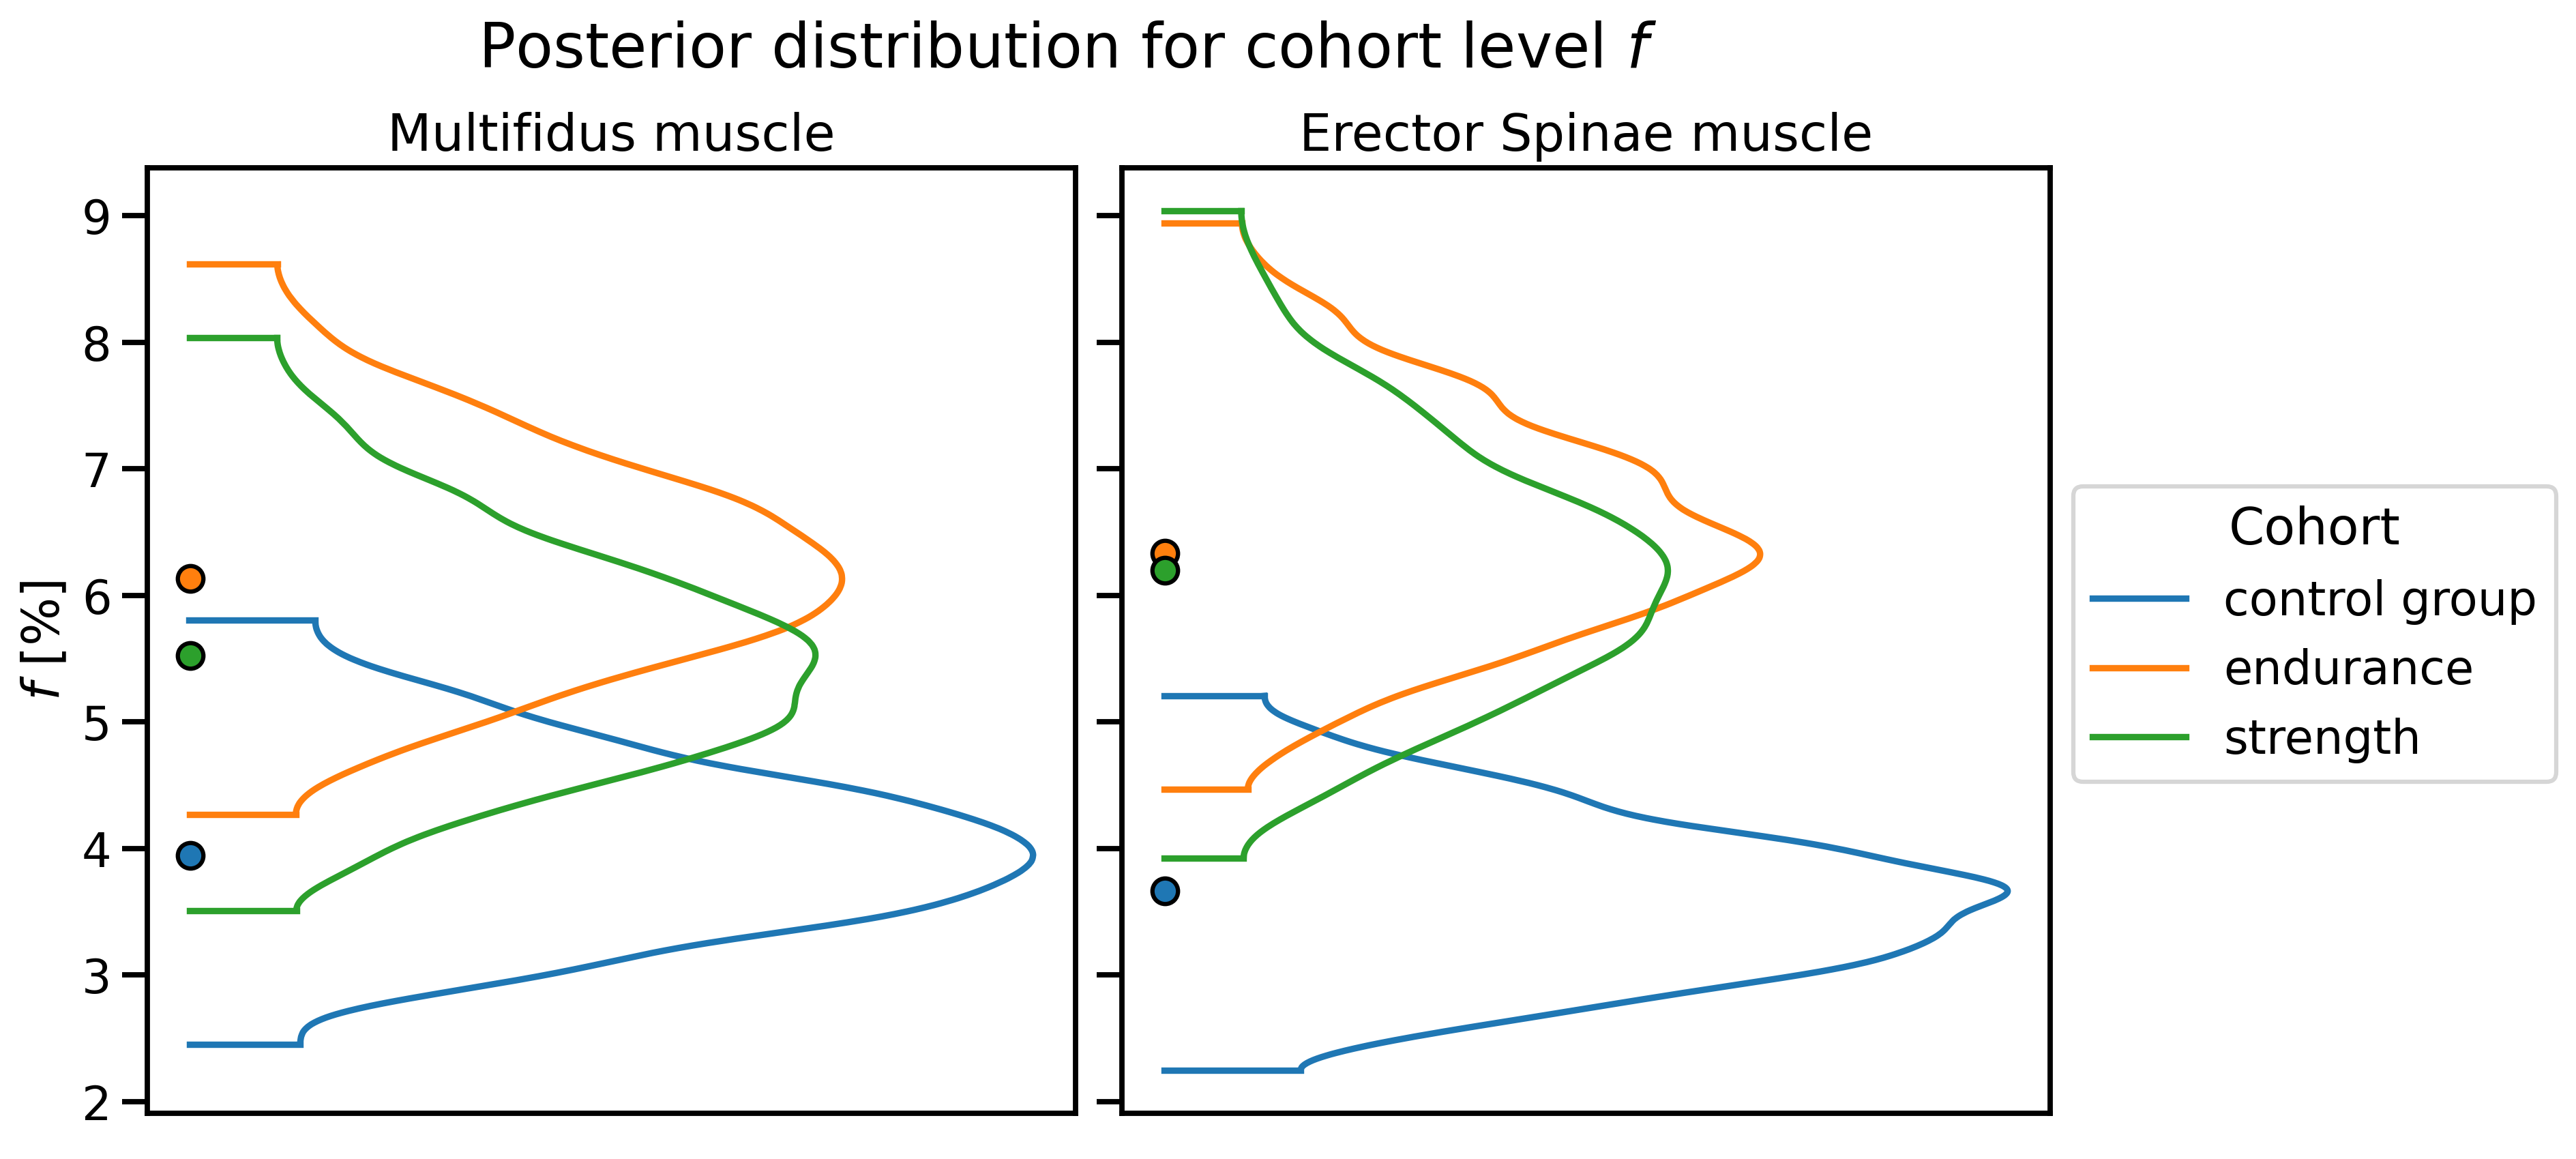
The parameters determined with the developed protocol were T1, T2, fat fraction, and IVIM diffusion values (Fig. 1).T1 mapping was performed with GRE VFA6 (FAs= 4°, 10°, 18°, 24°, 32°), B1-corrected according to the Bloch-Siegert method7. T2 maps were obtained using a multi-echo TSE sequence (28 TEs ranging from 5 ms to 187 ms). A 2-point Dixon sequence was used to separate water and fat8. All aforementioned sequences used the same voxel size of (1.5x1.5x3) mm3. IVIM-DWI data9 were acquired with a multi-slice spin-echo EPI sequence with TR=1600 ms, TE=63 ms, 4 averages, 19 b-values (ranging from 0 to 600 s/mm2) and 6 orientations; the voxel size was (2.3x2.3x8) mm³. The total acquisition time was 50 min. All measurements were performed on a 3T Siemens PRISMA scanner using the vendor-supplied spine array coil. The endurance cohort (n=7) consisted of long distance runners and cyclists, the strength training cohort (n=5) of powerlifters, and the control group (n=6) of sedentary subjects. T1 and T2 values were calculated by voxel-wise fitting of the VFA FLASH data and the monoexponential decay signals, respectively, and averaging across ROIs drawn for the chosen muscles.The IVIM signal model was fitted to the signal evolution averaged over the individual ROIs using a hierarchical Bayesian model, equipped with cohort-level f. Differences between cohorts were considered significant if the 95% highest density interval (HDI) for the marginal posterior of f in one cohort did not include the maximum-a-posteriori estimate of the other10.Results
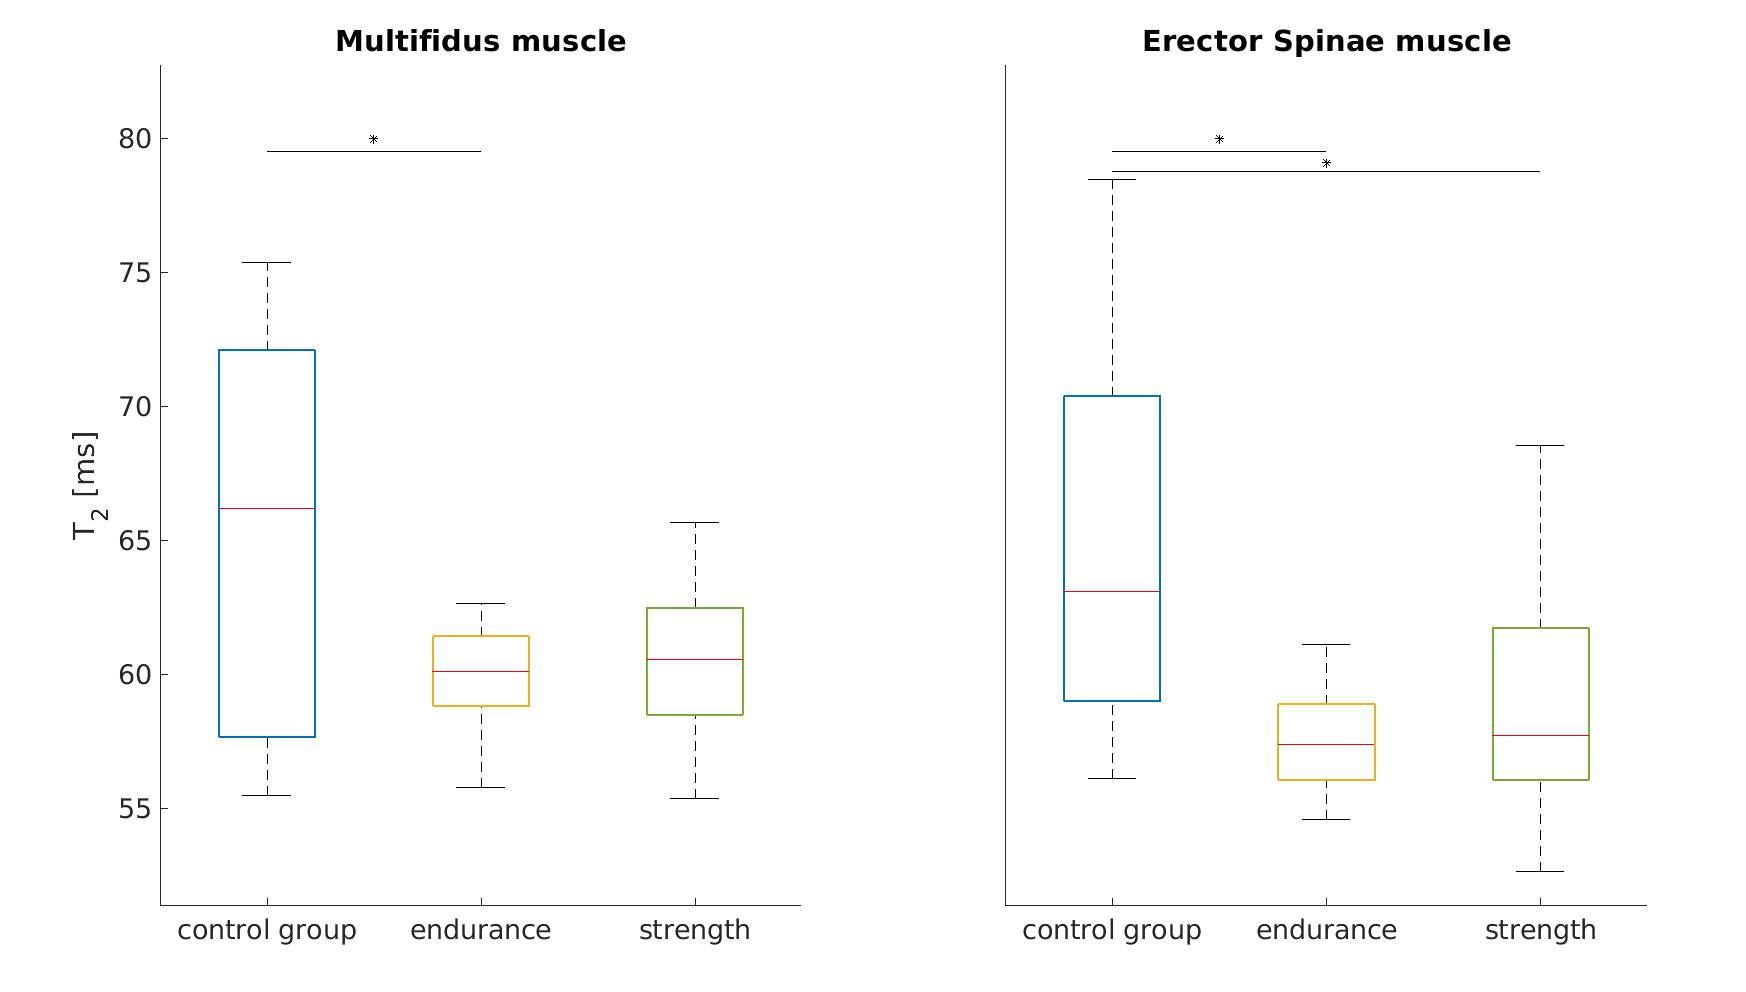
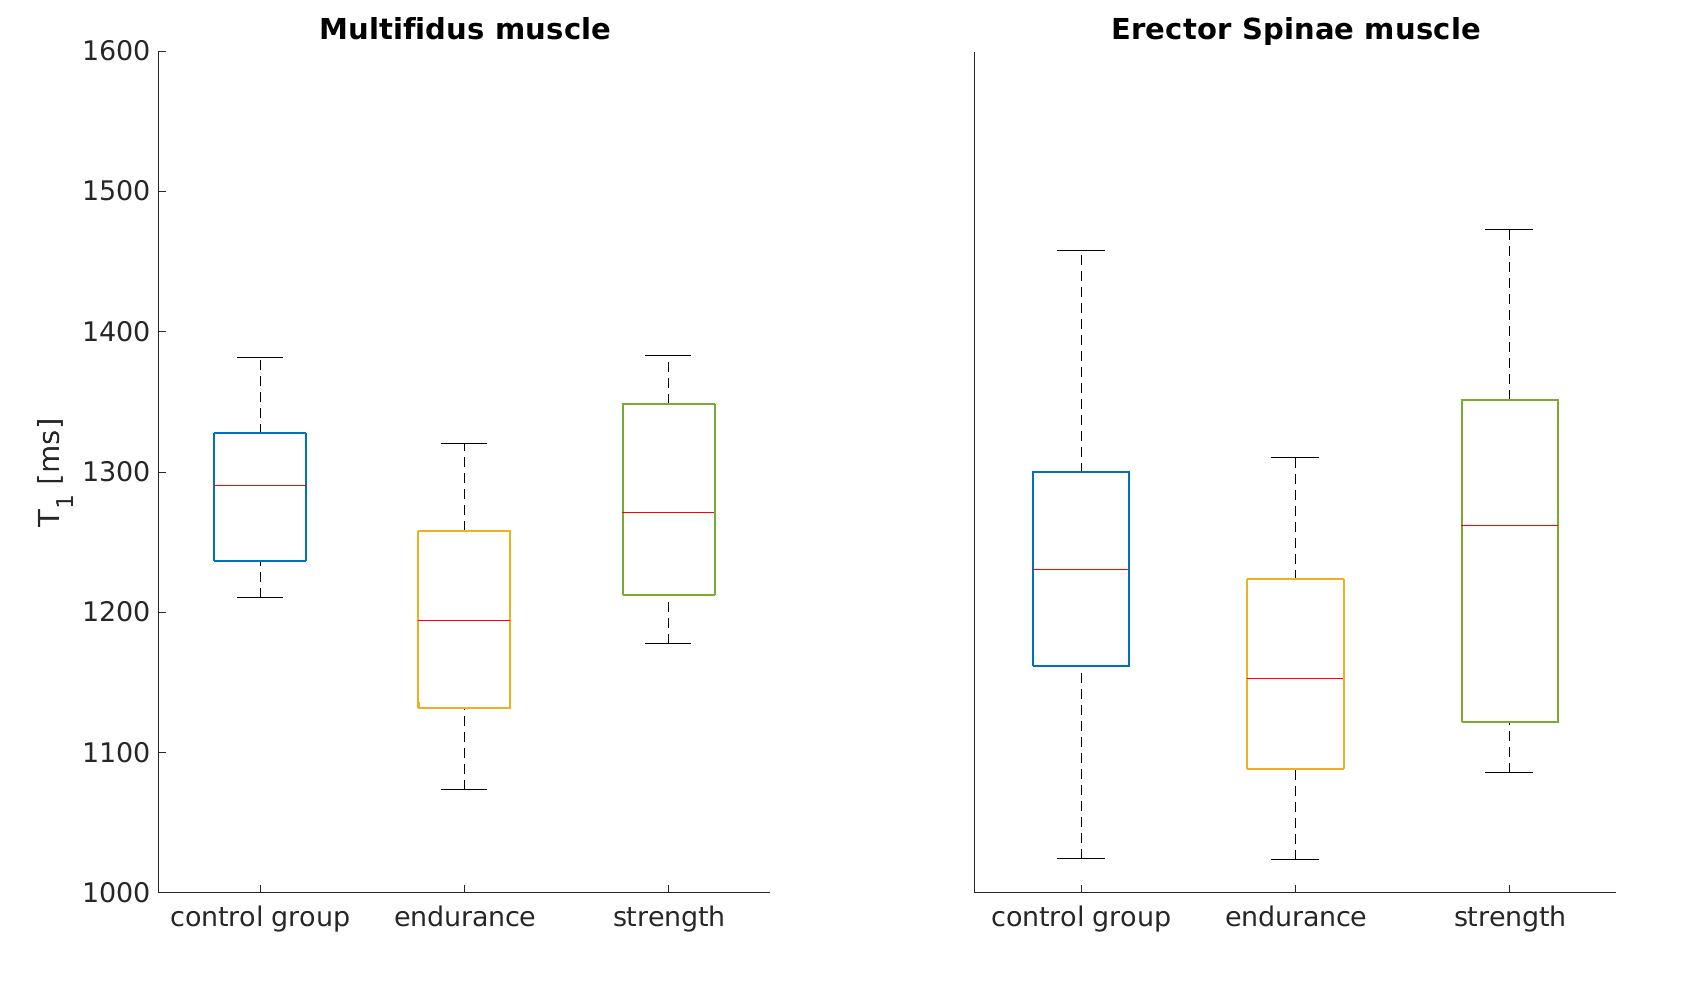
T2 relaxation times (Fig. 2) were significantly lower in the endurance athletes than in the control group, for both the multifidus and erector spinae (Wilcoxon-Mann-Whitney-Test p<0.05). An apparent reduction of T1 in the endurance athletes compared to the control group (Fig. 3) was not statistically significant. The strength athletes had lower T2 and T1 values in both muscles (for T2, the difference in the erector spinae muscle was significant, while the difference in T1 was not). In both muscles, the estimated perfusion fraction f behaved similarly. Compared with the control group, it appeared significantly increased in both muscles in the endurance cohort and in the erector spinae in the strength cohort (Fig. 4). The average fat fraction was 4% in the endurance cohort, 6% in the strength cohort, and 15% in the control group.Discussion and Conclusion
The lower values of the transverse relaxation parameter have already been reported in the literature for endurance athletes11,12 but the reason for this has only been speculated. Several hypotheses have been proposed: a higher proportion of slow-twitching muscle, 13,14 (which, however, are less present in the powerlifter cohort), an increase in bound water as a consequence of training11, or a more ordered and compact muscle tissue in athletes15. The latter two hypotheses could be an explanation for the observed difference between T2 (and T1) in both the athlete cohorts and the control group. It should be noted that the lower fat content in the athlete cohorts could contribute to the lower values of T2. This is a direct consequence of any type of physical activity that consumes intramuscular fat16 and has been reported previously for other skeletal muscle tissues11,17. The increased value of the IVIM parameter f for the athlete cohorts is consistent with the literature reporting increased perfusion in trained muscle18; interestingly, this phenomenon was usually measured after exercise but has not previously been reported for the lumbar back muscle at rest. However, none of the parameters studied with our protocol was able to significantly discriminate between the two athlete cohorts.To the authors’ knowledge, this work is the first comprehensive evaluation of T1, T2, fat fraction and IVIM parameters for lumbar spine muscle and the first to compare endurance, strength, and sedentary cohorts at rest. A major limitation of the study is the small sample size. However, there are plans to measure more subjects per cohort, and an in-depth analysis of the other IVIM parameters (i.e. D, D*) may reveal further differences between cohorts.Acknowledgements
This work was backed by the German Professional Association for Statutory Accident Insurance and Prevention in the Foodstuffs Industry and the Catering Trade (BGN) and the Competence Center for Interdisciplinary Prevention (KIP) at the Friedrich Schiller University Jena .References
1. Hartvigsen J, Hancock MJ, Kongsted A, Louw Q, Ferreira ML, Genevay S, et al. What low back pain is and why we need to pay attention. Lancet Lond Engl. 2018 Jun 9;391(10137):2356–67.
2. Wattananon P, Silfies SP, Tretriluxana J, Jalayondeja W. Lumbar Multifidus and Erector Spinae Muscle Synergies in Patients with Nonspecific Low Back Pain During Prone Hip Extension: A Cross-sectional Study. PM R. 2019 Jul;11(7):694–702.
3. Gordon R, Bloxham S. A Systematic Review of the Effects of Exercise and Physical Activity on Non-Specific Chronic Low Back Pain. Healthc Basel Switz. 2016 Apr 25;4(2):E22.
4. Varghese J, Scandling D, Ono C, Aneja A, Kay WA, Raman SV, et al. Exercise induced changes in T1, T2 relaxation times and blood flow in the lower extremities in healthy subjects. J Cardiovasc Magn Reson. 2013 Jan 30;15(Suppl 1):P108.
5. Huang YL, Zhou JL, Jiang YM, Zhang ZG, Zhao W, Han D, et al. Assessment of lumbar paraspinal muscle activation using fMRI BOLD imaging and T2 mapping. Quant Imaging Med Surg. 2020 Jan;10(1):106–15.
6. Fram EK, Herfkens RJ, Johnson GA, Glover GH, Karis JP, Shimakawa A, et al. Rapid calculation of T1 using variable flip angle gradient refocused imaging. Magn Reson Imaging. 1987;5(3):201–8.
7. Sacolick LI, Wiesinger F, Hancu I, Vogel MW. B1 mapping by Bloch-Siegert shift. Magn Reson Med. 2010 May;63(5):1315–22.
8. Dixon WT. Simple proton spectroscopic imaging. Radiology. 1984 Oct;153(1):189–94.
9. Le Bihan D, Breton E, Lallemand D, Aubin ML, Vignaud J, Laval-Jeantet M. Separation of diffusion and perfusion in intravoxel incoherent motion MR imaging. Radiology. 1988 Aug;168(2):497–505.
10. Kruschke JK. Bayesian estimation supersedes the t test. J Exp Psychol Gen. 2013 May;142(2):573–603.
11. Sun H, Xu MT, Wang XQ, Wang MH, Wang BH, Wang FZ, et al. Comparison Thigh Skeletal Muscles between Snowboarding Halfpipe Athletes and Healthy Volunteers Using Quantitative Multi-Parameter Magnetic Resonance Imaging at Rest. Chin Med J (Engl). 2018 May 5;131(9):1045–50.
12. Reid RW, Foley JM, Jayaraman RC, Prior BM, Meyer RA. Effect of aerobic capacity on the T2 increase in exercised skeletal muscle. J Appl Physiol Bethesda Md 1985. 2001 Mar;90(3):897–902.
13. Kuno S, Katsuta S, Inouye T, Anno I, Matsumoto K, Akisada M. Relationship between MR relaxation time and muscle fiber composition. Radiology. 1988 Nov;169(2):567–8.
14. Le Rumeur E, Carré F, Bernard AM, Bansard JY, Rochcongar P, De Certaines JD. Multiparametric classification of muscle T1 and T2 relaxation times determined by magnetic resonance imaging. The effects of dynamic exercise in trained and untrained subjects. Br J Radiol. 1994 Feb;67(794):150–6.
15. Flück M, Kramer M, Fitze DP, Kasper S, Franchi MV, Valdivieso P. Cellular Aspects of Muscle Specialization Demonstrate Genotype - Phenotype Interaction Effects in Athletes. Front Physiol. 2019;10:526.
16. Shaw CS, Clark J, Wagenmakers AJM. The effect of exercise and nutrition on intramuscular fat metabolism and insulin sensitivity. Annu Rev Nutr. 2010 Aug 21;30:13–34.
17. Emanuelsson EB, Berry DB, Reitzner SM, Arif M, Mardinoglu A, Gustafsson T, et al. MRI characterization of skeletal muscle size and fatty infiltration in long‐term trained and untrained individuals. Physiol Rep. 2022 Jul 19;10(14):e15398.
18. Delp MD. Differential effects of training on the control of skeletal muscle perfusion. Med Sci Sports Exerc. 1998 Mar;30(3):361–74.
Figures