4213
Exercise-induced changes of macromolecular content in calf muscles quantified with T1ρ magnetic resonance imaging1Central Research Institute, Shanghai United Imaging Healthcare Co., Ltd, Shanghai, China, 2Vascular and Physiologic Imaging Research (VPIR) Lab, School of Biomedical Engineering, ShanghaiTech University, Shanghai, China, 3School of Biomedical Engineering, ShanghaiTech University, Shanghai, China, 4Shanghai Clinical Research and Trial Center, Shanghai, China
Synopsis
Keywords: Muscle, Quantitative Imaging
Exercise could induce changes in skeletal muscle’s macromolecular content. In this study, we used an exercise-then-imaging protocol to verify and characterize such phenomenon for calf muscles of healthy subject. A T1ρ mapping technique was used for imaging calf muscles before and after planter flexion of different loads. It was found that post-exercise increases in T1ρ values of gastrocnemius and peroneus longus at exercise load of 16 and of 20 lbs were significantly higher than that of 8 lbs. In conclusion, T1ρ is sensitive to changes of macromolecular content in calf muscles induced by plantar flexion of moderate or high intensity.
Introduction
Assessment of lower extremities has been mostly focused on damage of knee cartilage due to aging and improper exercise 1, and promising MRI methods used for the purpose include T2, T2* and T1ρ mappings 2,3. However, the other important component of lower extremity that could affect the performance of walking or running are calf muscles. Of particular interest is the exercise-induced hyperemic response of the muscles. Besides the measurement of post-exercise muscle perfusion4, macromolecular content in the exercising muscles could also be perturbed and potentially reflects muscle status or performance 5. In this study, we performed T1ρ mapping of calf muscles before and after plantar flexion of different loads for a group of healthy subjects, with the aim of eliciting the relationship between exercise intensity and muscle T1ρ values.Method
Three healthy subjects (3 males, age 26.0±5.0 years) participated in this IRB-approved study. Informed consent was obtained from each subject prior to the experiment. On a 3T MR scanner (uMR890, United Imaging Healthcare, China), the subject was in supine and head-first position, with one calf through a 24-channel knee coil. The same leg was positioned so that the foot can push a MR-compatible pedal for loaded plantar flexion. In this experiment, each subject performed multiple sessions of plantar flexion with different loads, including 8, 12, 16 and 20 lbs, each session lasting 3 minutes with a frequency of 1 Hz. Between every two exercises, there was a gap of 2 minutes, when T1ρ imaging was performed. T1ρ-weighted images covering an axial calf slice was acquired based on a 2D gradient recalled echo sequence with the following parameter values: field of view (FOV) 200×200 mm, matrix 144×144, TR 4.01 ms, TE 2.05 ms, bandwidth 1200 Hz/Pixel, 4 spin-lock times (TSLs): 2, 16, 30, 50 ms, spin-lock frequency 500 Hz, flip angle 35⁰, acquisition time 10 s. In post-processing, an exponential function was fitted to the signal vs. TSL curve of each voxel to estimate T1ρ of the voxel. In one T1ρ-weighted image, an experienced user manually drew region of interest (ROI) for peroneus longus (PL), medial gastrocnemius (MG) and lateral gastrocnemius (LG). In the ROIs, major blood vessels and intermuscular fascia were excluded. Besides gastrocnemius, we chose PL as this muscle is often used to pull the foot back to its original position. The ROIs were then applied to the T1ρ maps to obtain the averaged T1ρ value for each muscle group. As some subject used MG for plantar flexion while others used LG (probably due to different movement postures), we reported the side with larger change for each subject and denoted it as G. For each muscle group (PL or G), we computed the mean and standard deviation (STD) for the averaged T1ρ values of all the subjects.Result
Figure 1 shows representative maps of T1ρ obtained after plantar flexion of various loads from one subject. Visual comparison of the maps reveals some increase of T1ρ in all the muscles, particularly PL for this subject. Table 1 summarizes the mean and STD of T1ρ values for PL and for G across all the plantar-flexion loads. There were trends of increase in T1ρ of both PL and G as exercise load increased particularly at the load of 20 lbs, but none of the changes was statistically significant. Figure 2 shows the post-exercise percentage increases of T1ρ as compared to their baseline levels. With plantar flexion of 20 lbs, PL and G’s T1ρ increased by 14.4%±4.5% and 12.9±3.6%, respectively. When combining the two muscles together for analysis, both the percentage increase at 20 lbs and at 16 lbs were significantly higher than that at 8 lbs (P value 0.016 and 0.028, respectively).Discussion
In this study, we found that intensive exercise with high load (16 or 20 lbs for plantar flexion) induced significant increase in T1ρ value of calf muscles. Under strenuous exercise, certainly, there are large amounts of macromolecular components that accumulate in the leg muscles. Such changes with muscle T1ρ were very likely due to the excessive accumulation of macromolecules in the extracellular matrices of muscle cells, such as glycosaminoglycan 6. The value of the proposed muscle T1ρ measurement is to be explored with more investigations. Of particular importance is how this relatively new MRI biomarker could complement with other parameters such as T1 and T2 for more comprehensive assessment of exercise response of muscles. Nevertheless, muscle T1ρ is indeed a potential biomarker sensitive to macromolecular content of skeletal muscles.Acknowledgements
No acknowlegement foundReferences
1. Scarborough N. Number of people who went jogging or running within the last 12 months in the United States from spring 2008 to spring 2017 (in millions). Statista-The Statistics Portal. 2017;
2. Mosher TJ, Liu Y, Torok CM. Functional cartilage MRI T2 mapping: evaluating the effect of age and training on knee cartilage response to running. Osteoarthritis and cartilage. 2010;18(3):358-364.
3. Hesper T, Miese FR, Hosalkar HS, et al. Quantitative T2* assessment of knee joint cartilage after running a marathon. European journal of radiology. 2015;84(2):284-289.
4. Zhang JL, Layec G, Hanrahan C, et al. Exercise-induced calf muscle hyperemia: quantitative mapping with low-dose dynamic contrast enhanced magnetic resonance imaging. American Journal of Physiology-Heart and Circulatory Physiology. 2019;316(1):H201-H211.
5. Noehren B, Hardy PA, Andersen A, et al. T1ρ imaging as a non‐invasive assessment of collagen remodelling and organization in human skeletal muscle after ligamentous injury. The Journal of Physiology. 2021;599(23):5229-5242.
6. Menon RG, Raghavan P, Regatte RR. Quantifying muscle glycosaminoglycan levels in patients with post-stroke muscle stiffness using T1ρ MRI. Scientific reports. 2019;9(1):1-8.
Figures
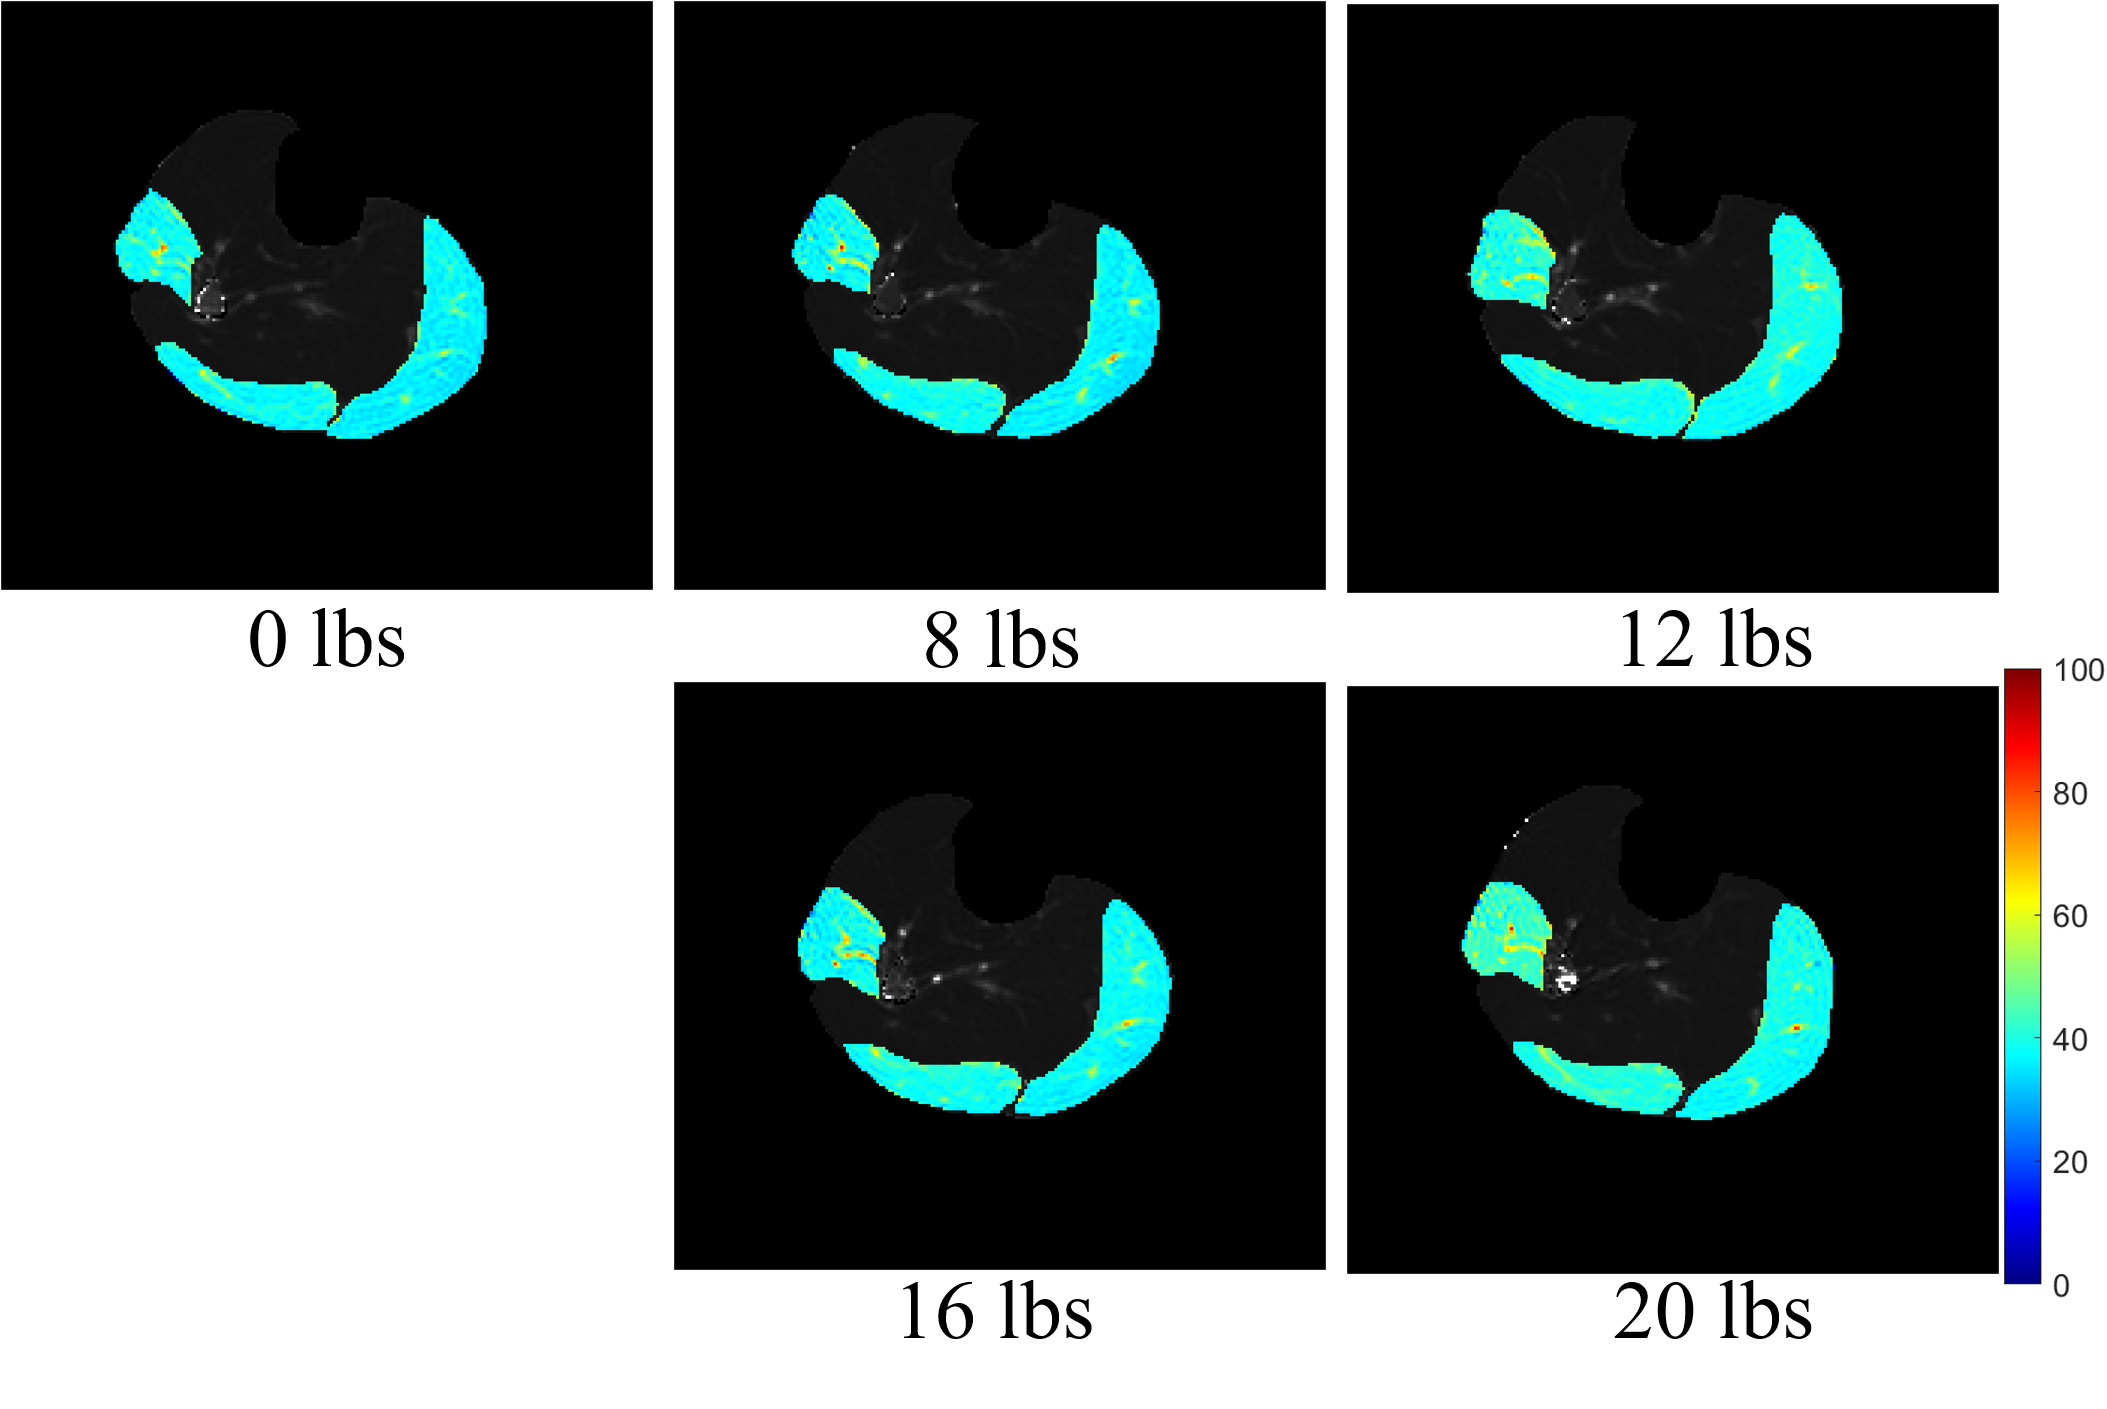
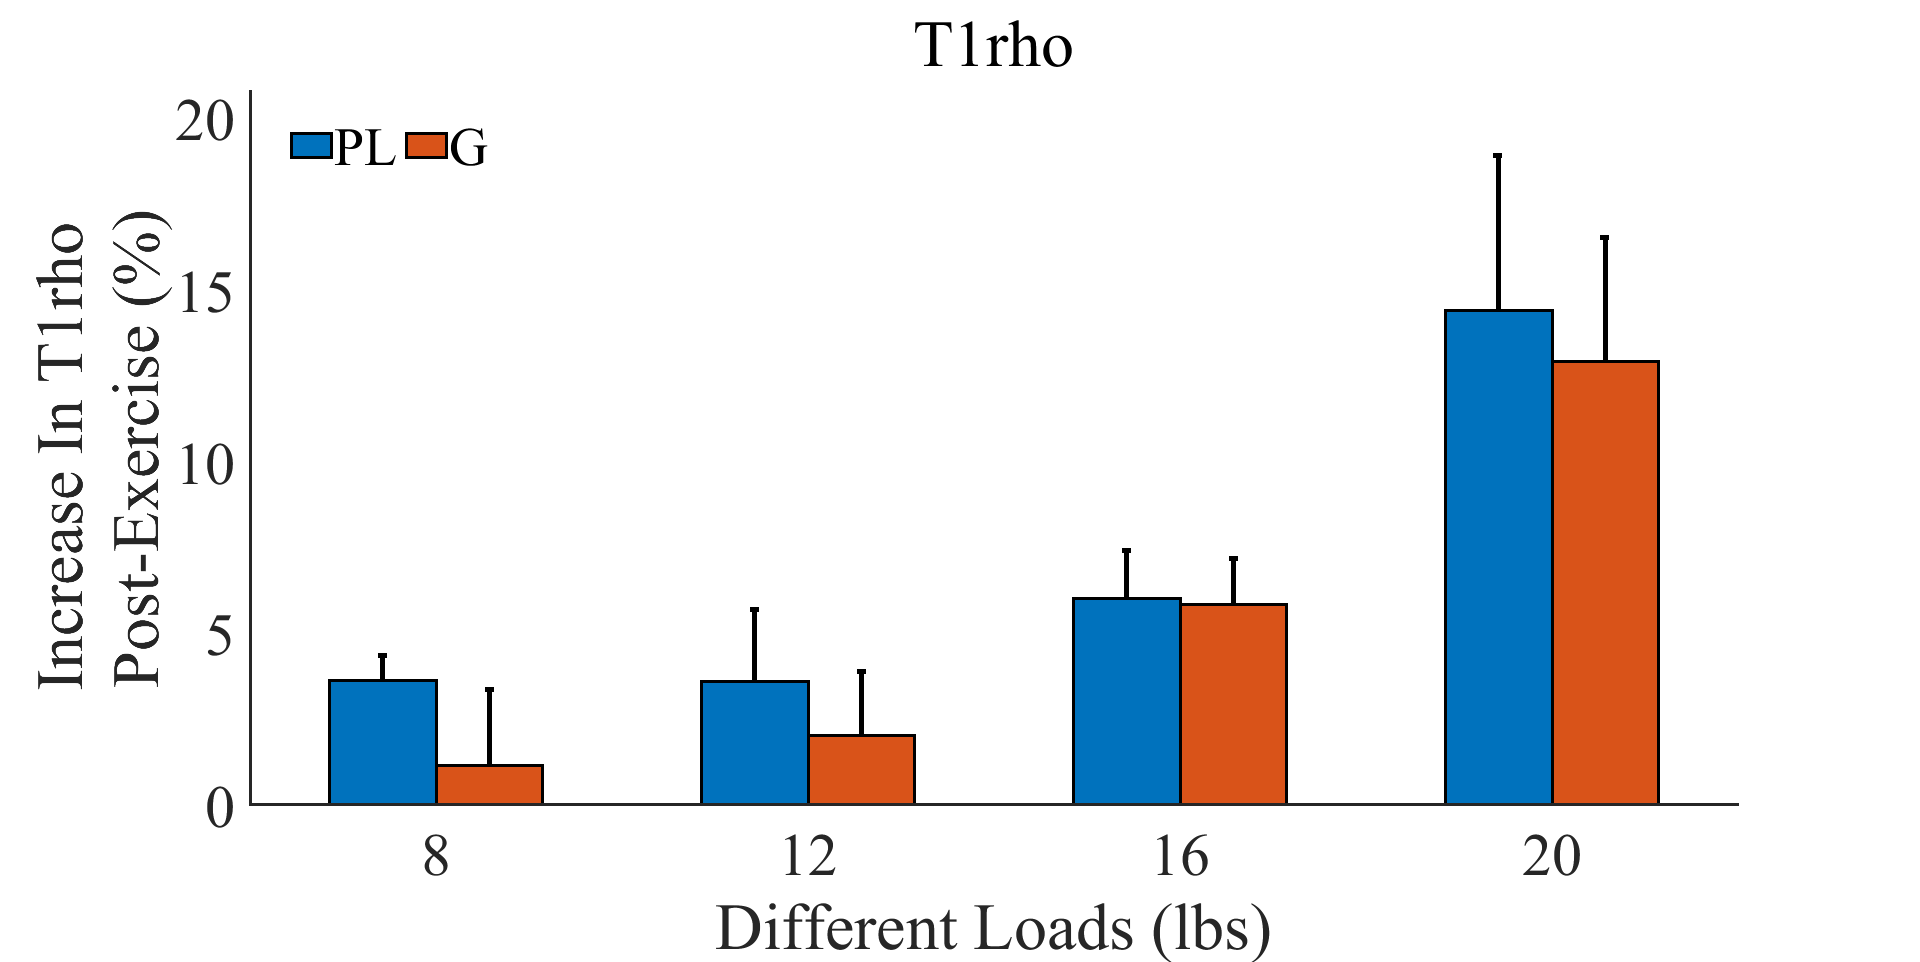
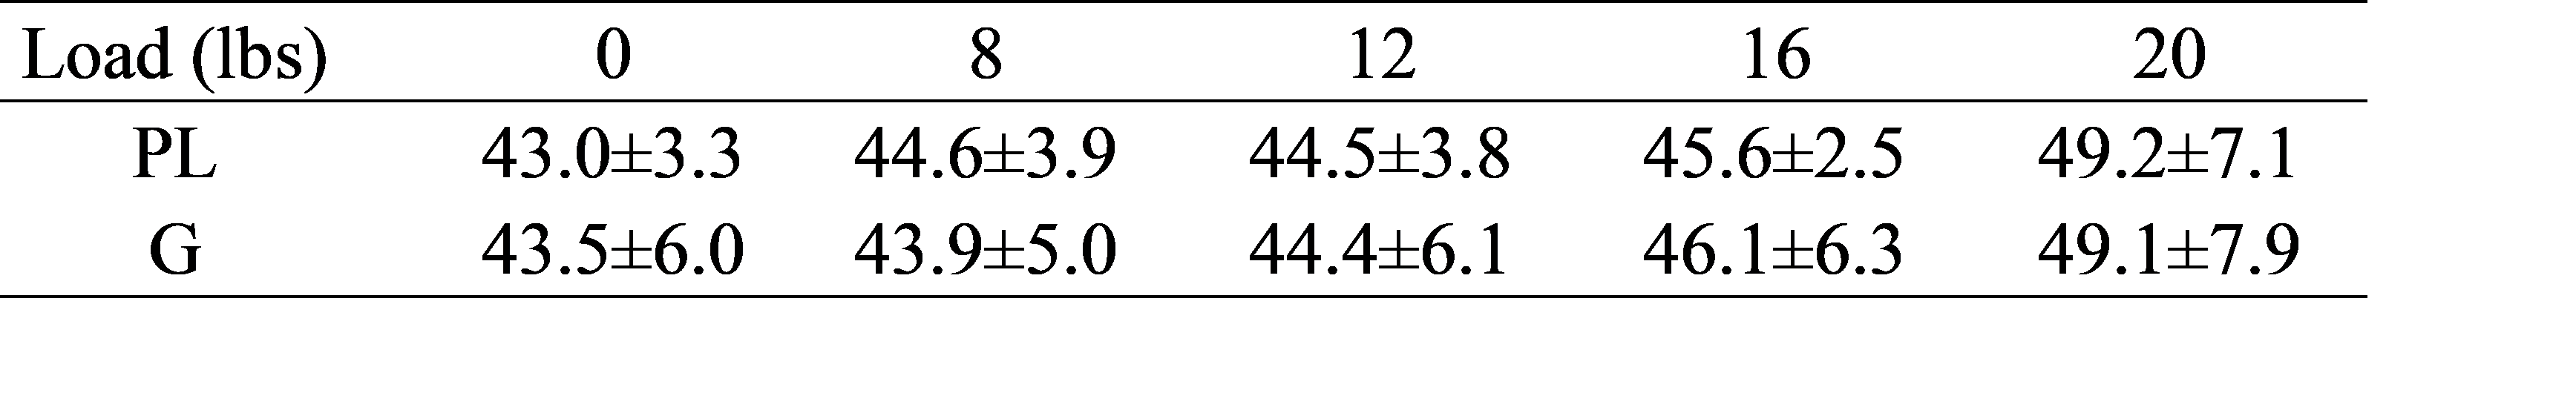
Table 1 Muscle T1ρ values (ms) after plantar flexion of different loads. PL - peroneus longus; G – gastrocnemius.