4209
Assessment of Charcot-Marie-Tooth disease severity using quantitative T2 and fat fraction biomarkers1Department of Biomedical Engineering, Tel Aviv University, Tel Aviv, Israel, 2Center of AI and Data Science (TAD), Tel Aviv University, Tel Aviv, Israel, 3CNRS, CRMBM, Aix Marseille University, Marseille, France, 4Sagol School of Neuroscience, Tel Aviv University, Tel Aviv, Israel, 5Center for Advanced Imaging Innovation and Research (CAI2R), New-York University Langone Medical Center, New York, NY, United States
Synopsis
Keywords: Muscle, Muscle, Muscular disorder; Neuropathy; Fat water separation
Charcot-Marie-Tooth (CMT) is the most prevalent inherited neurological disease, commonly presenting in the first or second decade of life. Notwithstanding the ongoing advancement of non-invasive imaging, effective and sensitive tools for monitoring CMT and other neuromuscular conditions are lacking. Here we investigated the utility of the extended echo-modulation-curve (EMC) algorithm, for precise mapping of T2 relaxation times and fat fraction (FF) in CMT patients. Results indicate that quantitative T2 and FF biomarkers correlate with clinical scores. These can be useful for precise and objective monitoring of microstructural processes occurring in CMT.
Introduction
Charcot-Marie-Tooth (CMT) disease is a heterogeneous group of genetic disorders phenotypically presented as a chronic progressive neuropathy affecting both motor and sensory nerves1. The hallmark of CMT is replacement of muscle by adipose tissue2 (see Fig 1). To date, CMT severity is stratified using the Charcot-Marie-Tooth neuropathy score (CMTNS), a measure of motor and sensory impairment in genetic neuropathies3. Another score, commonly used in clinical trials, is the Overall Neuropathy Limitation Scale (ONLS)4 estimating limitations in everyday activities.Notwithstanding their widespread use, the above clinical scores provide a relatively coarse scale which is, moreover, subjective and observer-dependent. Quantitative MRI (qMRI) biomarkers like Fat Fraction (FF)5–10, viable muscle volume9, tissue T26,9,11 and T2 of the water component8,12 have also been suggested for assessing muscle pathology and have been shown to correlate with the appearance and progression of symptoms in neuromuscular conditions5–7,9,10.
In this study, we investigated the ability of qMRI biomarkers for predicting clinical severity scores of CMT, aiming to examine their utility for monitoring disease state and progression.
Methods
Population: Seventeen CMT patients (35 ± 9 years old) were recruited for the study after signing informed consent, approved by the local ethics committee (Comité de Protection des Personnes Sud Méditerranée I).Clinical assessment of disease severity: All subjects underwent clinical assessment of disease severity including (i) local estimation of muscle strength using the Medical Research Council’s scale13 for the hamstring, quadriceps, dorsiflexion and plantar flexion; and (ii) estimation of the CMTNS3 and ONLSI4 systemic scores.
MRI scans were performed on a whole-body 1.5 Tesla Siemens scanner at the Centre de Résonance Magnétique Biologique et Médicale (CRMBM) in Marseille, France, using an 8-channel receiver coil placed on the non-dominant leg of each patient. Quantitative T2-mapping was performed using a 2D multi-echo spin-echo (MESE) protocol [TR = 2500 ms, echo spacing (TE) = 8.7 ms, echo train length = 16, acquisition bandwidth = 454 Hz/pixel, matrix size 128x128, FOV 220x220 mm, slice thickness =10 mm, slice-gap = 20 mm, Nslices = 10 in the thigh and 10 in the calf, and ×2 GRAPPA acceleration].
MRI data processing: T2 maps were generated using the EMC algorithm14,15. T2 of the water component and the FF were calculated using the extended (two-component) EMC algorithm16. Representative maps are shown in Fig 2. Segmentation of muscles’ regions-of-interest (ROIs) was performed manually for each subject and slice based on the T1-weighed images.
Extraction of quantitative features: Quantitative biomarkers were calculated for each ROI. These included the mean, standard deviation (SD), and 90 percentiles of the FF, the tissue T2, and the T2 of the water component only. Viable muscle volume was also estimated by multiplying the muscle volume by the water fraction (1-FF).
Statistical analysis: Statistical analysis was performed using MATLAB R2020b.
Pairwise-correlation was first performed between all qMRI biomarkers in order to identify linearly independent biomarkers and select a subset of representative biomarkers. Then, two statistical analyses were performed on this subset:
(i) Spearmen correlation between the qMRI biomarkers and normalized clinical scores (i.e., divided by muscle volume and transformed to logarithmic scale). Multiple comparison correction was performed using the Benjamini-Hochberg method (BH) 17, with P< 0.05 indicating statistical significance.
(ii) A linear regression model was used to determine the association between qMRI biomarkers and each clinical score. Cross-validation was performed to assess the models’ accuracy using leave-three-out scheme, repeated for all possible permutations (680 times). Root mean squared error (RMSE) was calculated for each iteration. Lastly, the model’s accuracy and precision were estimated based on the mean and SD of the RMSE respectively.
Results
Pairwise-correlation between the qMRI biomarkers is shown in Fig 3. Subset of biomarkers was selected by removing markers that strongly corelated (R>0.93) with other markers. The remining set included six biomarkers: FF mean and SD, T2 SD, mean and SD of the water component T2, and viable muscle volume.Correlation between these biomarkers and clinical scores are conferred in Table 1. Significant correlations were found to the systemic ONLS score, the quadriceps strength, and to the combined muscle strength. While most biomarkers did not correlate to the clinical scores, their combination in a multiparametric logistic regression model yielded accuracy of ≤ 0.7%, and precision ≤7.52% across all clinical scores, meaning that these scores can be reliably predicted using this model (see Table 2).
Discussion
The extended EMC algorithm offers accurate and precise mapping of tissue T2, FF, and T2 of water component values with robustness to variations in T1 relaxation times, magnetization transfer, and B0, B1+ and B1- field inhomogeneities.Our results suggest that a multiparametric set of qMRI biomarkers can be used to probe pathologic tissue changes, and for predicting clinical CMT scores in an accurate and objective manner. These biomarkers can also be useful for studies geared toward a better understanding of CMT progression and may facilitate early detection, and quantification of therapeutic treatments.
Acknowledgements
AFM-Telethon Grant #23604 for fundamental research and physiopathology of diseases of the neuromuscular system.References
1. Szigeti K, Lupski JR. Charcot-Marie-Tooth disease. Eur J Hum Genet. 2009;17(6):703-710. doi:10.1038/ejhg.2009.31
2. Carlier PG, Azzabou N, de Sousa PL, et al. Skeletal muscle quantitative nuclear magnetic resonance imaging follow-up of adult Pompe patients. J Inherit Metab Dis. 2015;38(3):565-572. doi:10.1007/s10545-015-9825-9
3. Shay ME, Blake J, Krajewsku K, et al. Reliability and validity of the CMT neuropathy score as a measure of disability [5]. Neurology. 2005;64:1209-1214. doi:10.1212/01.WNL.0000156517.00615.A3
4. Graham RC, Hughes RAC. A modified peripheral neuropathy scale: The Overall Neuropathy Limitations Scale. J Neurol Neurosurg Psychiatry. 2006;77(8):973-976. doi:10.1136/jnnp.2005.081547
5. Fischmann A, Hafner P, Gloor M, et al. Quantitative MRI and loss of free ambulation in Duchenne muscular dystrophy. J Neurol. 2013;260(4):969-974. doi:10.1007/s00415-012-6733-x
6. Barnard AM, Willcocks RJ, Finanger EL, et al. Skeletal muscle magnetic resonance biomarkers correlate with function and sentinel events in Duchenne muscular dystrophy. PLoS One. 2018;13(3):1-15. doi:10.1371/journal.pone.0194283
7. Gaeta M, Messina S, Mileto A, et al. Muscle fat-fraction and mapping in Duchenne muscular dystrophy: Evaluation of disease distribution and correlation with clinical assessments preliminary experience. Skeletal Radiol. 2012;41(8):955-961. doi:10.1007/s00256-011-1301-5
8. Marty B, Baudin PY, Reyngoudt H, et al. Simultaneous muscle water T2 and fat fraction mapping using transverse relaxometry with stimulated echo compensation. NMR Biomed. 2016;29(4):431-443. doi:10.1002/nbm.3459
9. Morrow JM, Sinclair CDJ, Fischmann A, et al. MRI biomarker assessment of neuromuscular disease progression: A prospective observational cohort study. Lancet Neurol. 2016;15(1):65-77. doi:10.1016/S1474-4422(15)00242-2
10. Michelle L, Mellion M, Per W, et al. Quantitative Muscle Analysis in FSHD Using Whole-Body Fat-Referenced MRI: Composite Scores for Longitudinal and Cross-Sectional Analysis.; 2022. doi:10.1212/WNL.0000000000200757
11. Thibaud JL, Monnet A, Bertoldi D, Barthélémy I, Blot S, Carlier PG. Characterization of dystrophic muscle in golden retriever muscular dystrophy dogs by nuclear magnetic resonance imaging. Neuromuscul Disord. 2007;17(7):575-584.
12. Hooijmans MT, Froeling M, Koeks Z, et al. Multi-parametric MR in Becker muscular dystrophy patients. NMR Biomed. 2020;33(11):1-15.
13. Paternostro-Sluga T, Grim-Stieger M, Posch M, et al. Reliability and validity of the Medical Research Council (MRC) scale and a modified scale for testing muscle strength in patients with radial palsy. J Rehabil Med. 2008;40(8):665-671. doi:10.2340/16501977-0235
14. Radunsky D, Stern N, Nassar J, Tsarfaty G, Blumenfeld-Katzir T, Ben-Eliezer N. Quantitative platform for accurate and reproducible assessment of transverse (T2) relaxation time. NMR Biomed. 2021;34(8):1-14.
15. Ben-Eliezer N, Sodickson DK, Block KT. Rapid and accurate T2 mapping from multi-spin-echo data using bloch-simulation-based reconstruction. Magn Reson Med. 2015;73(2):809-817.
16. Nassar J, Radunsky D, Omer N, Fur Y Le, Bendahan D, Ben-Eliezer N. Quantitative estimation of sub-voxel fat and water fractions based on two T2-component fitting in calf muscle. In: Proceedings of the 26th Annual Meeting of the Intr. Soc. Magn. Reson. Med.;. ; 2018:June 18-21.
17. Benjamini Y, Hochberg Y. Controlling the False Discovery Rate : A Practical and Powerful Approach to Multiple Testing. J R Stat Soc. 1995;57(1):289-300.
Figures
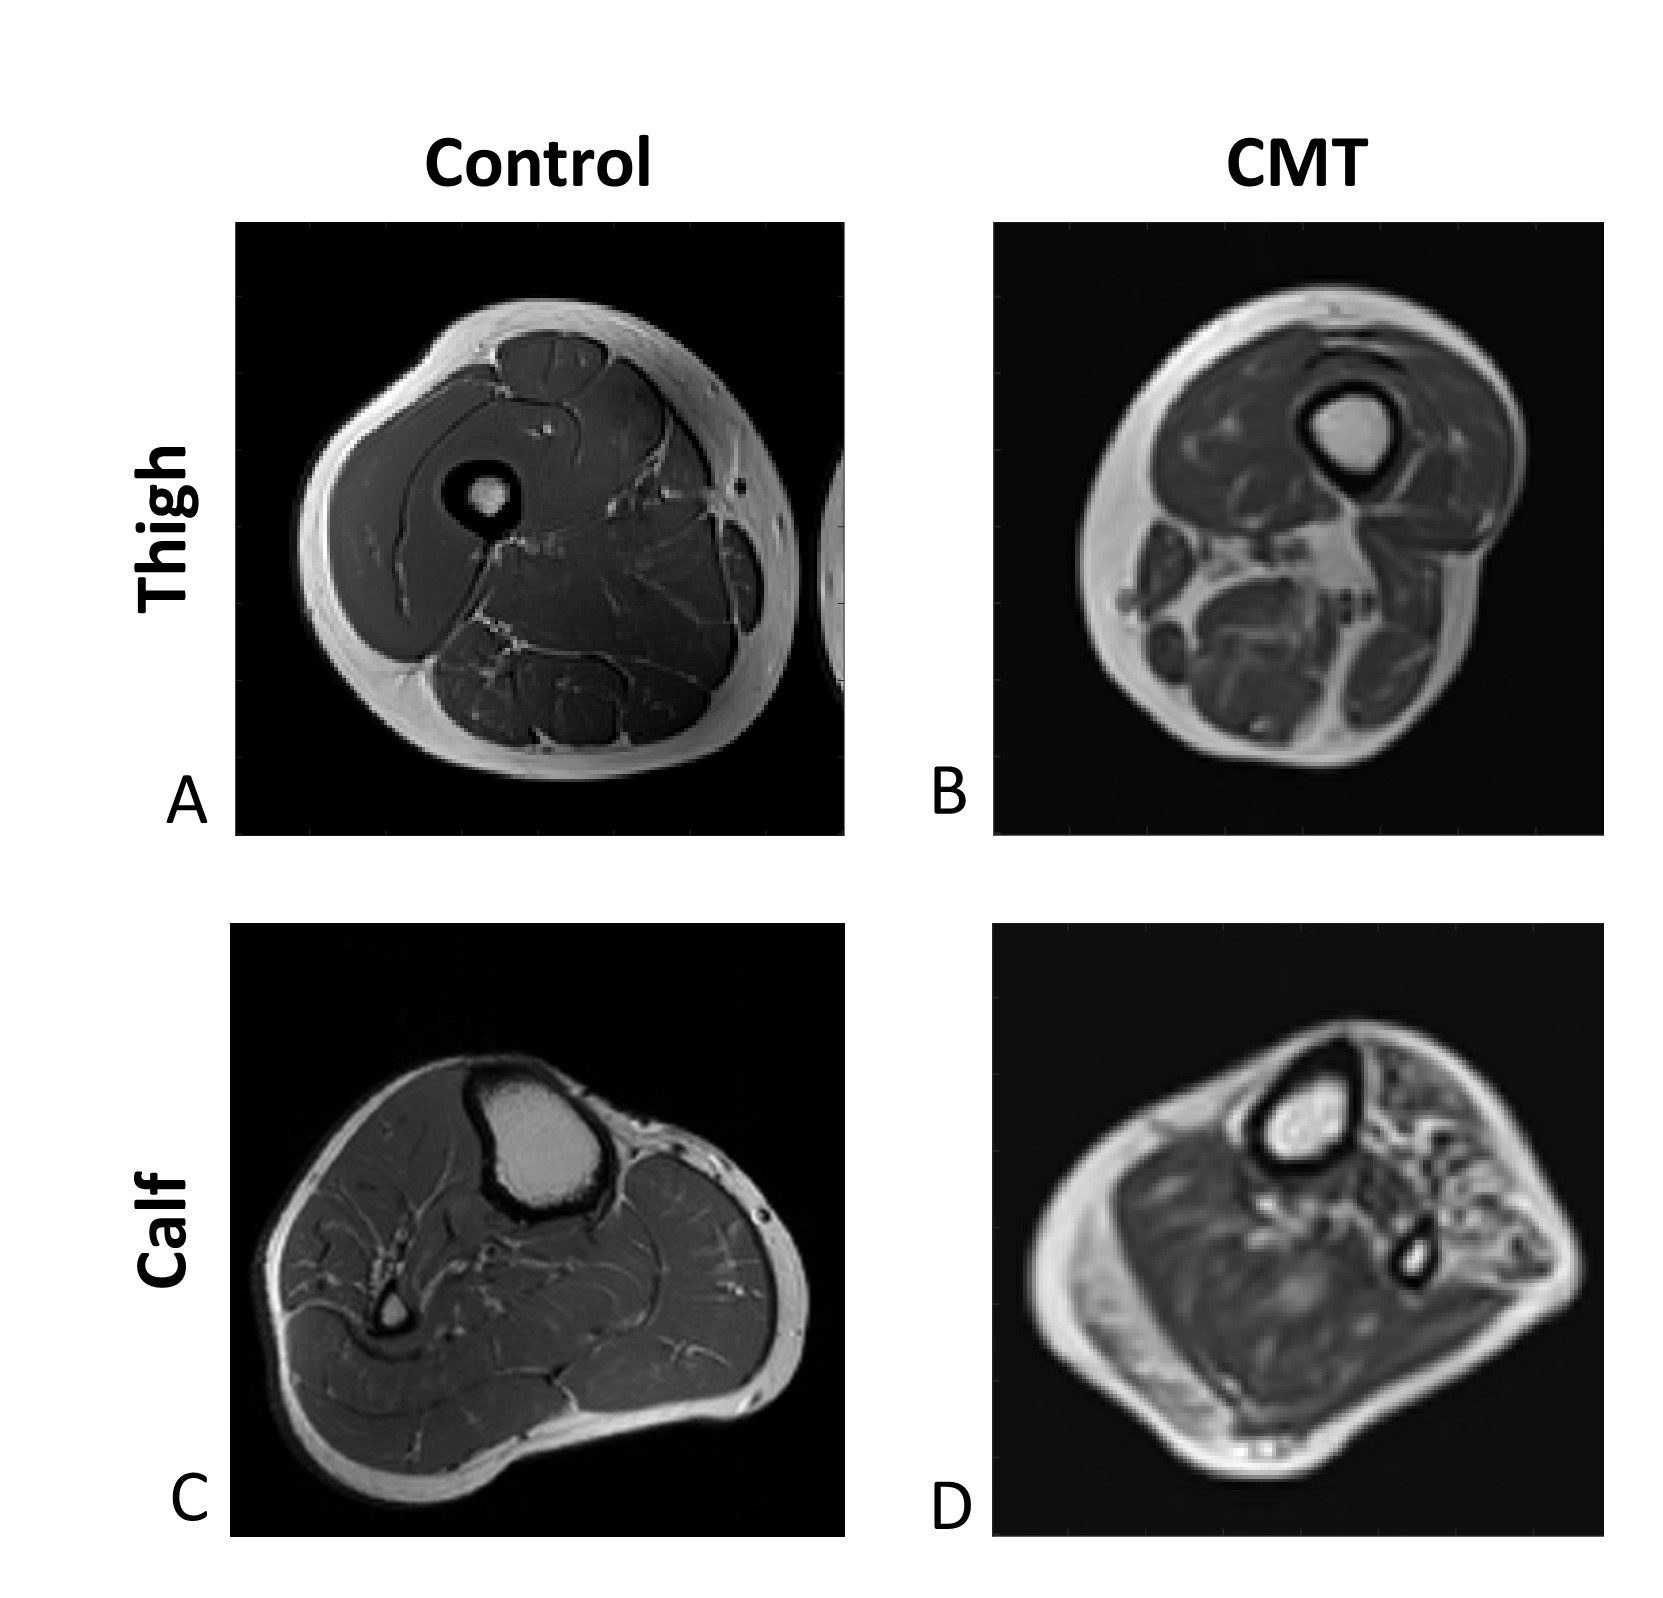
Figure 1: T2 weighted MRI images of a healthy subject and a CMT patient. A: Axial slice in the thigh of healthy control. B: Axial slice in the thigh of CMT patient. C: Axial slice in the calf of healthy control. D: Axial slice in the calf of CMT patient. Fat (which appears white in T2 contrast) is seen in the healthy control images mainly in the subcutaneous fat, in the CMT patient, fat infiltration to the muscle area is viable both in the calf and the thigh.
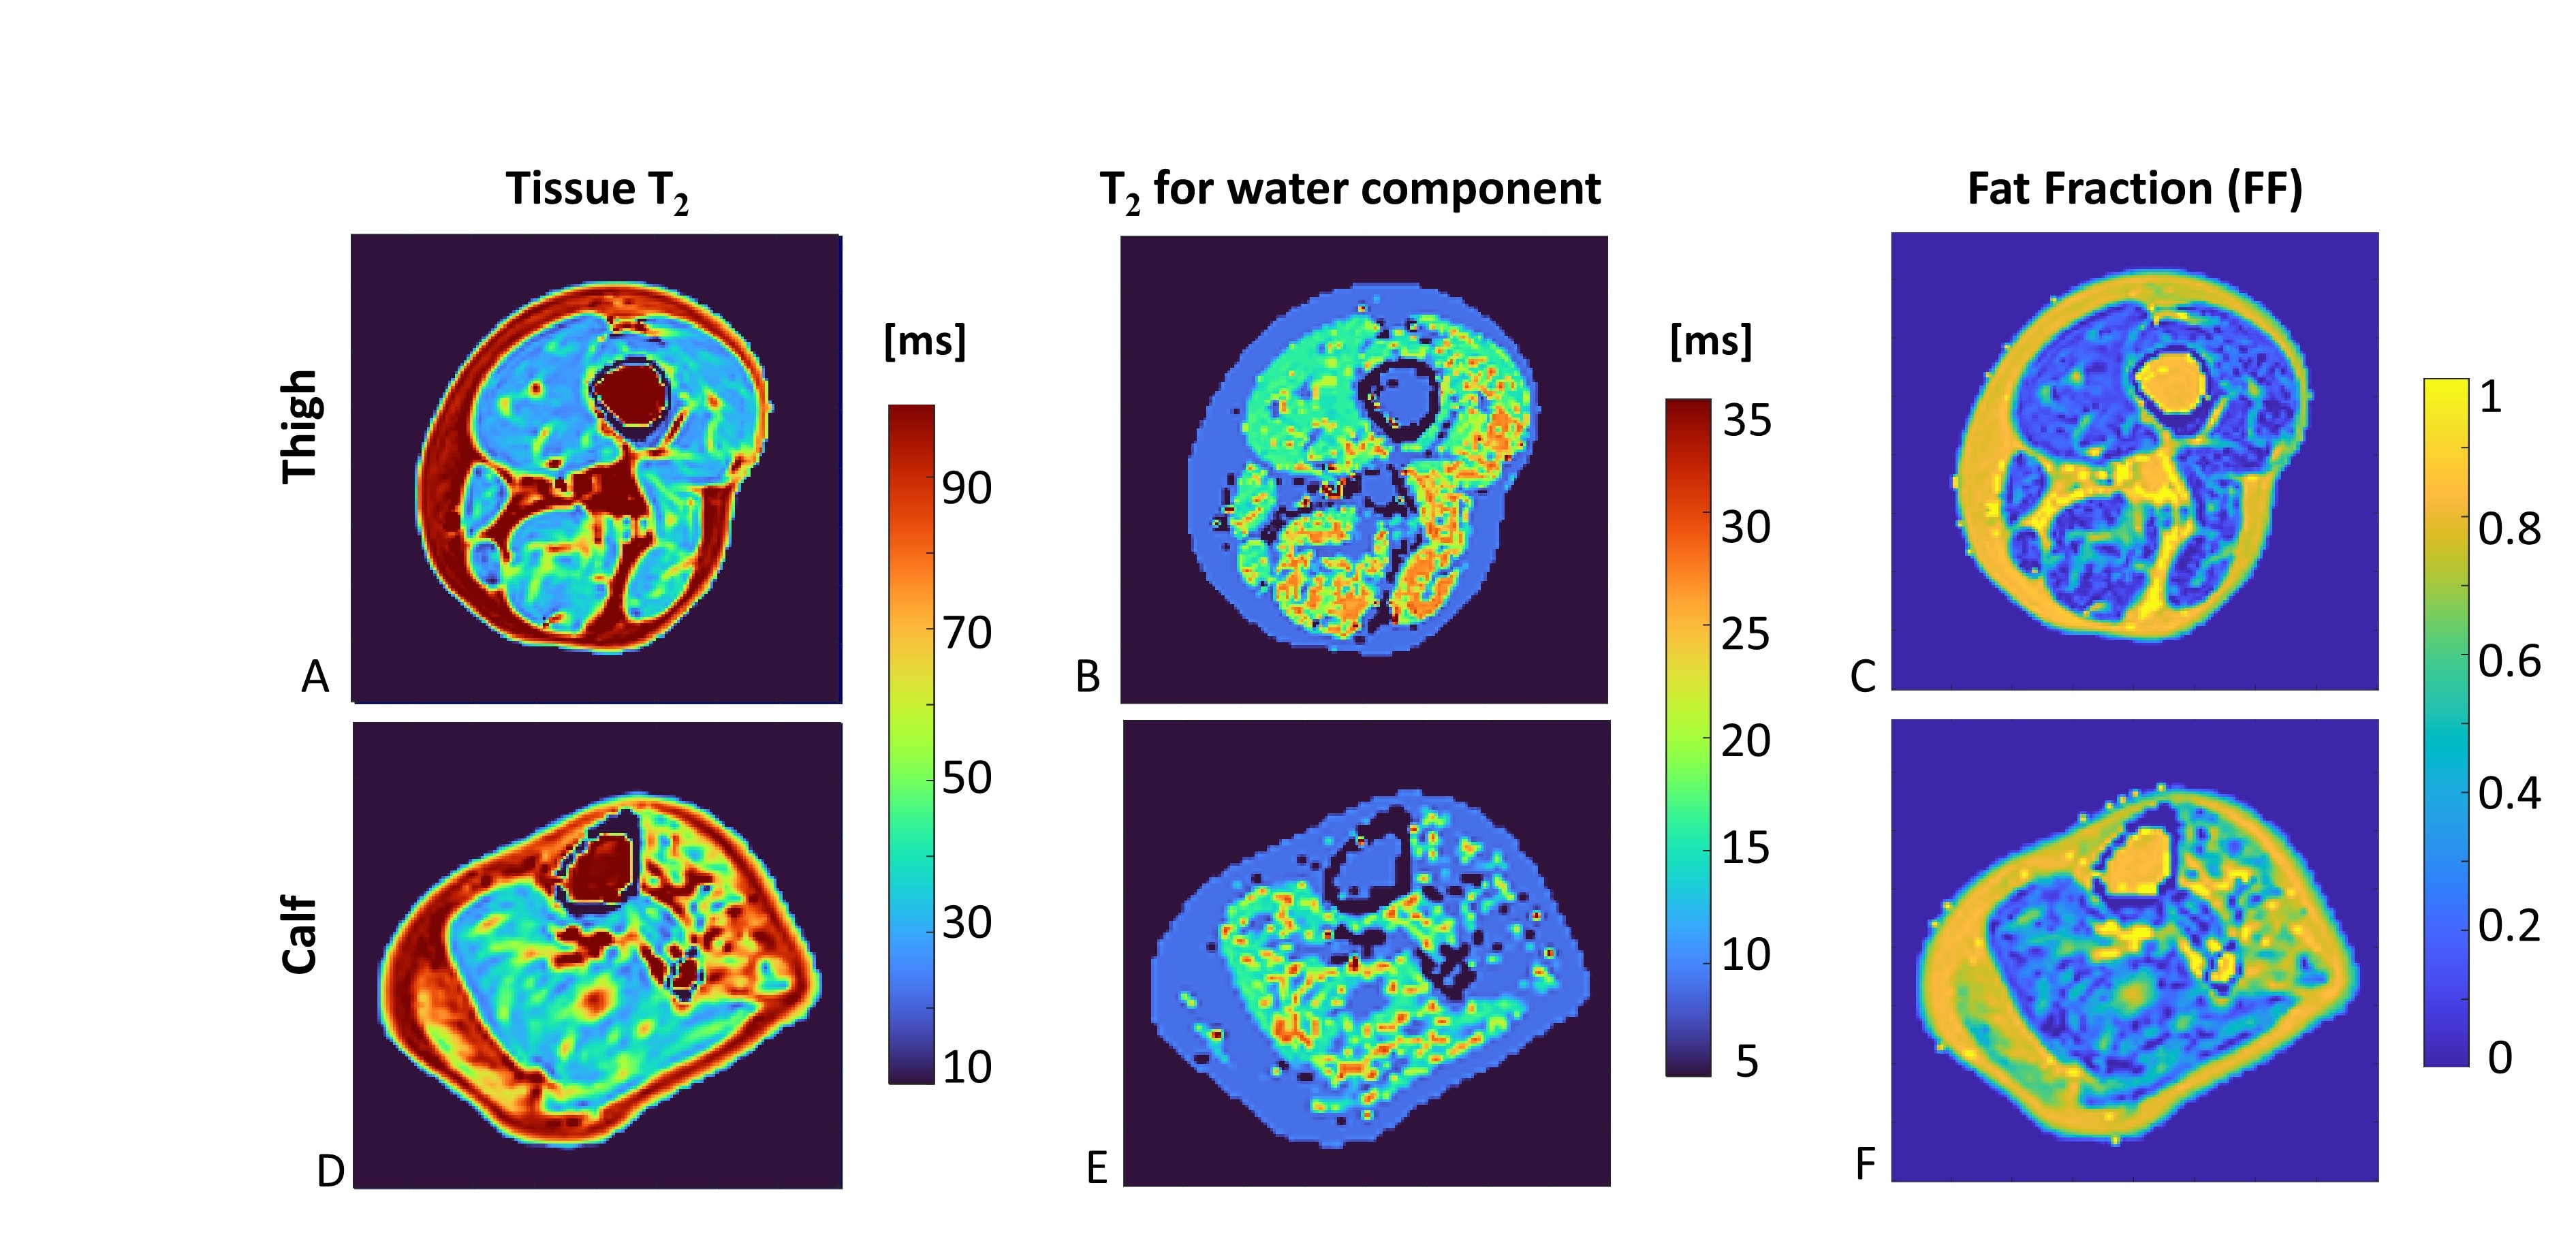
Figure 2: Representative axial slices of the thigh and calf in a CMT patient (same patient as in Fig1). A&D: standard T2 map w/o fat water separation; B&E: T2 map for water component only; C&F: Fat fraction map (1 – water fraction).
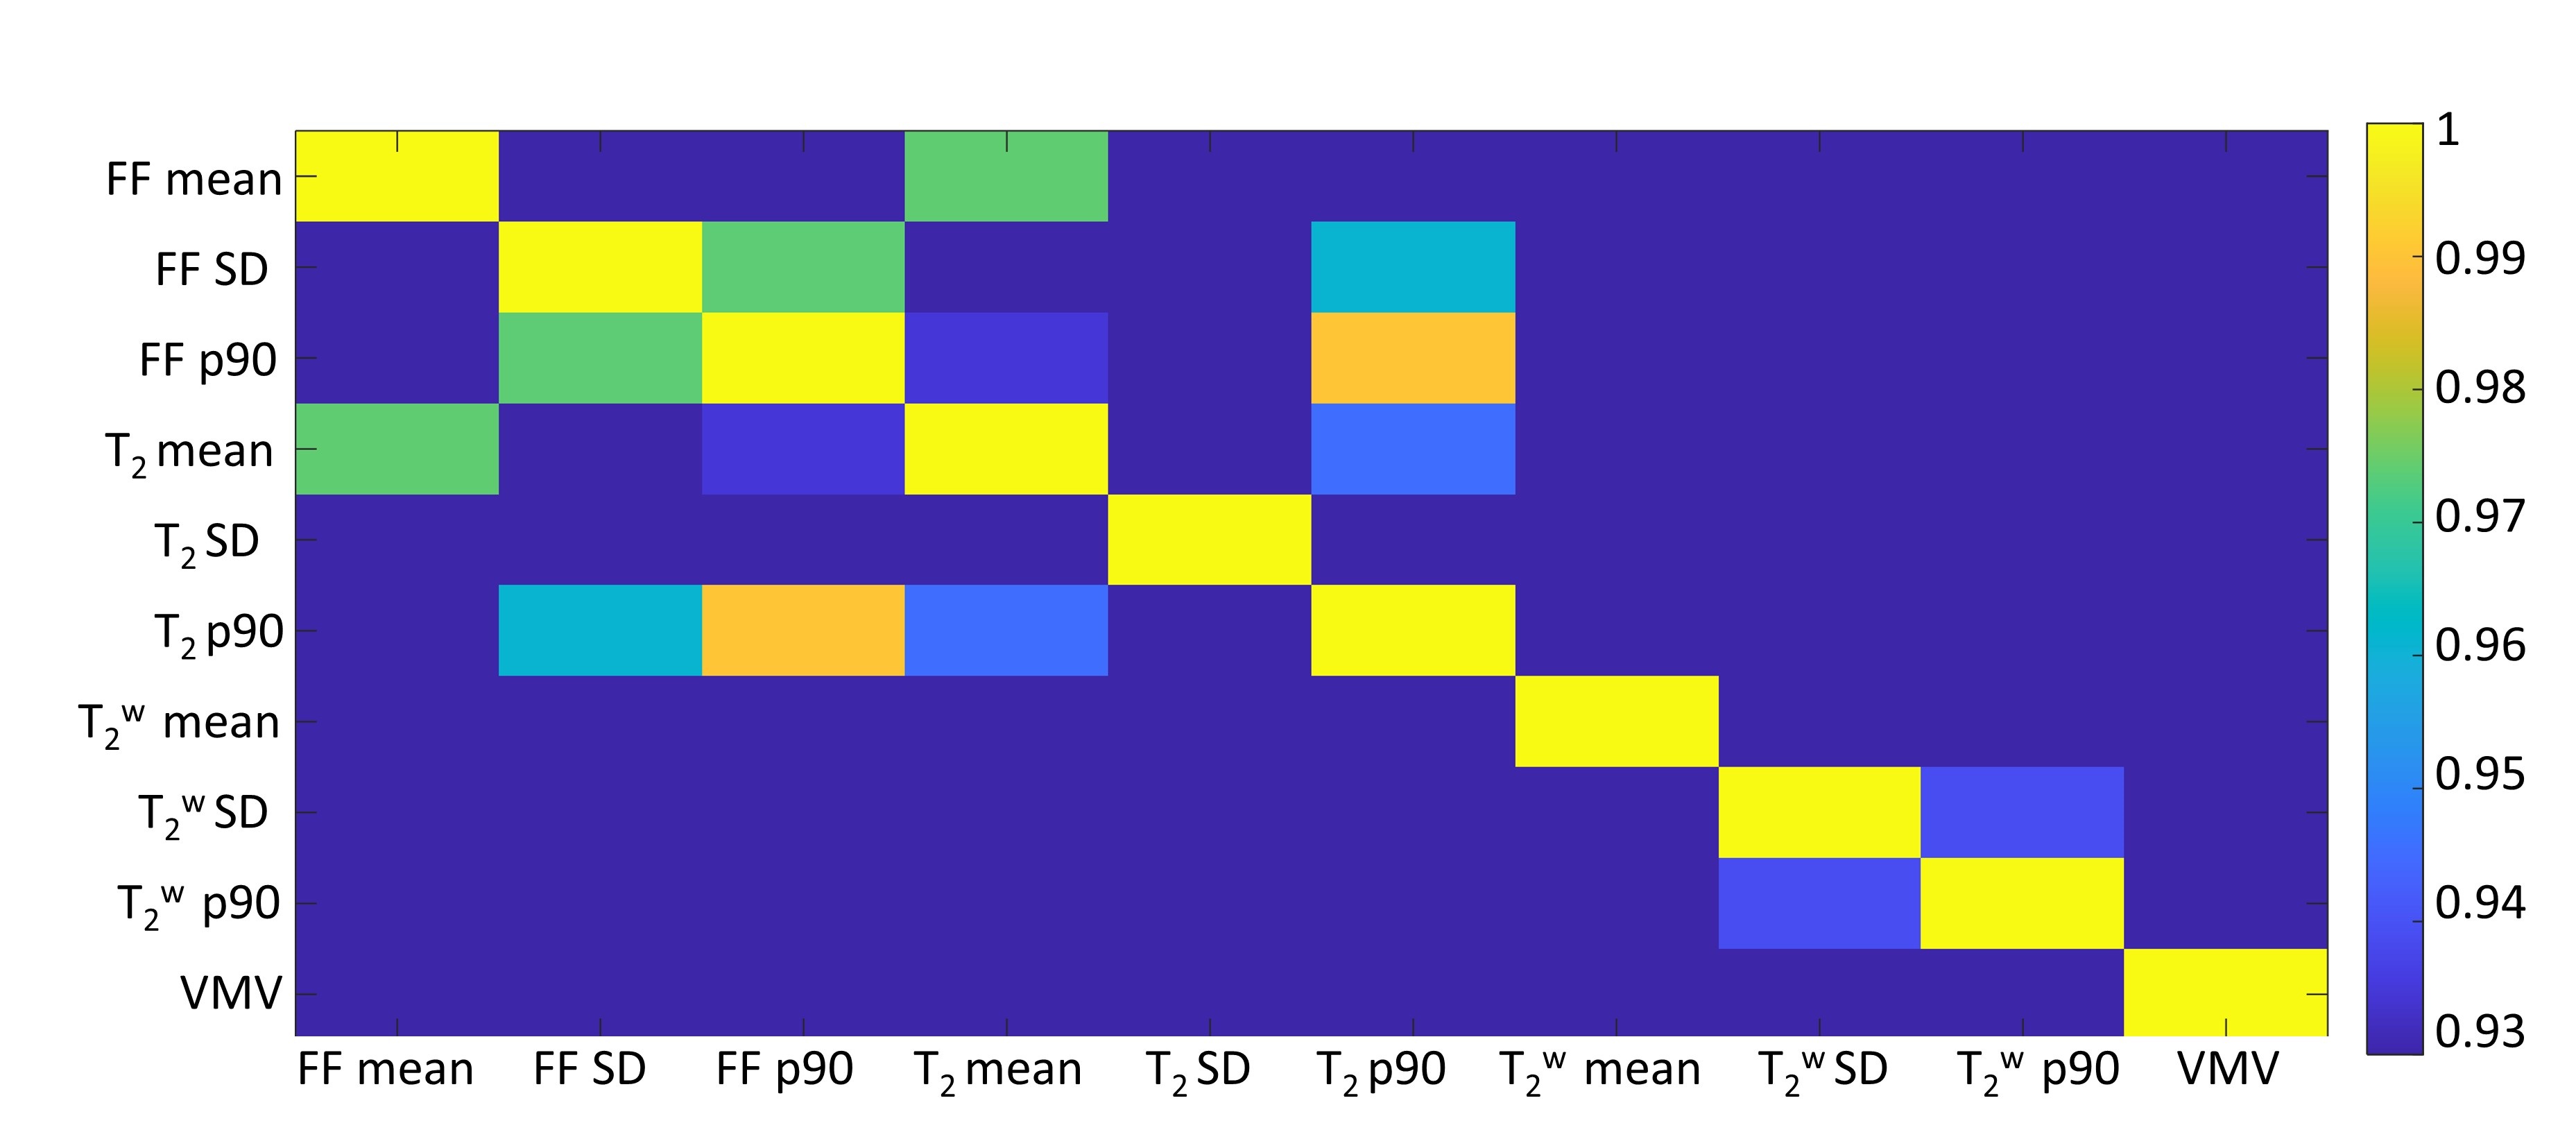
Figure 3: Absolut pairwise correlation map between the MRI biomarkers, calculated on an ROI of all the muscles in the scan. FF: Fat fraction; T2: standard T2 w/o fat water separation; T2w: T2 for water component only; VMV: viable muscle volume. Notice the correlation is shown only above 0.93.
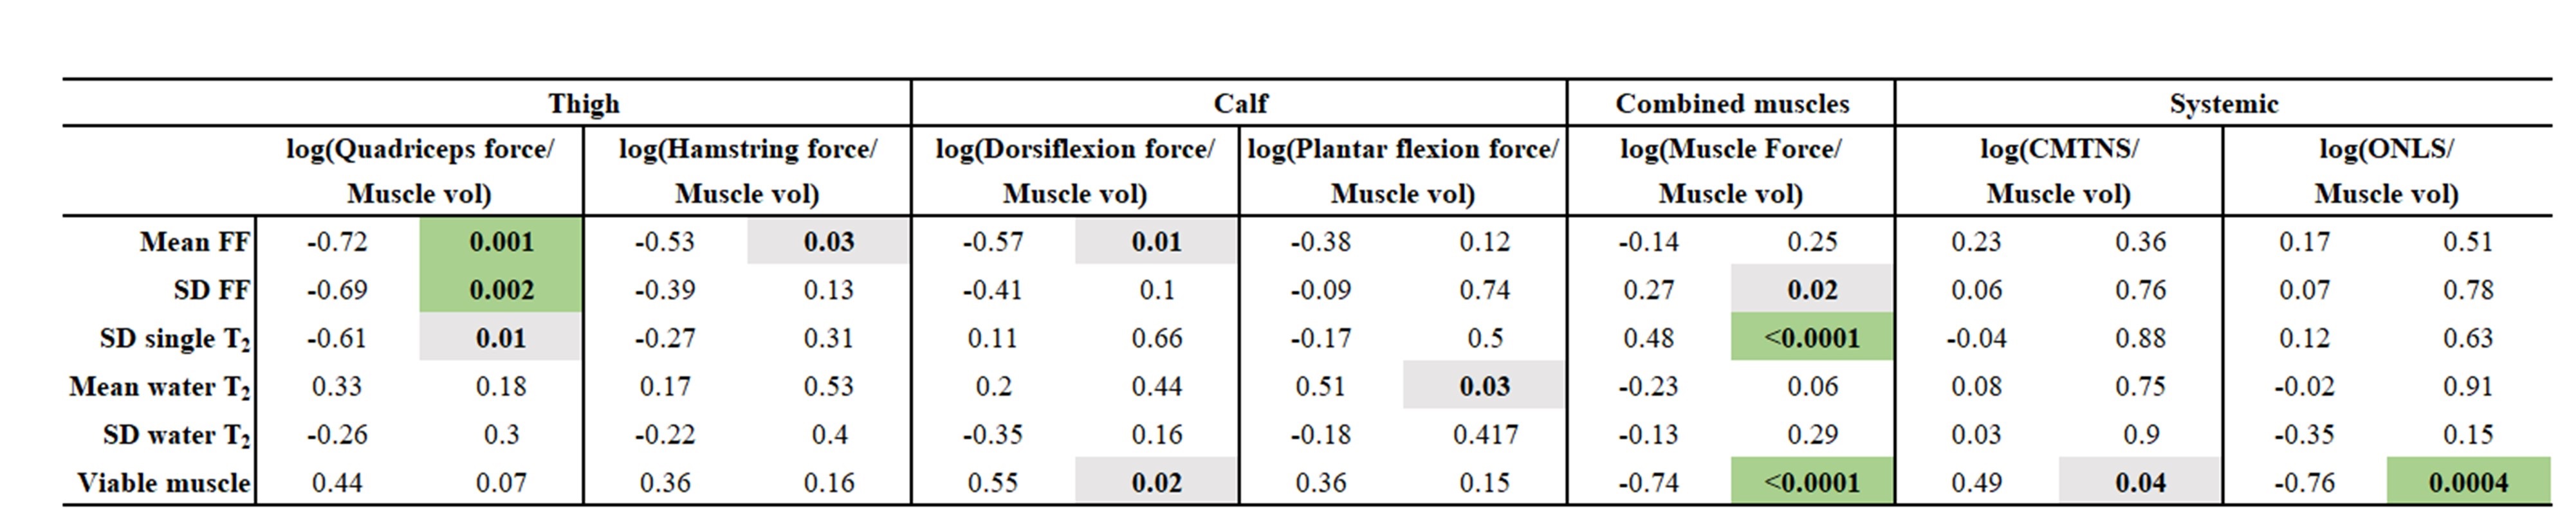
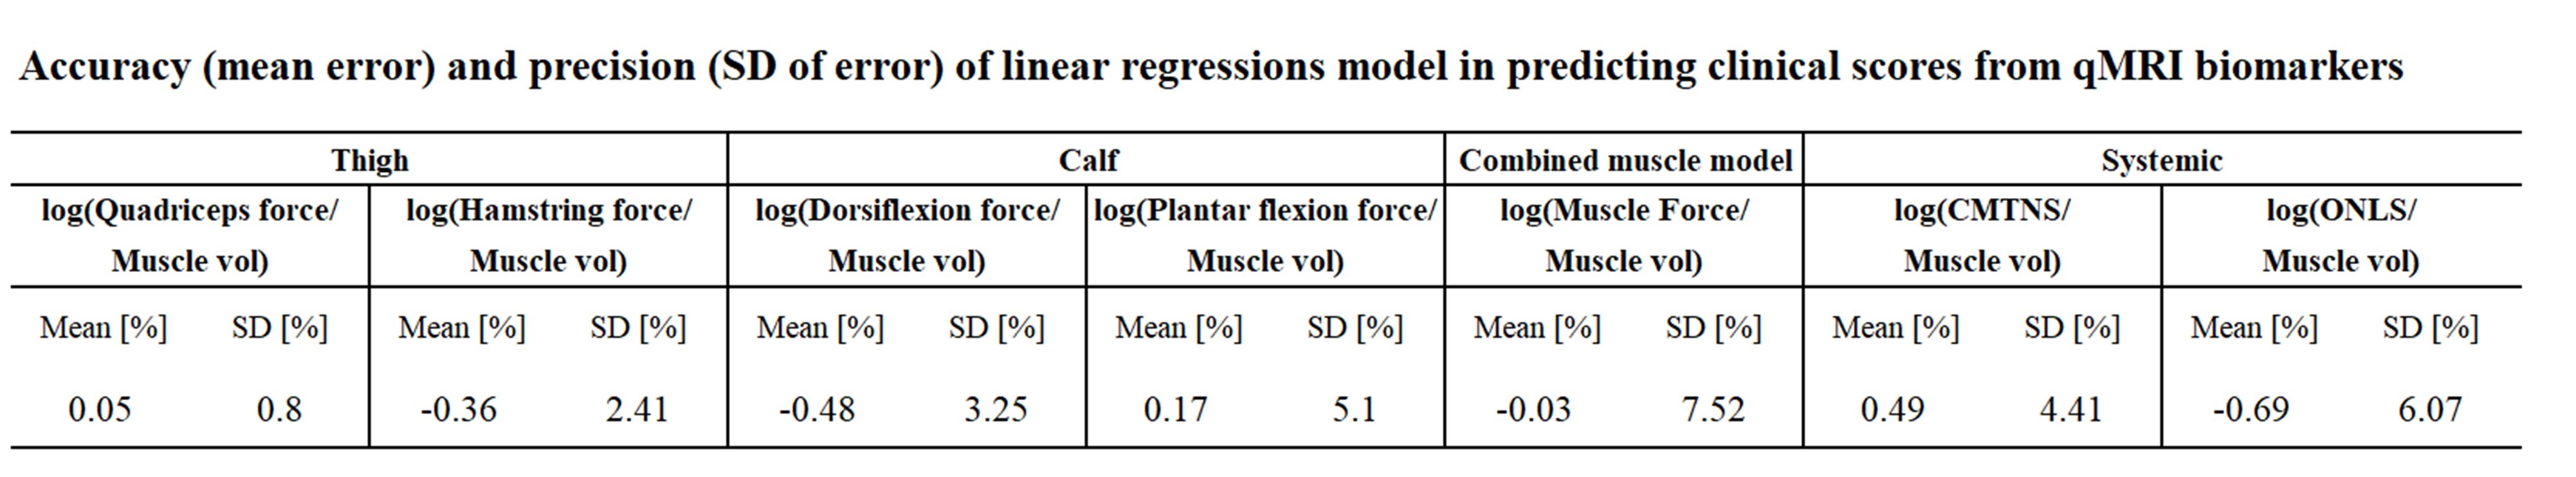
Table 2: Presented the root mean squared error, of the cross-validation test. Cross-validation, with leave-three-out scheme, was repeated for all possible permutations (680 times) testing the linear regression model associating between qMRI biomarkers and each clinical score (i.e., divided by muscle volume and transformed to logarithmic scale).