4207
Elevated Muscle Water T2 in Dystrophinopathy1Physiology, University of Florida, Gainesville, FL, United States, 2Physical Therapy, University of Florida, Gainesville, FL, United States, 3Advanced Imaging Research Center, Oregon Health & Science University, Portland, OR, United States
Synopsis
Keywords: Muscle, Muscle, muscular dystrophy
Both MRI and MRS measures reveal that water T2 can be elevated in individuals living with dystrophin deficits, which includes patients with DMD, BMD and manifesting carriers. This has important implications when evaluating therapeutics aimed at decreasing inflammation (e.g., corticosteroids or NFkb inhibitors) or disease modifying interventions, such as gene therapies.Introduction
Early biomarkers of muscle disease prior to functional deficits or increased fatty-fibrous deposition, provides a useful biomarker in many muscular dystrophies. It has been clearly established that muscle inflammation in young boys with Duchenne muscular dystrophy (DMD) can be detected with MRI and/or MRS prior to fatty tissue deposition1-3. Indeed, the increase in water transverse relaxation time constant (T2) detected by these methods has been shown to be sensitive to corticosteroid use in both both DMD4 and dermatomyositis5. On the other hand, it is unclear whether water T2 is increased in milder forms of X-linked dystrophinopathy, such as in Becker muscular dystrophy (BMD)3 or in manifesting carriers (MC). To address this, we implemented highly sensitive MRI and MRS methods to measure muscle water T2 in participants with DMD, BMD, and MCs.Methods
Single voxel 1H MRS was used to measure water T2 and fat fraction in soleus (SOL) and vastus lateralis (VL) muscles in 186 DMD (>900 observations), 32 BMD, 17 manifesting carriers, 54 pediatric male unaffected controls, 27 male unaffected adult controls, and 7 unaffected female controls using a multiple TE (TEs=4-16; 11-288 ms) STEAM sequence without water suppression (TR=9s) at 3T1. In a subset of subjects, a multiple spin echo (MSE; nTEs =128, ∆TE=7ms, TR=3s, B1max=27uT) were obtained of the lower leg with a 16ch T/R knee coil. To minimize the possibility of magnetization transfer and stimulated echoes in the MSE sequence, a single slice was acquired positioned to the center slice plane of the MRS location with a large refocusing/excitation slice thickness6. In the case of BMD three individual single slice packages were acquired. Water T2 was extracted from the MSE data using an extended phase graph (EPG) data analysis algorithm (https://git.lumc.nl/neuroscience/multicomponent_t2_epg)7 and from the multiecho MRS data using both nonlinear least squares8 and T2-NNLS9.Results
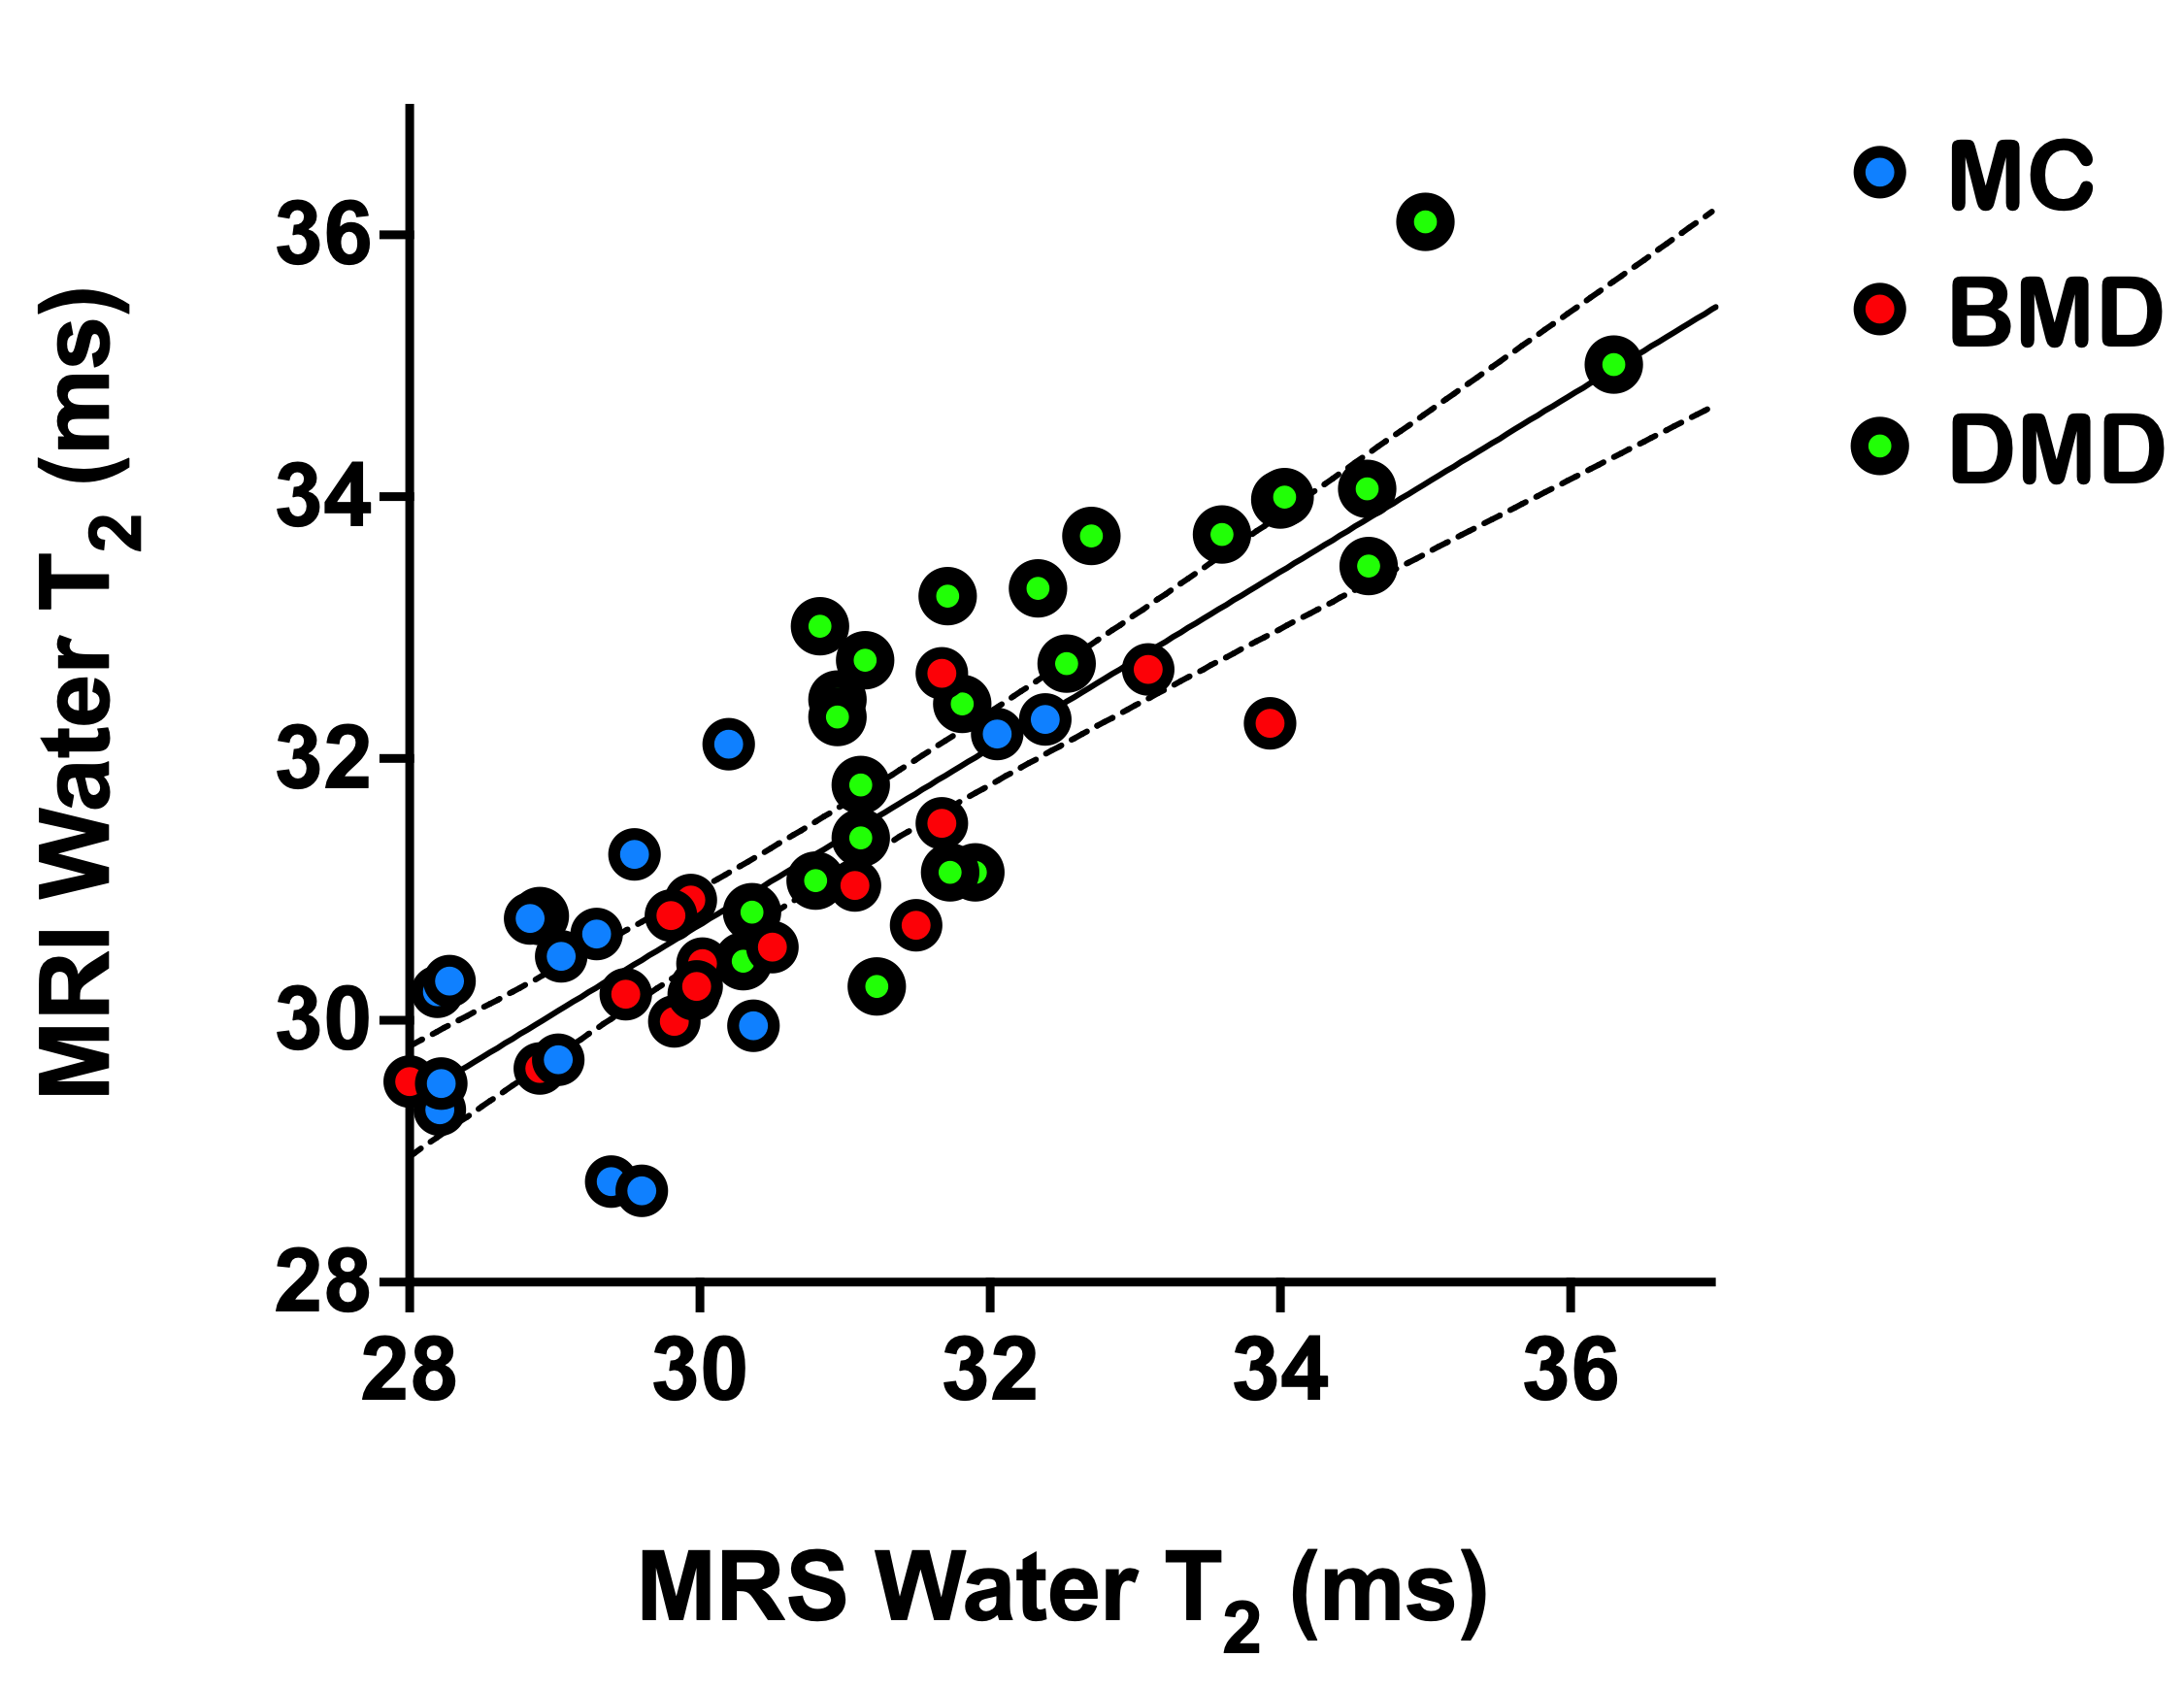
Water T2 was significantly (p<0.0001) elevated in both the DMD and BMD Sol and VL compared to unaffected controls (Fig 1 and 2). Water T2 was elevated above two standard deviations of control levels in 73% of the SOL and in 50% of VL DMD measurements, 33% and 39% of the SOL and VL muscles of BMD participants, and in 35 and 29% of the Sol and VL muscles of MCs (Fig 3). Elevated water T2 was observed in muscles that had fat fractions lower than 6% in all three patient groups (i.e., 2SD of mean control values). Elevated muscle water T2 was also detected in the SOL muscle using the quantitative MSE sequence combined with EPG analysis. All except for three DMD boys had water T2 values above the upper 95% CL (dotted line in Fig 4) for controls. Whereas four manifesting carriers and 52% of BMD SOL muscle water T2 values were above the 95% CL for controls (Fig 4). SOL water T2 determined by MRI and MRS was found to be directly related (Fig 5; r^2=0.69, P<0.0001).Conclusions
These results indicate that water T2 can be elevated in individuals living with dystrophin deficits, which includes patients with DMD, BMD and manifesting carriers. This has important implications when evaluating therapeutics aimed at decreasing inflammation (e.g., corticosteroids or NFkb inhibitors) or disease modifying interventions, such as gene therapies.Acknowledgements
We would like to acknowledge helpful discussions with Hermien Kan, Martijn Froeling, Jan-Willem Beenakker and Kevin Keene and for helping to make the EPG water T2 Matlab program available for this work. This work was supported by the NIH (R01AR056973, P50AR052646 ), parent project muscular dystrophy (Barnard) and the entire iNMD consortium.References
1. Forbes SC, Willcocks RJ, Triplett WT, et al. Magnetic resonance imaging and spectroscopy assessment of lower extremity skeletal muscles in boys with Duchenne muscular dystrophy: a multicenter cross sectional study. PLoS One. 2014;9(9):e106435.
2. Gerhalter T, Gast LV, Marty B, et al. (23) Na MRI depicts early changes in ion homeostasis in skeletal muscle tissue of patients with duchenne muscular dystrophy. J Magn Reson Imaging. 2019;50(4):1103-13. 3. Wokke BH, Van Den Bergen JC, Hooijmans MT, et al T2 relaxation times are increased in Skeletal muscle of DMD but not BMD patients. Muscle Nerve. 2016;53(1):38-43.
4. Arpan I, Willcocks RJ, Forbes SC, et al. Examination of effects of corticosteroids on skeletal muscles of boys with DMD using MRI and MRS. Neurology. 2014;83(11):974-80.
5. Marty B, Baudin PY, Reyngoudt H, et al. Simultaneous muscle water T2 and fat fraction mapping using transverse relaxometry with stimulated echo compensation. NMR Biomed. 2016;29(4):431-43.
6. Lebel RM, Wilman AH. Transverse relaxometry with stimulated echo compensation. Magn Reson Med. 2010;64(4):1005-14.
7. Keene KR, Beenakker JM, Hooijmans MT, et al. T2 relaxation-time mapping in healthy and diseased skeletal muscle using extended phase graph algorithms. Magn Reson Med. 2020;84(5):2656-70.
8. Forbes SC, Walter GA, Rooney WD, et al. Skeletal muscles of ambulant children with Duchenne muscular dystrophy: validation of multicenter study of evaluation with MR imaging and MR spectroscopy. Radiology. 2013;269(1):198-207.
Figures