4206
Q-Dixon MRI and High-Speed T2-Corrected Multiecho MR Spectroscopy to Quantify Thigh Muscle Fat Content in Dialysis Patients1Department of Radiology, Peking University Fourth School of Clinical Medicine, Beijing Jishuitan Hospital, Beijing, China, 2MR collaborations, Siemens Healthineers Ltd., Beijing, China
Synopsis
Keywords: Muscle, Fat
This study evaluated the correlation and consistency of proton density fat fraction (PDFF) measured by Q-Dixon magnetic resonance imaging (MRI) and high-speed T2-corrected multiecho (HISTO) magnetic resonance spectroscopy (MRS) for quantifying thigh muscle fat content in patients undergoing dialysis. Q-Dixon MRI exhibited good correlation and consistency with the HISTO MRS for thigh muscle fat quantitative measurements indicating that Q-Dixon MRI may be a reliable alternative to HISTO MRS in clinical assessment and radiological quantitative evaluation of thigh muscle fat infiltration.
Introduction
Sarcopenia, closely associated with muscle fat infiltration (MFI), is common among patients with end-stage renal disease (ESRD) undergoing dialysis and could contribute to poor prognosis1. The high-speed T2-corrected multiecho (HISTO) magnetic resonance spectroscopy (MRS) and Q-Dixon magnetic resonance imaging (MRI) have greater accuracy and objectivity for quantifying muscle fat content, which includes intermuscular adipose tissue and intramyocellular lipids (IMCL). Traditional morphological imaging cannot detect IMCL which has negative impacts on muscular structure, function, and mobility2-5. The purpose of this study was to compare Q-Dixon MRI and H1-MRS for quantifying the fat content of thigh muscles in patients undergoing dialysis.Methods
This study included 46 dialysis patients (mean age, 58.8 years; range, 89.1-29.7 years; 29 males) who underwent MRI including morphological 3D T1W imaging, 6-point (6pt) Q-Dixon sequence, and HISTO MRS on a 3T system (MAGNETOM Vida, Siemens Healthcare, Erlangen, Germany). The Q-Dixon is a Gradient Echo Volumetric Interpolated Breath-hold Examination (VIBE) with T2*-corrected 6pt Dixon prototype sequence, parameters as follows: TR/TE = 8.82/1.05, 2.46, 3.69, 4.92, 6.15, 7.38 ms, voxel size = 1.4 × 1.4 × 3.0 mm3, FOV = 450 × 390 mm, 104 slices, flip angle = 4°, bandwidth = 1080 Hz/px, acquisition time = 17 s. The HISTO is a high-speed T2-corrected multi-echo single-voxel H1 MRS sequence, parameters as follows: TR/TE = 3000/ 12, 24, 36, 48, 72 ms, TM =10 ms, voxel size = 30 × 30 × 30 mm3, flip angle = 90°, bandwidth = 1200 Hz/px, acquisition time = 15 s. Proton density fat fraction (PDFF) was measured in Q-Dixon and HISTO sequence within the upper-middle part of the left quadriceps femoris. The locations and sizes of Dixon volume of interests (VOIs) were manually matched with the HISTO as closely as possible (Figure 1). The relationship between Q-Dixon and HISTO PDFF was assessed with scatterplots, Bland-Altman plots, and the Spearman test. The comparison was investigated by Wilcoxon signed rank test. A P<0.05 was considered statistically significant.Results
Figure 2 shows the distributions of Q-Dixon and HISTO PDFF, plotted as histograms. Q-Dixon PDFF of quadriceps femoris was positively correlated with HISTO PDFF (r=0.931, P<0.001). Bland-Altman analysis revealed good agreement between them, with an average difference in quadriceps femoris of -0.30% (Figure 3). The difference between Q-Dixon and HISTO PDFF was not statistically significant (P = 0.159).Discussion
In this study, Q-Dixon MRI exhibited good correlation and consistency with the HISTO MRS for thigh muscle fat quantitative measurement including IMCL. According to the knowledge of the authors, this is the first VOI-analysis study of 6pt Q-Dixon MRI compared with HISTO MRS for muscle fat quantitative measurements in quadriceps femoris among patients undergoing dialysis. The application of volume-based measurements was beneficial for reducing the sampling error compared with the classic region of interest (ROI) approach due to inhomogeneous muscle fat distribution.Conclusion
The high correlation of Q-Dixon MRI with HISTO MRS supports that Q-Dixon MRI may be a reliable alternative to HISTO MRS in clinical assessment and radiological quantitative evaluation of thigh muscle fat infiltration.Acknowledgements
No acknowledgement found.References
1. Sabatino A, Cuppari L, Stenvinkel P, et al. “Sarcopenia in chronic kidney disease: what have we learned so far?.” J Nephrol. 2021;34(4):1347-1372.
2. Li Z, Zeng H, Han C, et al. Effectiveness of High-Speed T2-Corrected Multiecho MR Spectroscopic Method for Quantifying Thigh Muscle Fat Content in Boys With Duchenne Muscular Dystrophy. AJR Am J Roentgenol. 2019;1-7.
3. Grimm A, Meyer H, Nickel MD, et al. Evaluation of 2-point, 3-point, and 6-point Dixon magnetic resonance imaging with flexible echo timing for muscle fat quantification. Eur J Radiol. 2018;103:57-64.
4. Grimm A, Meyer H, Nickel MD, et al. A Comparison between 6-point Dixon MRI and MR Spectroscopy to Quantify Muscle Fat in the Thigh of Subjects with Sarcopenia. J Frailty Aging. 2019;8(1):21-26.
5. Addison O, Marcus RL, Lastayo PC, et al. Intermuscular fat: a review of the consequences and causes. Int J Endocrinol. 2014;2014:309570.
Figures
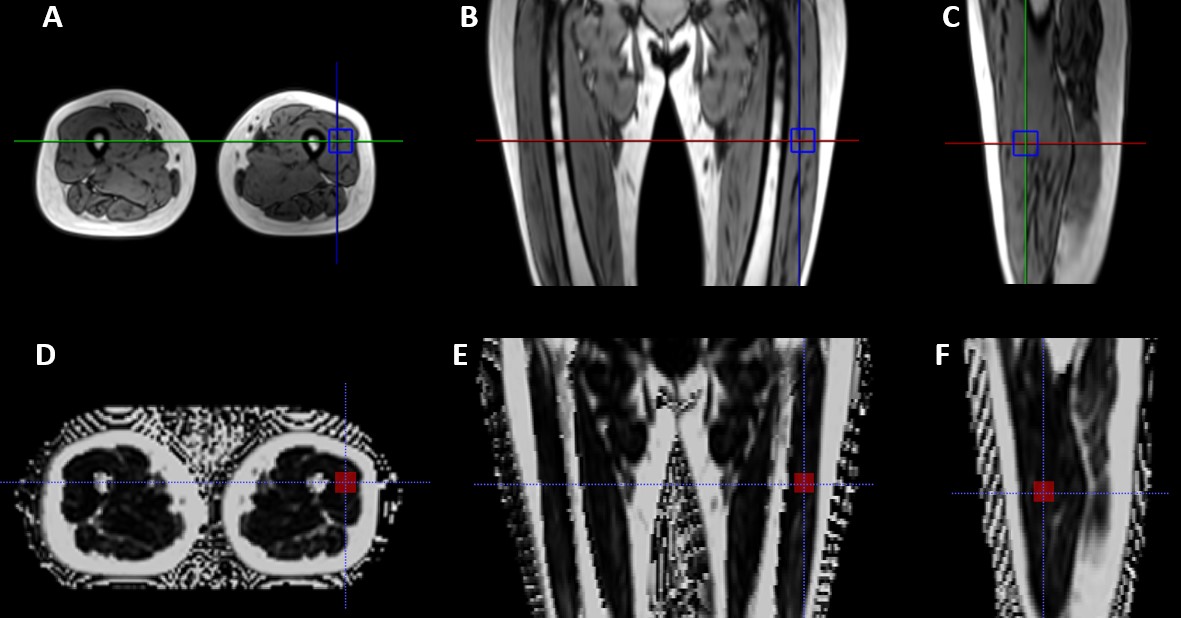
Figure 1: (A-C) Axial, coronal, and sagittal images of the left thigh reconstructed from three-dimensional (3D) T1 images were used for high-speed T2-corrected multiecho (HISTO) magnetic resonance spectroscopy (MRS) in a 47-year-old woman. (D-F) The corresponding axial, coronal, and sagittal reconstructed images of Q-Dixon fat fraction mapping.
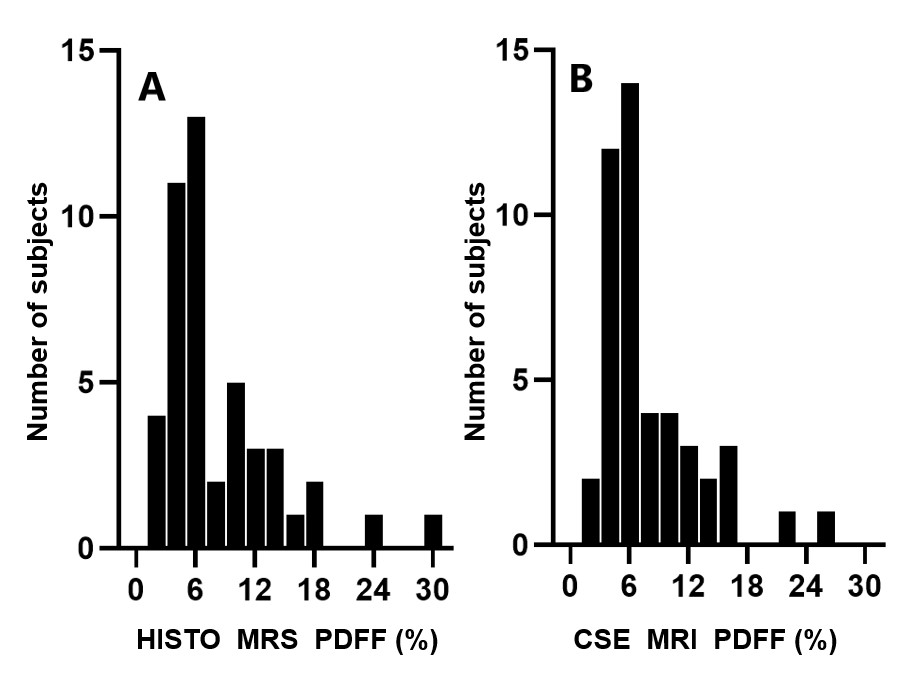
Figure 2: Histograms show measurements of (A) high-speed T2-corrected multi-echo (HISTO) magnetic resonance spectroscopy (MRS) proton density fat fraction (PDFF) and (B) chemical shift-encoded (CSE) MRI PDFF plotted as histograms.
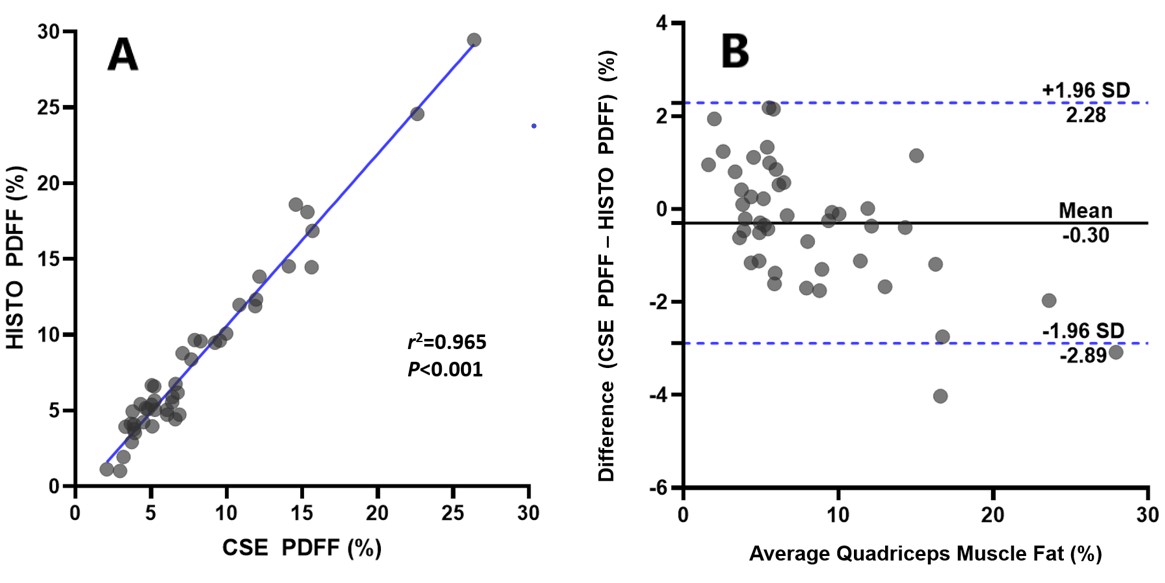
Figure 3: Plots show (A) scatterplot of high-speed T2-corrected multiecho (HISTO) proton density fat fraction (PDFF) against the chemical shift-encoded (CSE) MRI PDFF of quadriceps femoris. (B) Data points in A shown as a Bland-Altman plot. SD = standard deviation.