4196
Improving SNR of high resolution multi-echo SWI using complex domain DL based denoising1GE Healthcare, Bengaluru, India
Synopsis
Keywords: Machine Learning/Artificial Intelligence, Machine Learning/Artificial Intelligence
SWI is a high resolution MRI sequence, particularly sensitive to compounds which distort the local magnetic field making it useful in detecting blood products, calcium, etc. 3 and is used as part of brain MR imaging. The phase images are high pass filtered to remove the slow varying susceptibility changes and this is important to differentiate between para and diamagnetic substances. When this filtered phase image is used to accentuate the directly observed signal loss in the magnitude image, it is raised to a higher power and noise gets magnified as well, imparting undesirable effects in the SWI image.INTRODUCTIO
SWI is a high resolution MRI sequence that is particularly sensitive to compounds which distort the local magnetic field and as such make it useful in detecting blood products, calcium, etc. 3 and is used as part of brain MR imaging. The phase images are high pass filtered to remove the slow varying susceptibility changes and this is important to differentiate between para and diamagnetic substances. When this filtered phase image is used to accentuate the directly observed signal loss in the magnitude image, it is generally raised to a higher power and the noise gets magnified as well, imparting undesirable effects in the SWI image.METHODS
The noise is Gaussian in the acquired complex kspace as well as in the complex image, but the magnitude and phase images noise are no longer Gaussian. Denoising algorithms have proven to better denoise Gaussian noise and hence, might not be able to do a good job when employed on magnitude and phase images. In order to tackle noise in its Gaussian form, work has been done to denoise real and imaginary channels separately. Using a multicomponent approach in the complex domain has been found to outperform the other techniques. In this paper, we propose to use denoising in the complex domain (with real and imaginary , this is followed by super-resolution to overcome any blur that the denoising model might have introduced and to render sharp vessels.In the case of multiple echoes, especially with acceleration, the SNR of later echoes are poor. Denoising the low SNR echoes will call for aggressive denoising, hence excessive blurring. When the blurred echoes are later combined, the final image will loose significant quality. Hence, we propose to combine the echoes first, by combining the magnitude and phase images separately and is brought back to complex domain, where the denoising and super-resolution takes place. The denoising model continues to perform well, as the noise in real and imaginary remains Gaussian enough.
As in SWI, the magnitude image is used mostly to identify the location of the pathology, the denoised complex image can be used to generate phase map alone and the magnitude image can be from the actual echoes. The benefit of this approach is that the magnitude image retains its texture and the image reader find the processed image more natural, rather than excessively clean.
RESULTS AND DISCUSSION
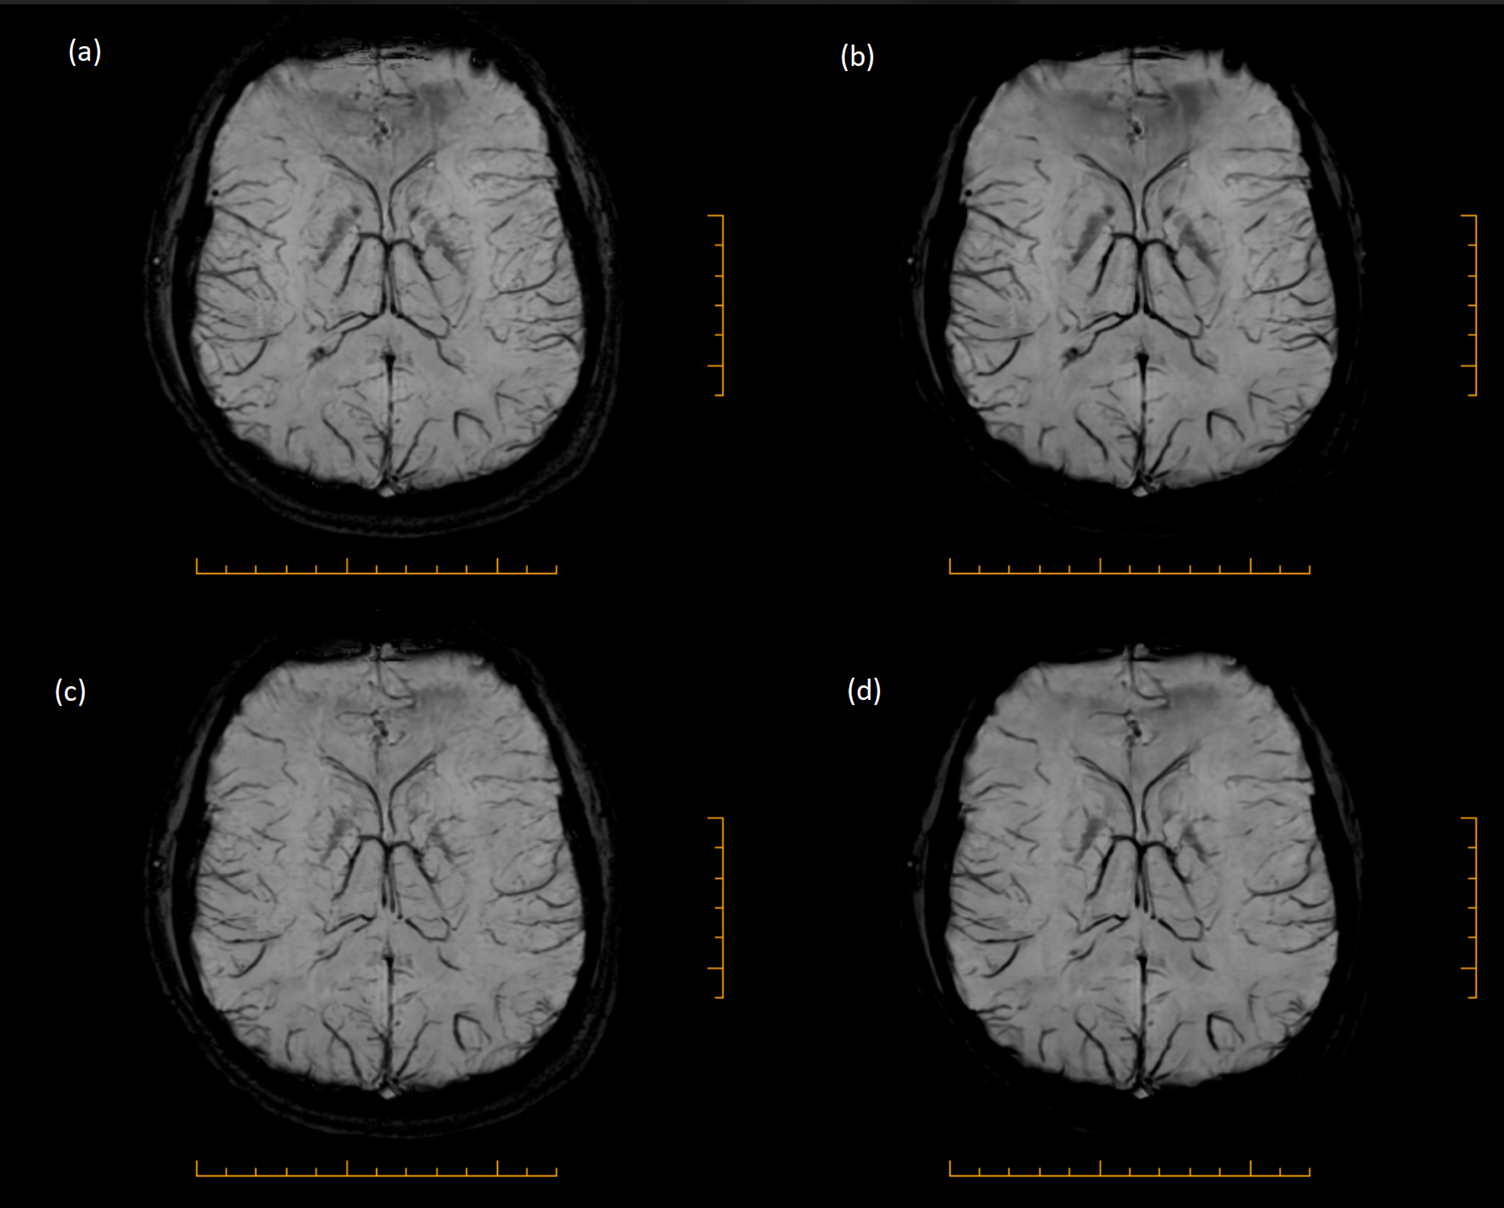
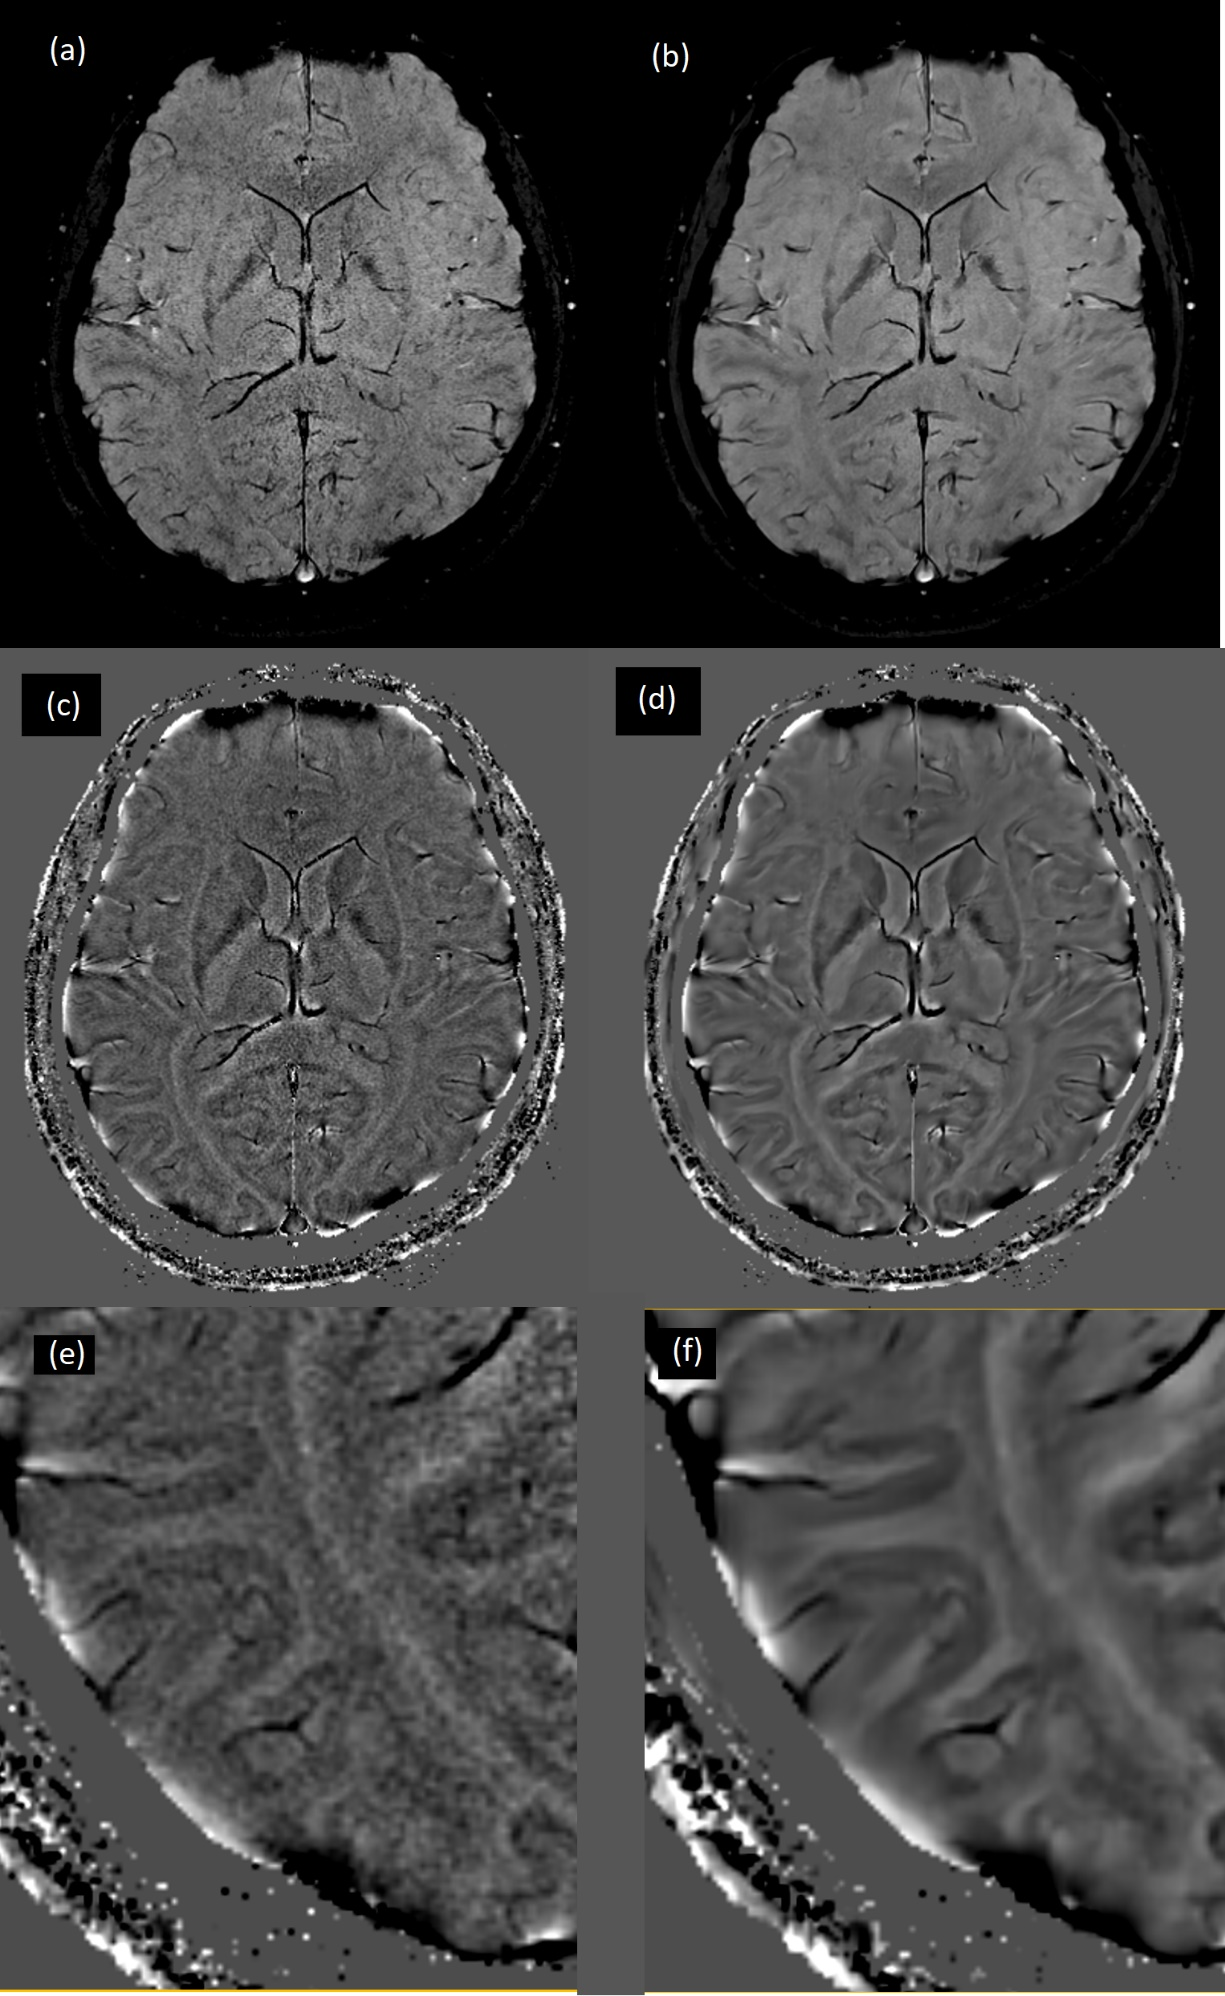
It was observed that the phase map, after denoising had high SNR and the sharpness of vessels as desired. Fig 1 is an example of good quality SWI acquired from 1.5T GE machine, 512x384 acquisition with ASSET acceleration of 2, 5 echoes, flip angle of 20degrees, TE of 46.6ms, TR of 74.9ms, 2mm slice thickness, 32 locs per slab and total acquisition time of 5 mins. Here, denoising was employed after echo combination and the denoised results used only for phase map generation. We observe that the SNR is not much improved, as the base quality image in itself has good SNR. But, it is noteworthy to mention that the proposed pipeline has not taken a toll on the sharpness, which is important in SWI. Fig 2 is an example of high resolution SWI from 1.5T GE machine, 512x512 acquisition with ASSET acceleration of 2, 5 echoes, flip angle of 20degrees, TE of 46.6ms, TR of 75ms, 2mm slice thickness, 24 locs per slab and total acquisition time of 4:30 mins. It is evident that the SNR of the SWI processed images have significantly gone up when the proposed pipeline is used. It is observed that the grey white matter differentiation in phase image in cortical region is better seen in the proposed pipeline.CONCLUSION
As SWI is best used with high resolution, the SNR goes down. SNR further goes down with acceleration. The proposed method improves the quality of the SWI images. The SNR is increased and the sharpness of vessels preserved. To the best of our knowledge, identifying the apt point in SWI pipeline (single and multi echo acquisitions) and employing DL methods for denoising and super-resolution to improve phase and SWI images is novel. Some of the other applications where the proposed pipeline will be beneficial are with 3T high resolution acquisition, to identify mineral deposition in neurodegenerative diseases and to identify micro-bleeds in the case of cerebral amyloid angiopathy.Acknowledgements
No acknowledgement found.References
[1] Borrelli, Pasquale & Palma, Giuseppe & Tedeschi, Enrico & Cocozza, Sirio & Comerci, Marco & Alfano, Bruno & Haacke, Mark & Salvatore, Marco. (2015). Improving Signal-to-Noise Ratio in Susceptibility Weighted Imaging: A Novel Multicomponent Non-Local Approach. PLoS ONE. 10. 10.1371/journal.pone.0126835.
[2] P. Borrelli et al., "Improving SNR in Susceptibility Weighted Imaging by a NLM-based denoising scheme," 2014 IEEE International Conference on Imaging Systems and Techniques (IST) Proceedings, 2014, pp. 346-350, doi: 10.1109/IST.2014.6958502.
[3] Dr Joshua Yap, 2022, Susceptibility weighted imaging, Radiopaedia.org, accessed 2nd November 2022, <https://radiopaedia.org/articles/susceptibility-weighted-imaging-1>
Figures