4190
CNN-based three-dimensional superresolution technology in Brain MRI with generalized q-sampling imaging
Chun-Yuan Shin1, Yi-Ping Chao2, Li-Wei Kuo3,4, Yi-Peng Eve Chang5, and Jun-Cheng Weng1,6,7
1Department of Medical Imaging and Radiological Sciences, and Department of Artificial Intelligence, Chang Gung University, Taoyuan, Taiwan, 2Department of Computer Science and Information Engineering, and Graduate Institute of Artificial Intelligence, Chang Gung University, Taoyuan, Taiwan, 3Institute of Biomedical Engineering and Nanomedicine, National Health Research Institutes, Miaoli, Taiwan, 4Institute of Medical Device and Imaging, National Taiwan University College of Medicine, Taipei, Taiwan, 5Department of Counseling and Clinical Psychology, Columbia University, New York City, NY, United States, 6Medical Imaging Research Center, Institute for Radiological Research, Chang Gung University and Chang Gung Memorial Hospital at Linkou, Taoyuan, Taiwan, 7Department of Psychiatry, Chang Gung Memorial Hospital, Chiayi, Taiwan
1Department of Medical Imaging and Radiological Sciences, and Department of Artificial Intelligence, Chang Gung University, Taoyuan, Taiwan, 2Department of Computer Science and Information Engineering, and Graduate Institute of Artificial Intelligence, Chang Gung University, Taoyuan, Taiwan, 3Institute of Biomedical Engineering and Nanomedicine, National Health Research Institutes, Miaoli, Taiwan, 4Institute of Medical Device and Imaging, National Taiwan University College of Medicine, Taipei, Taiwan, 5Department of Counseling and Clinical Psychology, Columbia University, New York City, NY, United States, 6Medical Imaging Research Center, Institute for Radiological Research, Chang Gung University and Chang Gung Memorial Hospital at Linkou, Taoyuan, Taiwan, 7Department of Psychiatry, Chang Gung Memorial Hospital, Chiayi, Taiwan
Synopsis
Keywords: Machine Learning/Artificial Intelligence, Diffusion/other diffusion imaging techniques
Understanding neural connections helps scientists conduct cognitive behavioral research. There are many nerve fiber intersections in the brain that need to be observed, and the size is between 30-50 nanometers. Improving image resolution has become an important issue. Generalized q-sampling imaging (GQI) was used to reveal the fiber geometry of straight and crossing. However, it is difficult to accurately describe fiber bending, fanning, and diverging with low-resolution imaging. In this work, we tried to achieve superresolution with a deep learning method on diffusion magnetic resonance imaging (MRI) images that has the potential to assess crossing, curving, and splaying fiber structures.Introduction
Understanding neural connections helps scientists conduct cognitive behavioral research. There are many nerve fiber intersections in the brain that need to be observed, and the size is between 30-50 nanometers [1]. Improving image resolution has become an important issue [2-4]. Generalized q-sampling imaging (GQI) was used to reveal the fiber geometry of straight and crossing. However, it is difficult to accurately describe fiber bending, fanning, and diverging with low-resolution imaging. In this work, we tried to achieve superresolution with a deep learning method on diffusion magnetic resonance imaging (MRI) images that has the potential to assess crossing, curving, and splaying fiber structures. In this work, we tried to achieve superresolution on diffusion MRI images. We added a residual structure to the 3D SRCNN. The extracted features and the interpolation results were averaged. With image superresolution technology, we were eager to obtain images with the best performance index.Methods
All 347 participants were scanned by a 3 T MRI imaging system (Verio, SIEMENS, Germany) at Chiayi Chang Gung Memorial Hospital. For diffusion imaging, a single-shot, diffusion-weighted spin echo-planar imaging sequence was performed. The image acquisition parameters were as follows: repetition time (TR)/echo time (TE) = 8943/115 msec; number of excitations = 1; field of view (FOV) = 250 × 250 mm2; slice thickness = 4 mm; matrix size = 128 × 128; voxel size = 3.4 × 3.4 × 4 mm3; b-values = 0, 1000, 1500, and 2000 s/mm2 in 193 total noncollinear directions. We selected 319 subjects' images as training data and 28 subjects' images as test data. The maximum common factor value of each dimension in the original image was 1. During preprocessing, we tried to increase the image matrix size form 44 × 44 × 12 to 132 × 132 × 36 voxels.A three-dimensional superresolution convolutional neural network (3D SRCNN) was used to achieve superresolution on diffusion weighted imaging (DWI). Then, generalized fractional anisotropy (GFA), normalized quantitative anisotropy (NQA), and the isotropic value of the orientation distribution function (ISO) mapping were reconstructed using GQI with superresolution DWI. We also reconstructed the orientation distribution function (ODF) of brain fibers using the above result. Performance index, including the peak signal-to-noise ratio (PSNR), structural similarity index measure (SSIM), cosine similarity were performed for evaluation.
Results
When we trained the superresolution model through DWI, the model was continuously modified.In training, we recorded the loss function every time we already trained the data of one subject. We recorded the loss functions of the three models during training. The model will be modified according to the loss function. In this work, we set the mean square error as a loss function. The rising and falling circumstances in the loss function help us check the training dataset and optimize the training parameters.In Fig. 1, we displayed the superresolution results of DWI images. The histograms of the superresolution images, low-resolution images, interpolation results, and target images shown below are compared. According to the multiplication of three indicators, we selected the best number of iterations from the three models to present reconstructed superresolution results. Images with different b-values are reconstructed with their best models. Here are three sections in 3D images: axial, coronal, and sagittal views.
We used DSI Studio to reconstruct three indices of GQI (GFA, NQA, and ISO) with the SRCNN result of DWI, which produced the best model. In Fig. 2, the results of the low-resolution image, interpolated image, superresolution image, and target image are compared via three sections of axial, coronal, and sagittal views. Below each group of pictures we used a histogram to judge the reconstruction effect. In Table 1, the performance indicators (PSNR, SSIM, and cosine similarity indices) of GFA, NQA, and ISO mappings were calculated and shown.
Discussion
Converting the original 2D SRCNN model to 3D SRCNN can help us improve the through-plane resolution in MRI. If the 2D SRCNN is used to improve the through plane resolution, then we must first train the axial, sagittal, and coronal models of MRI and then combine the test results predicted by the three models. This method is more complicated. Although there are fewer training parameters in the 2D model, the process of combining test results is more complicated. Therefore, we selected a 3D model for training, which simplifies the testing process.Conclusion
This superresolution method can assist in postprocessing low-resolution images. In the future, we do not need to take a long time to obtain high-resolution images. The method can clearly reconstruct the intersection structure in the brain connectome and has the potential to accurately describe the fiber geometry of straight, crossing, bending, fanning, and diverging fibers on a subvoxel scale.Acknowledgements
This study was supported by the research programs NSTC111-2221-E-182-021, NMRPD1M0971, and CMRPD1H0421 sponsored by the National Science and Technology Council, Taipei, Taiwan, and Chang Gung University and Chang Gung Memorial Hospital at Linkou, Taoyuan, Taiwan.References
1. Esther, L. et al., Probing fine-scale connections in the brain. Nature, 2020, 586(7830): 631-633.
2. Dong, C. et al., Image Super-Resolution Using Deep Convolutional Networks. IEEE Transactions on Pattern Analysis and Machine Intelligence, 2016, 38, 295-307.
3. Pham, C.-H. et al., Brain MRI super-resolution using deep 3D convolutional networks. IEEE 14th International Symposium on Biomedical Imaging, 2017, 10.1109.
4. Lin, H. et al., Generalised Super Resolution for Quantitative MRI Using Self-supervised Mixture of Experts. Lecture Notes in Computer Science, 2021, 12906.
Figures
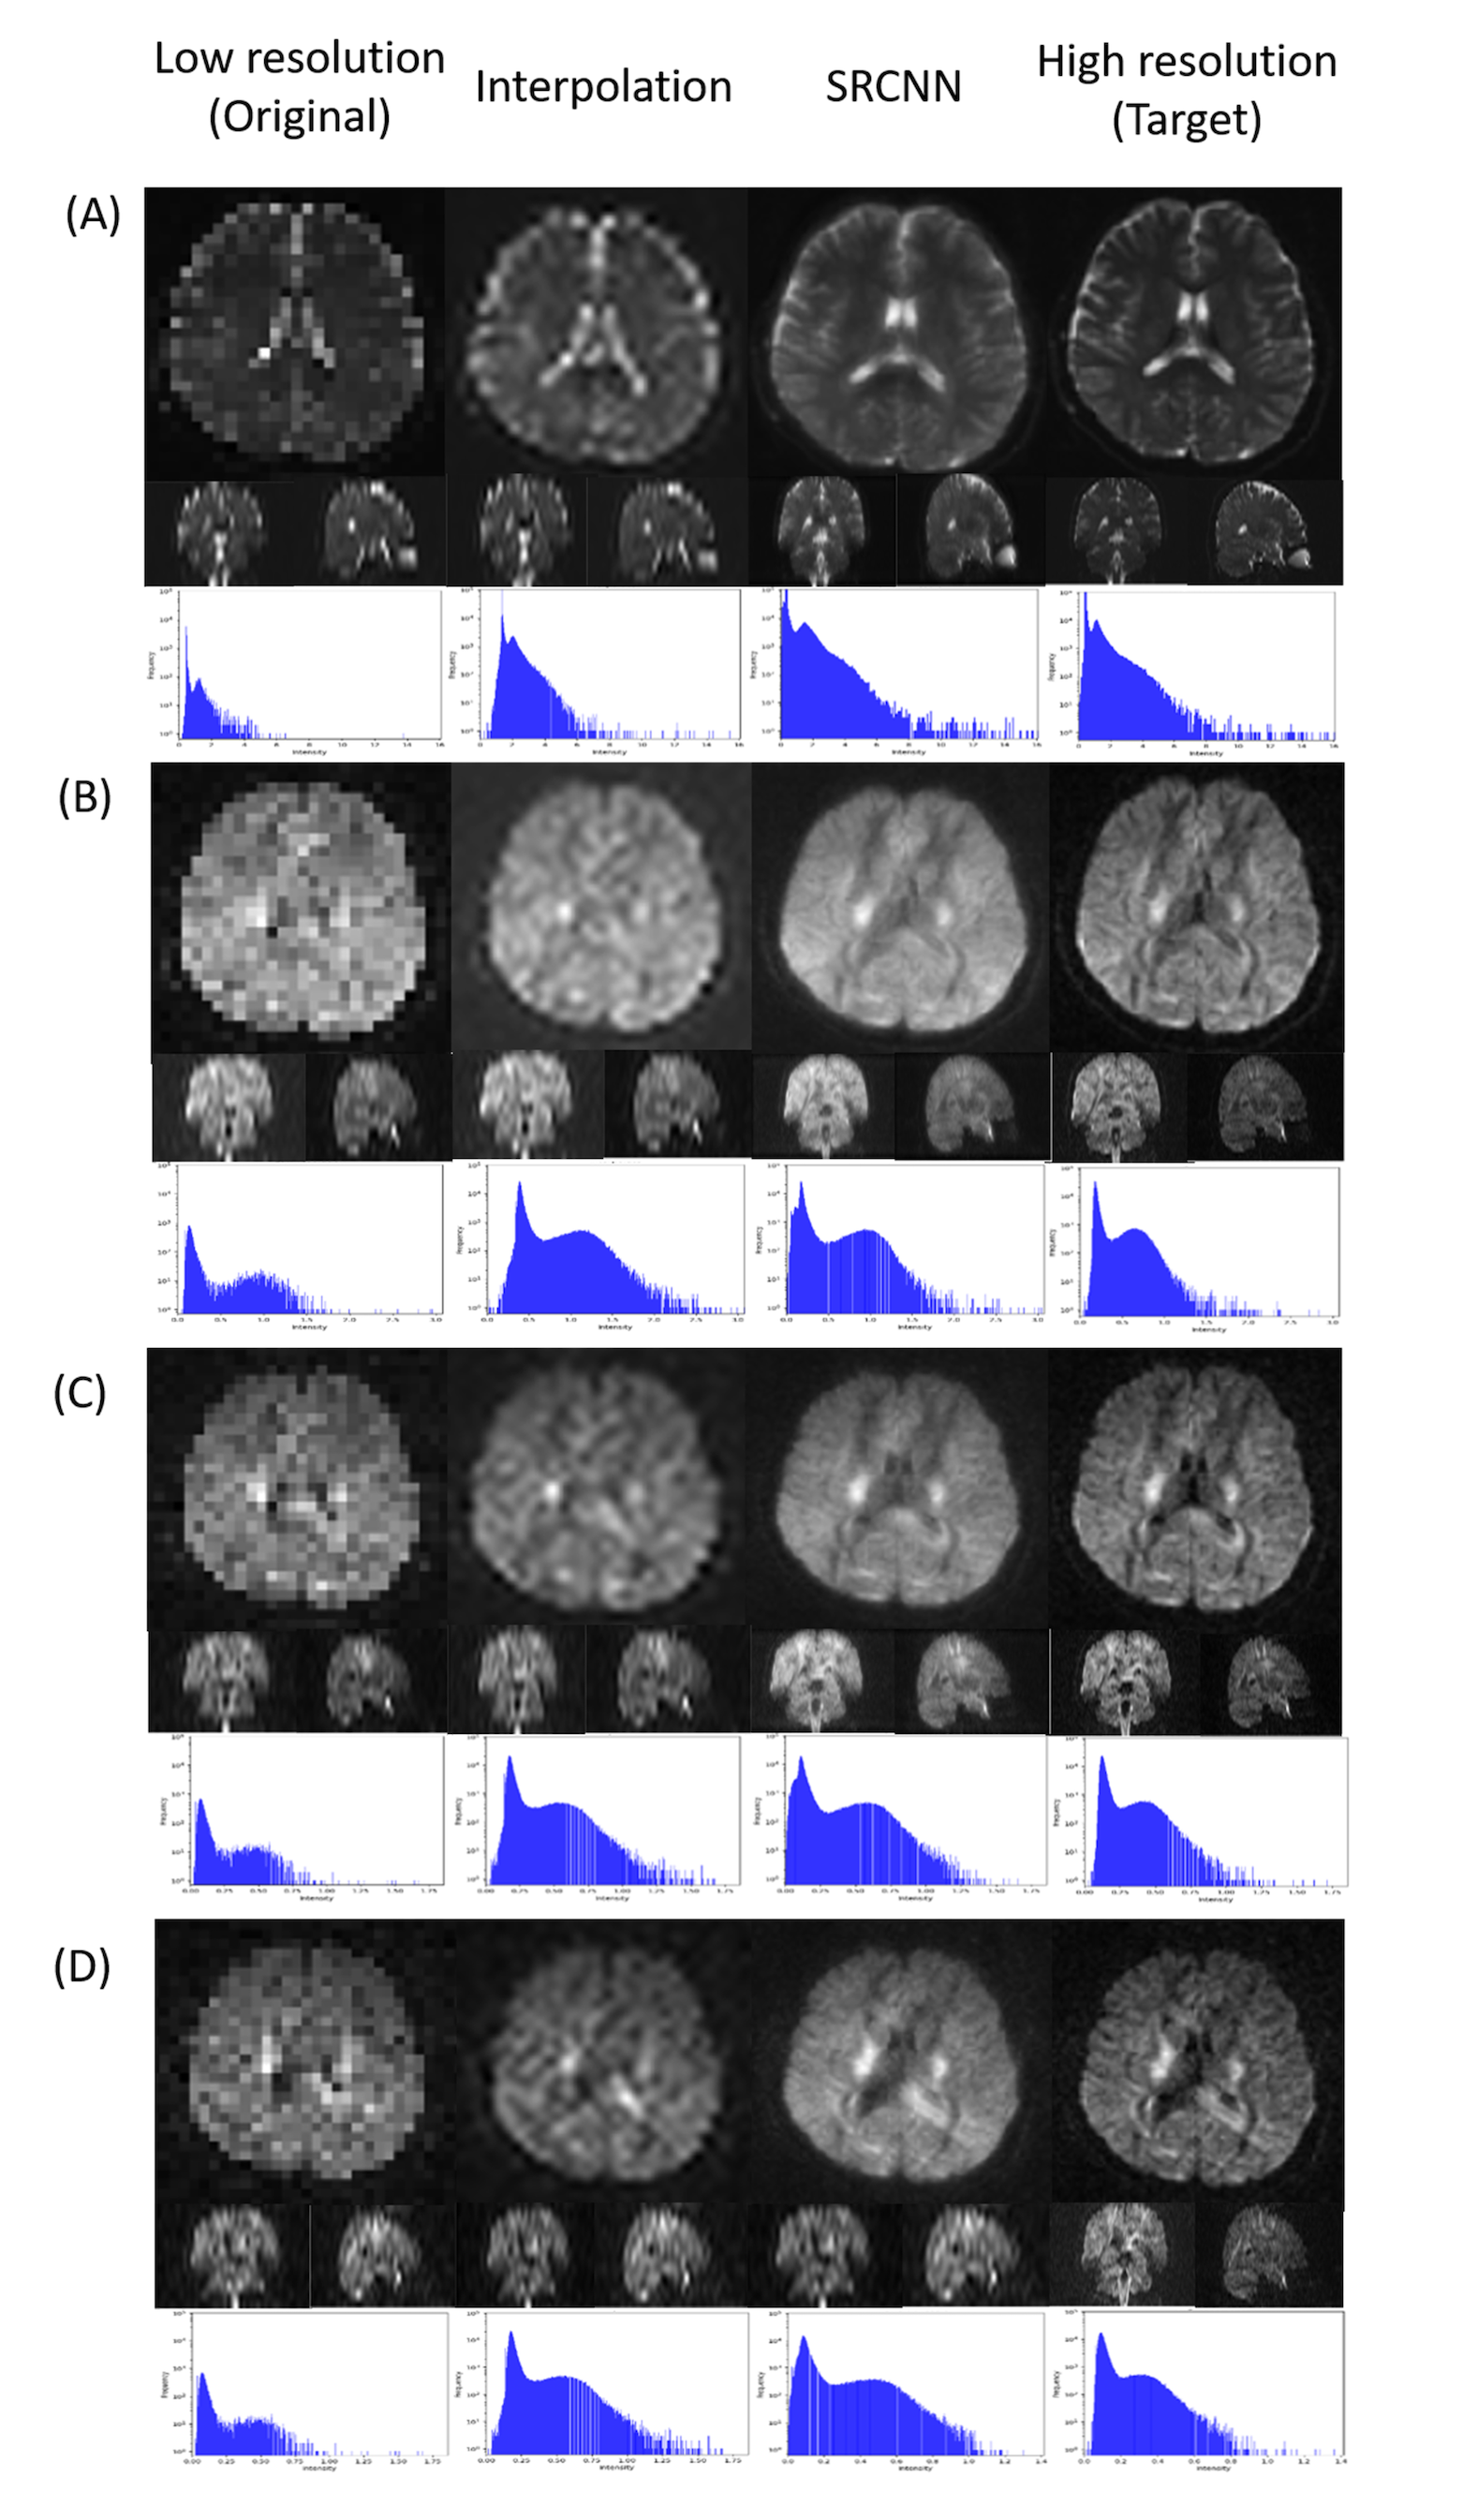
Superresolution result of diffusion-weighted imaging (DWI) including (A) null; (B) b=1000 s/mm2, direction = (0.26728, -0.96286, 0.0382407); (C) b=1500 s/mm2, direction = (0.267599, -0.962729, 0.0392831); and (D) b=2000 s/mm2, direction = (0.505928, -0.834259, -0.219201).
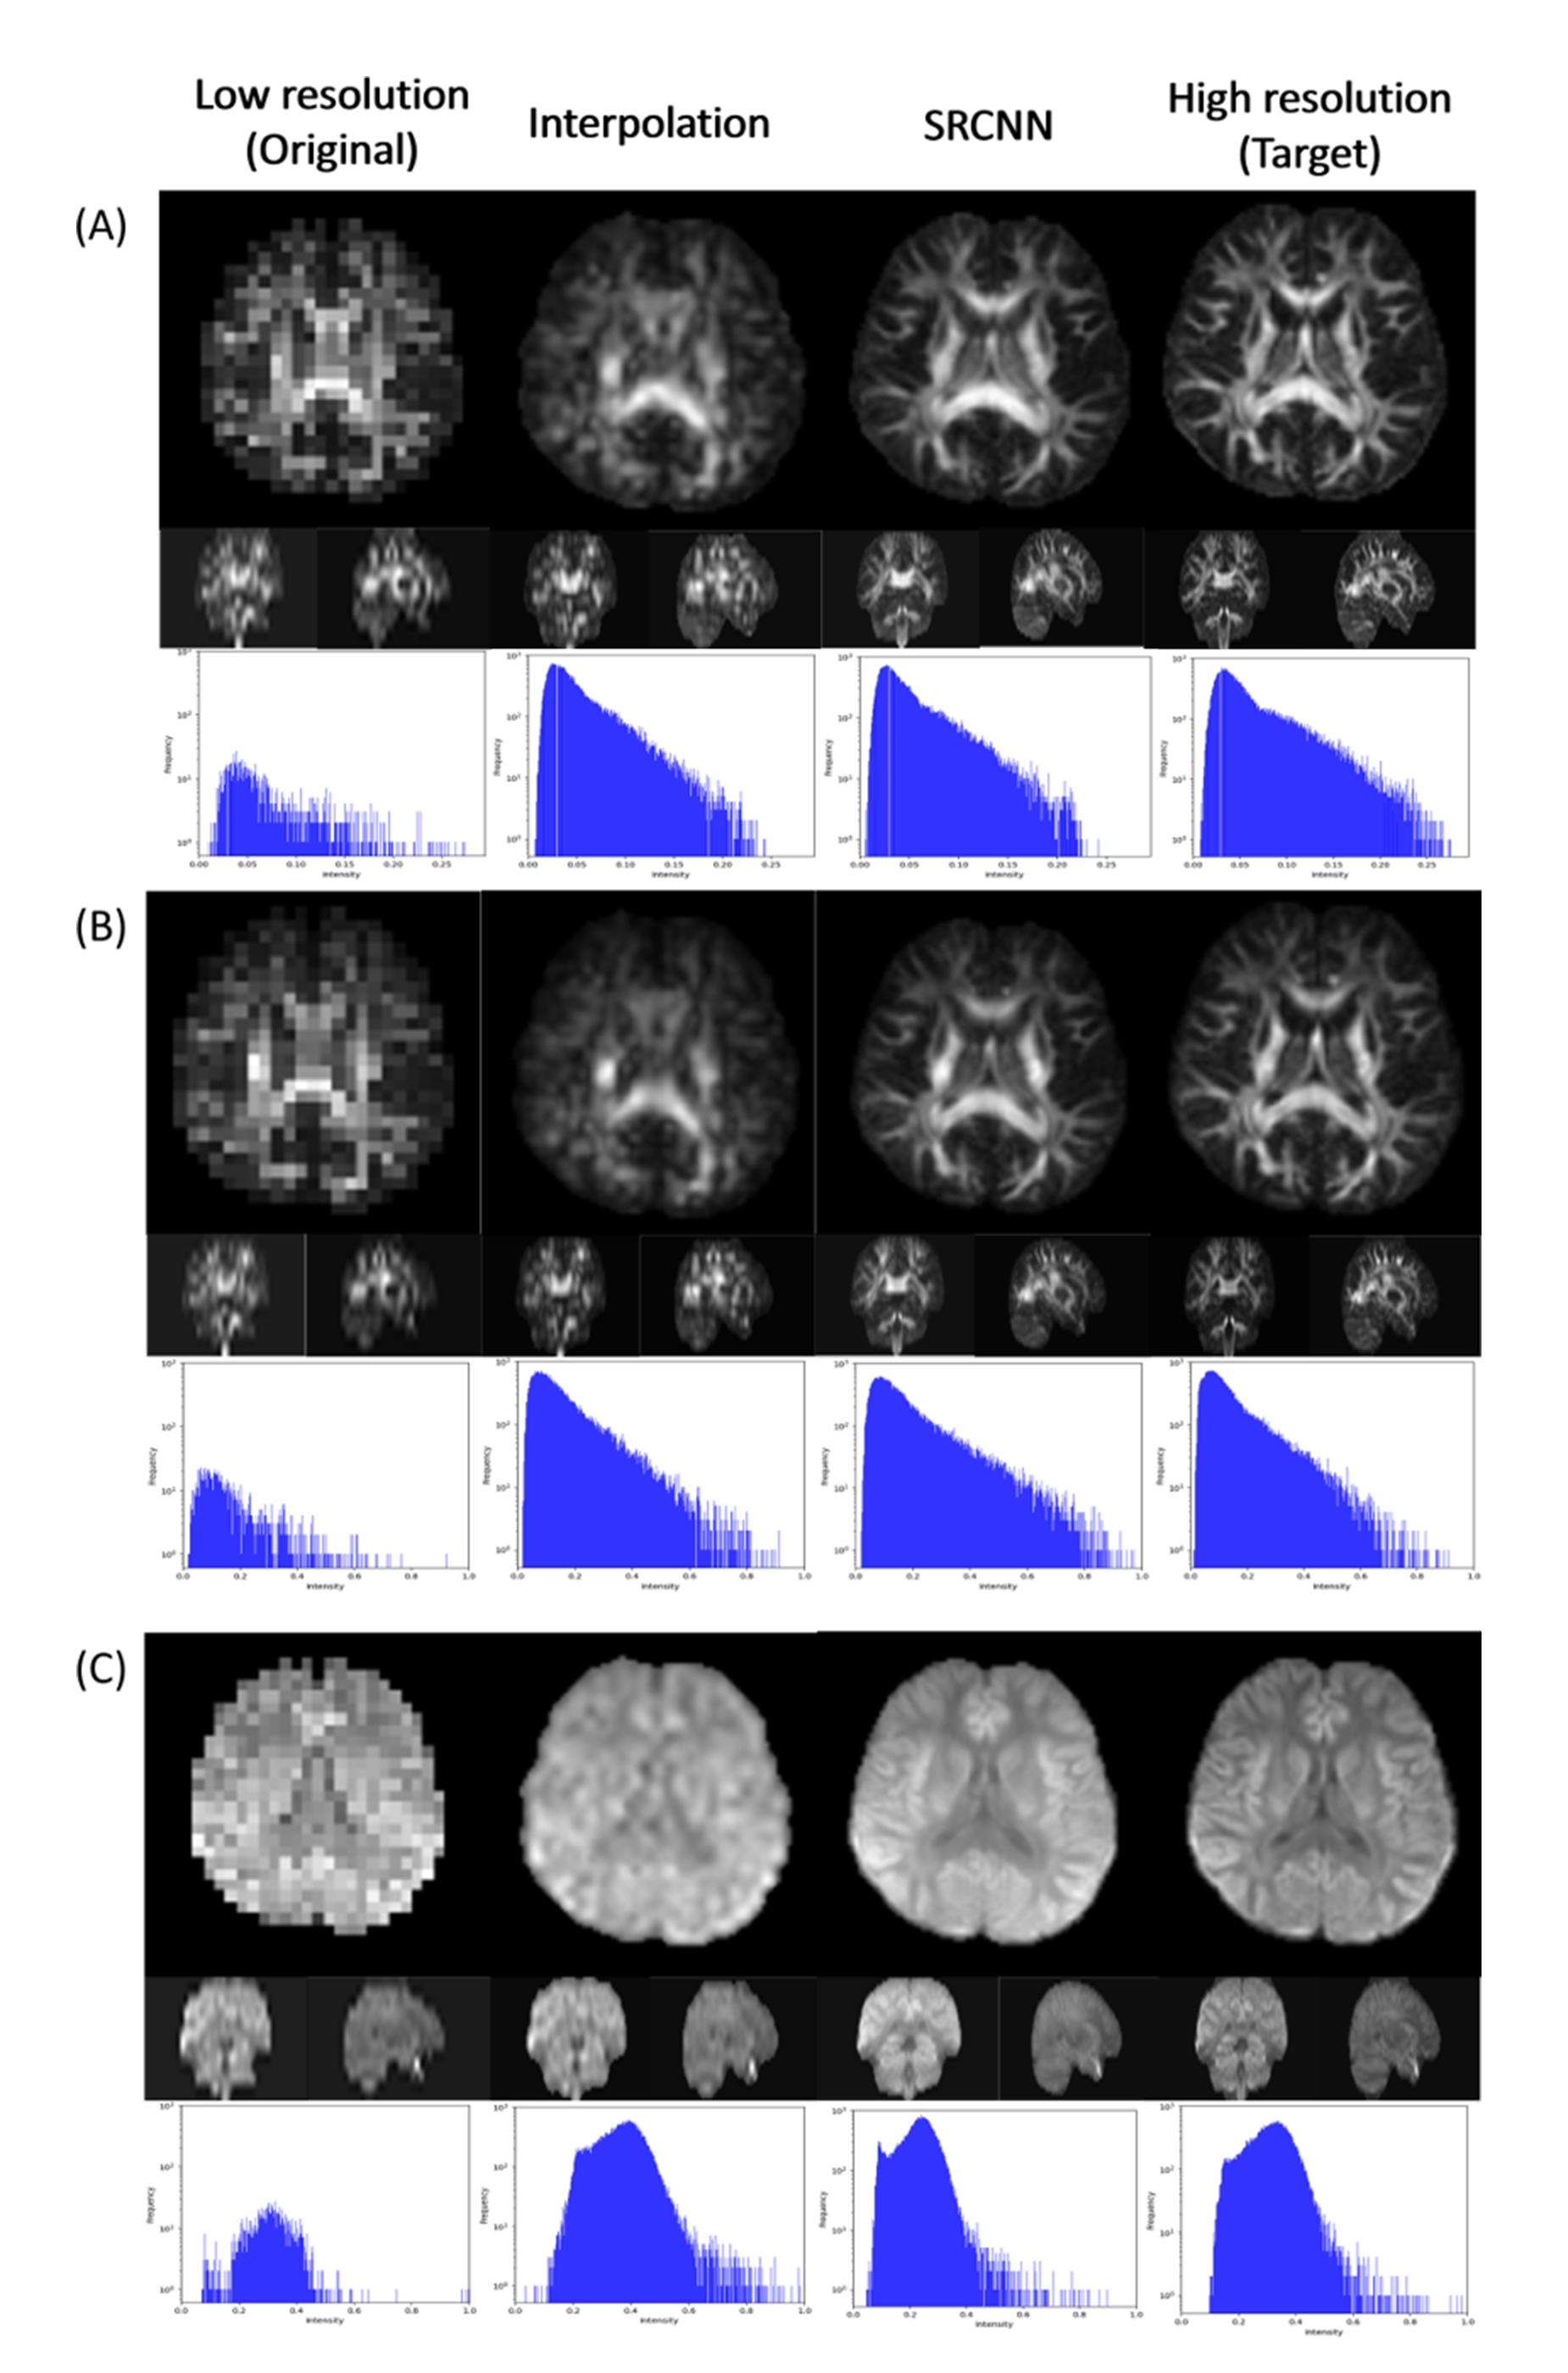
Fig. 2 Superresolution result of (A) generalized fractional anisotropy (GFA), (B) normalized quantitative anisotropy (NQA), and (C) isotropic value of orientation distribution function (ISO).
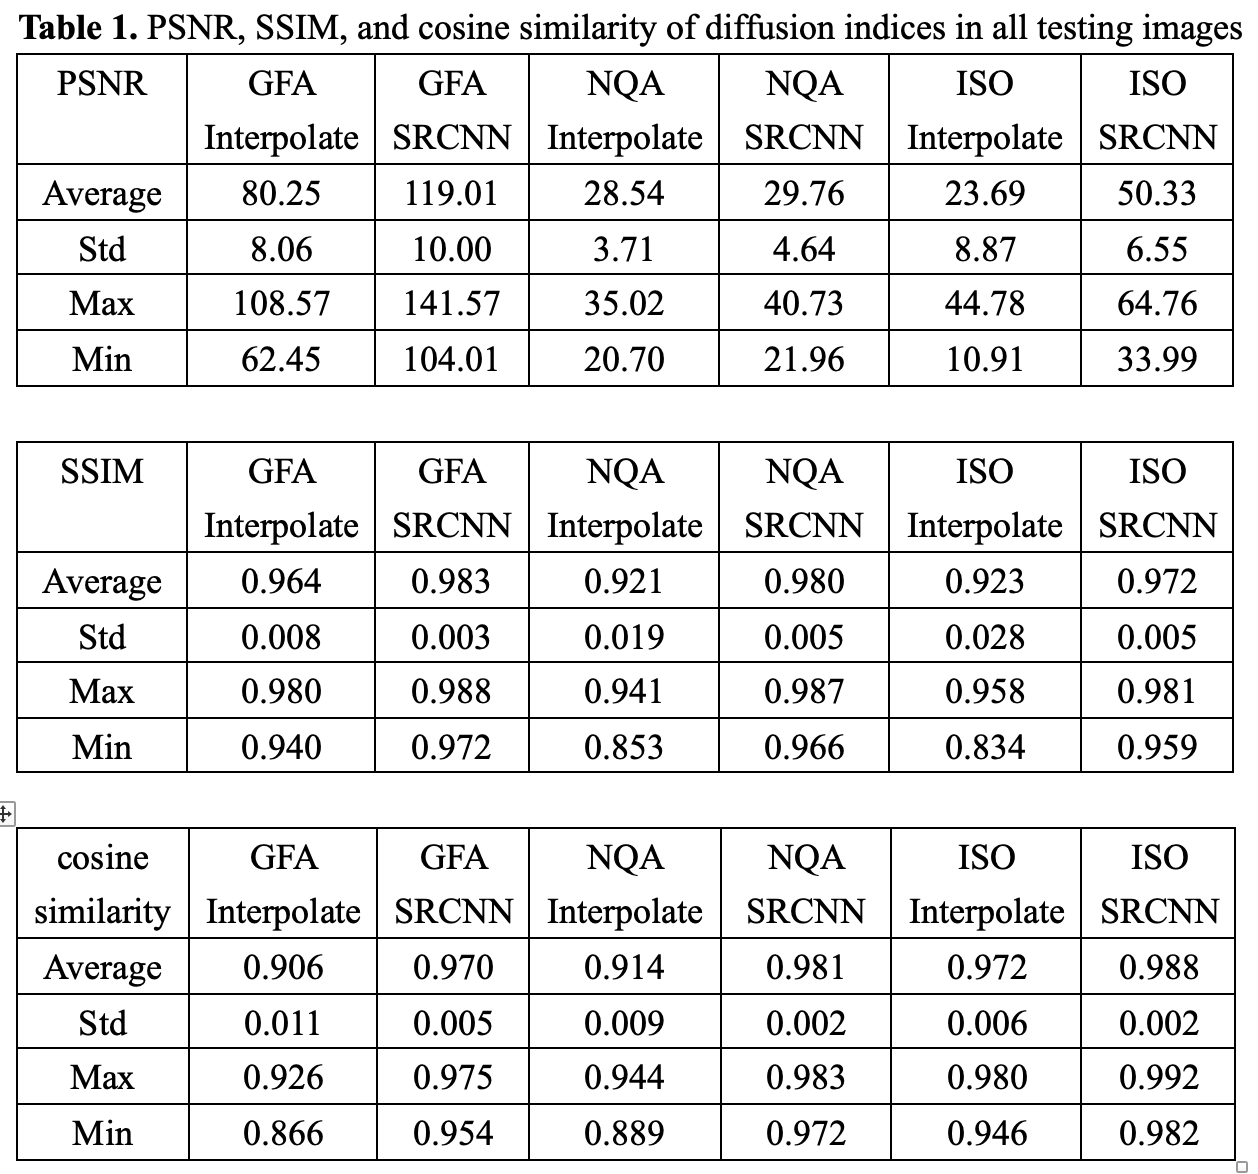
Table 1. PSNR, SSIM, and cosine similarity of diffusion indices in all testing images
DOI: https://doi.org/10.58530/2023/4190