4189
Enhanced-Deep-Super-Resolution Neural Network on Multiple MR Brain Images1Department of Biomedical and Neuromotor Sciences, University of Bologna, Bologna, Italy, 2Department of Experimental, Diagnostic and Specialty Medicine, University of Bologna, Bologna, Italy, 3Department of Agricultural and Food Sciences, University of Bologna, Bologna, Italy, 4Functional and Molecular Neuroimaging Unit, IRCCS Istituto delle Scienze Neurologiche di Bologna, Bologna, Italy, 5Department of Physics and Astronomy, University of Bologna, Bologna, Italy, 6INFN Bologna, Bologna, Italy
Synopsis
Keywords: Machine Learning/Artificial Intelligence, Visualization, Super Resolution, Generalization
Enhanced Deep Super Resolution (EDSR) is a machine learning model aimed to improve image spatial resolution. It was previously trained with general purpose figures and, in this work, directly tested on different MR images: T1w, T2w and Quantitative Susceptibility Mapping (QSM), a quantitative imaging technique. The studied cohort included 28 healthy subjects. Without needing fine-tuning, EDSR shows excellent ability of generalization over new kind of data, improving imaging visualization and outperforming the traditional bicubic upsampling. In future applications, images of patients will be considered to test EDSR reconstruction when there is pathological tissue.INTRODUCTION
Super Resolution (SR) neural networks are Deep Learning (DL) algorithms intended to enhance image spatial resolution. They have been used in biomedical applications1, since they may allow the acquisition of lower-resolution images, reducing scan time and movement artifacts and consequently improving the chance of lesion detection and disease diagnosis. In this work, we wanted to test a DL SR model (Enhanced Deep Super Resolution EDSR2) over different MR images, specifically T1w, T2w and Quantitative Susceptibility Mapping (QSM)3.METHODS
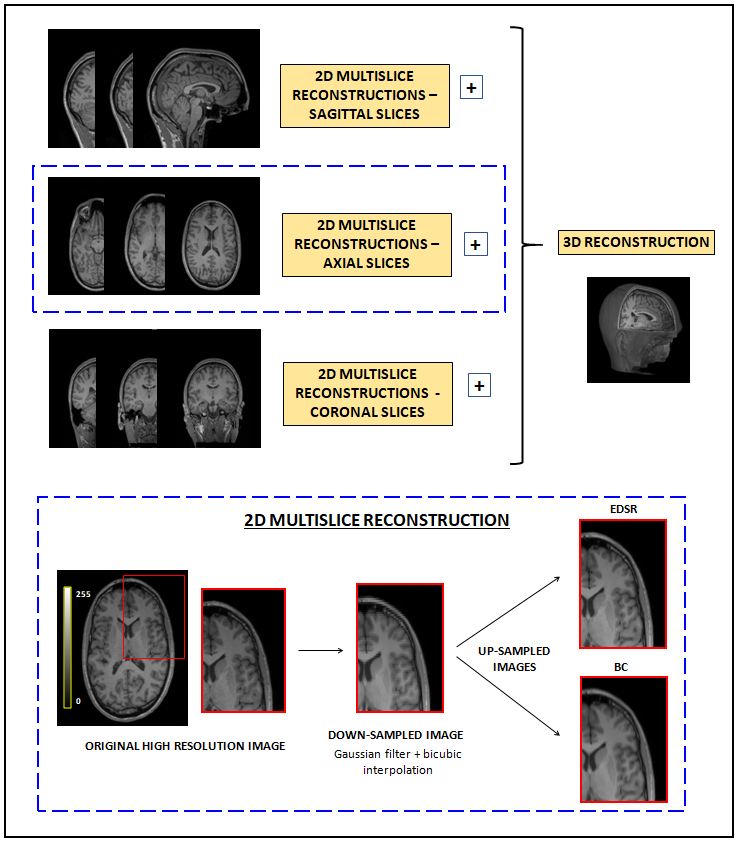
Data from 28 healthy subjects (17F/11M, age: 48.1±17.9, 24 to 86 years old) were selected from the database of Neuroimaging Laboratory (Functional and Molecular Neuroimaging Unit, IRCCS Institute of Neurological Sciences of Bologna, Bellaria Hospital). The MR protocol (3T Siemens Magnetom Skyra with Siemens Head/Neck 64-channel Coil) provided T1w (3D MPRAGE TR/TE = 2300/2.98 ms, 1x1x1 mm3), T2w (3D FLAIR, TR/TE = 5000/428 ms, 1x1x1 mm3) and QSM (3D GRE T2*w, nTEs=5, TE1/ΔTE/TR = 9.42/9.42/53 ms, 0.5x0.5x1.5 mm3). To obtain susceptibility maps, phase images from QSM sequence were processed by Laplacian unwrapping, V-SHARP background field removal and iLSQR, selecting the susceptibility of Cerebro-Spinal Fluid as reference. FLAIR and QSM images were linearly registered to the corresponding MPRAGE.EDSR is a 2D convolutional neuronal network based on residual learning techniques2. It was previously trained with general-purpose figures and then directly applied on MR images, avoiding re-training or fine-tuning stages. Images were processed as described below (Fig.1). For each direction (sagittal, axial and coronal), original 2D slices were convolved with a Gaussian filter and 2x-down-sampled with BiCubic (BC) interpolation, then 2x-up-sampled using both EDSR and BC, moving from 2x2mm2 to 1x1mm2 spatial resolution. The average of the 2D multislice reconstructions was considered. The reference-metrics pSNR (peak Signa-to-Noise Ratio) and SSIM (Structural SIMilarity index) were chosen as similarity parameters to compare the two up-sampling methods. The non-parametric Kruskal-Wallis test was selected.
RESULTS
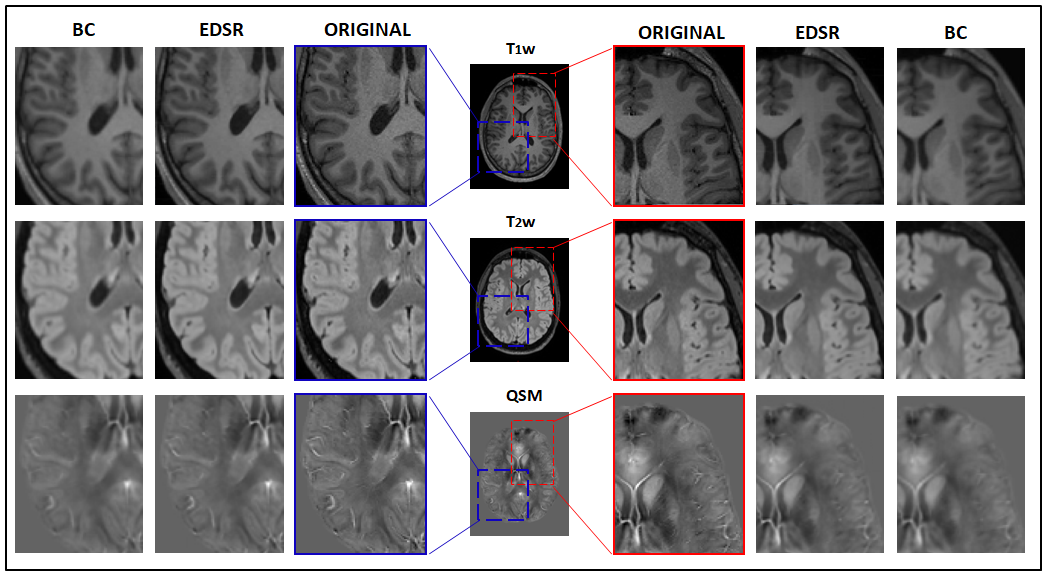
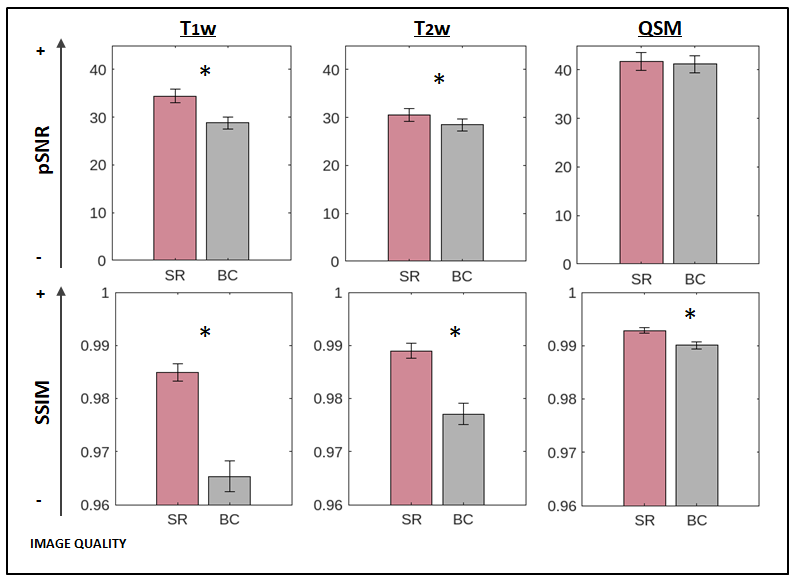
EDSR better reconstructed the original images for T1w, T2w and QSM sequences, restoring high spatial-frequency structures in more detail (Fig.2). Quantitative analysis confirmed the qualitative assessment: (EDSR vs BC, Kruscal-Wallis test, p-values < .05 *) (Fig.3):- pSNR: T1w 34.5±2.8 vs 28.8±2.4 (*); T2w 30.5±2.7 vs 28.5±2.6 (*); QSM 41.7±3.6 vs 41.2±3.5
- SSIM: T1w 0.985±0.003 vs 0.965±0.006 (*); T2w 0.989±0.003 vs 0.977±0.004 (*); QSM 0.993±0.001 vs 0.990±0.001 (*)
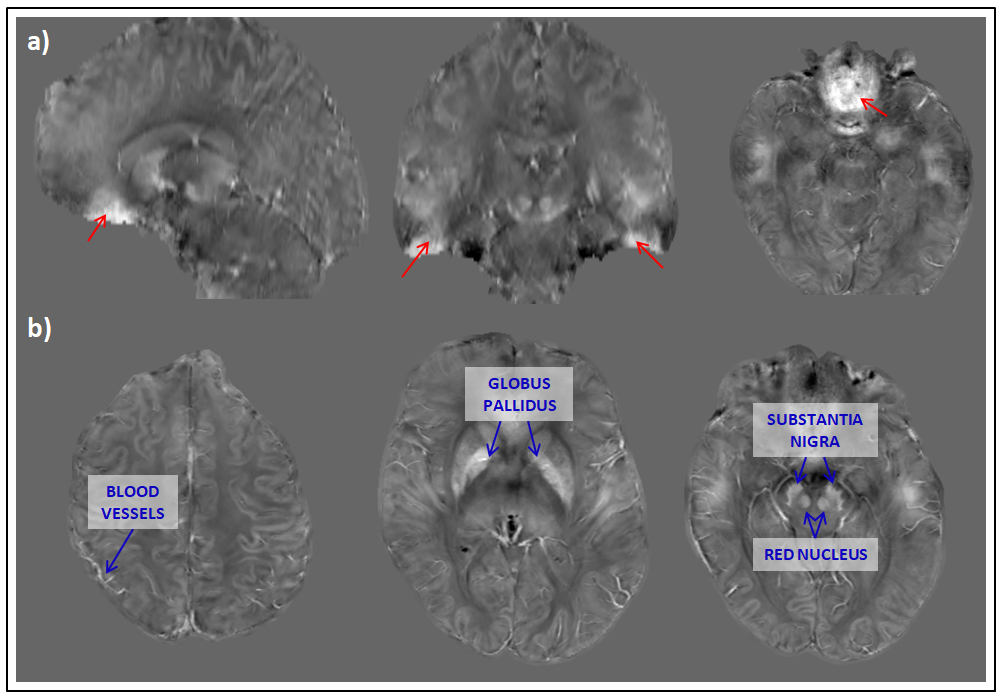
SSIM is a full reference metric, reliable indicator of image quality degradation, and it was significantly higher in EDSR reconstructions for all the images. Also pSNR, which is based on the absolute difference between pixel level intensity, showed higher quality of EDSR reconstructions, but the difference was not significant in QSM images. This result is probably due to the presence of high-intensity pixels in those images (Fig.4). Thus, QSM maps were upper-thresholded considering the 95th percentile of each image as cut-off, reducing the extension of hyper-intense areas, and the comparison analysis was carried out again: with this adjustment, QSM reconstructions from EDSR resulted significant better for both pSNR and SSIM.
DISCUSSION
In every neural network application, the generalization, from the training dataset to other data, is a critical stage, even if they are of the same kind. In this work, the model showed excellent ability of generalization over the MR images, different from the ones used to train the model and also different from each other. This result is probably due to the high number of parameters of the network, which however does not influence its computational cost4. EDSR is a 2D neural networks, here used to reconstruct 3D data; as in previous work5, we decided to exploit reconstructions from multi-slices super resolution images as a viable alternative to 3D neural networks. The images used in this work were previously unseen by the model and similar outcomes can reasonably be expected on images from the same sequences acquired with different scanners.Overall, the results were satisfactory and very promising. However, some lack in EDSR performance occurs in QSM images because of the presence of high-intensity pixels, not very common in the kind of images used to train the model (natural images such as landscapes and animals). In QSM reconstructions, bright pixels (Fig.4) are due to air-tissue artifacts, better to be removed, and to the presence of iron-storage structures, which are instead of interest in exploring some diseases. In fact, iron accumulation, proportional to susceptibility values in QSM, is an undergoing process in many neurodegenerative disorders. Thus, some arrangements may be recommended before using EDSR to study those images, such as a tailored fine-tuning of the model.
CONCLUSION
The current study leads to promising results: EDSR was trained with general-purpose figures and still allows better reconstructions with respect to the bicubic interpolation for T1w, T2w and QSM images. In QSM reconstructions, we observed some issue in accurately reproduce high-intensity pixels, some of them corresponding to presence of iron in the underlying tissues; fine-tuning training may be needed to analyze those images.In this work we did a preliminary analysis considering only healthy subjects; in future applications, the model will be applied also to patients to test its response to pathological tissue.
Acknowledgements
No acknowledgement found.References
1. Sui Y, Afcan O, Gholipour A et al. Super-Resolution Through Generative Degradation Learning. Med Image Comput Comput Assist Interv 2021; 12906:430-440
2. Timofte R, Agustsson E, Van Gool L et al. NTIRE 2017 Challenge on Single Image Super-Resolution: Methods and Results. IEEE CVPRW 2017
3. Ravanfar P, Loi SM, Syeda WT et al. Systematic Review: Quantitative Susceptibility Mapping (QSM) of Brain Iron Profile in Neurodegenerative Diseases. Front Neurosci 2021; 15:618435
4. Bashir SMA, Wang Y, Khan M et al. A comprehensive review of deep learning-based single image super-resolution. PeerJ Comput Sci 2021; 7:e621
5. Zhang H, Shinomiya Y, Yoshida S et al. 3D MRI Reconstruction Based on 2D Generative Adversarial Network Super-Resolution. Sensors (Basel) 2021; 21(9):2978
Figures