4187
Improving Brain Volume Measurement Workflow using combination of CS-MRI and Deep Learning based Super-Resolution1Chiang Mai university, Chiang Mai, Thailand, 2Philips Healthcare (Thailand), Bangkok, Thailand
Synopsis
Keywords: Machine Learning/Artificial Intelligence, Brain
For brain volume measurement (BVM), High-resolution (HR) MR images have shown to provide accurate results at small subcortical areas. However, prolonged scan time remains a classical challenge for 3D MRI. We implemented a combined technique, deep learning based super-resolution (DL-SR) and low-resolution Compressed Sensing (CS) 3D-TFE-T1W with acceleration factor 4 to generate Super-resolution (SR) images under one minute scan time. The results show that DL-SR model is able to improve image resolution, in which no significant differences (p>0.01) in quantitative volumetric measurement between reference and DL-SR at subcortical regions, except for caudate region.Introduction
Brain Volume Measurement (BVM) is an important task in the studies of neurological disorders (e.g. Alzheimer’s disease and Multiple Sclerosis)1-2. A High-resolution (HR) brain MRI scan is the method of choice for BVM. However, it is limited by time-consuming causing patient motion from discomfort. Parallel imaging techniques such as sensitivity encoding (SENSE)3 and Compressed Sensing (CS)4 enable to accelerate MRI acquisition by reducing the number of acquired k-space data. SENSE exploits the fact that using the spatial sensitivities of each multi-channel coil array to reconstruct the MR image from under-sampled data. CS takes advantage of the sparsity in MR images and recovers the MR image from under-sampled data. Both are combined to further shorten scan time and become the commercial product referred to as Compressed-SENSE. In clinical scanner, CS is limited by receive coil channels, only low acceleration factors can provide sufficient image quality4. Recently, scientific advances in Deep learning-based super-resolution have shown the potential to generate Super-resolution (SR)5 MR images from low-resolution (LR) acquisition. In this study, we explore the feasibility of using DL on low-resolution CS-3D whole brain-MRI to create SR images which aim to maintain the accuracy of BVM with scan time reduction.Materials and Methods
We trained Residual Dense Net (RDN)6 to perform super-resolution via TensorFlow and Keras in Python with GeForce-RTX-3090 using pair of original data and synthetical 2x-subsampling data from 100 datasets of 3D-TFE-T1W of the internal database which were referred to as HR and LR, respectively. To test the trained model, 3D-TFE-T1W combined with CS-4 for both HR and LR were acquired using 1.5T-MRI equipped with 12 channel head coil from 25 healthy volunteers with completely full-filled informed consent following parameters: 1 x 1 x 1 mm3 with TR/TE = 7.5/3.4 ms., Matrix 256 x 256, 176 slices, Scan time 2.59 min for HR and 2 x 2 x 2 mm3 with TR/TE = 4.5/2.1 ms., Matrix 128 x 128, 88 slices, Scan time 47 sec. The model was tested for generating SR images from acquired LR images. In addition, peak signal to noise ratio (PSNR), normalised root-mean-square error (NRMSE), and structural similarity (SSIM) were reported for evaluation of the DL-SR model. For performance in clinical application, BVM was measured by Freesurfer, and statistical efficacy of the DL-SR model was determined by Pearson’s correlation and Wilcoxon signed rank test.Results
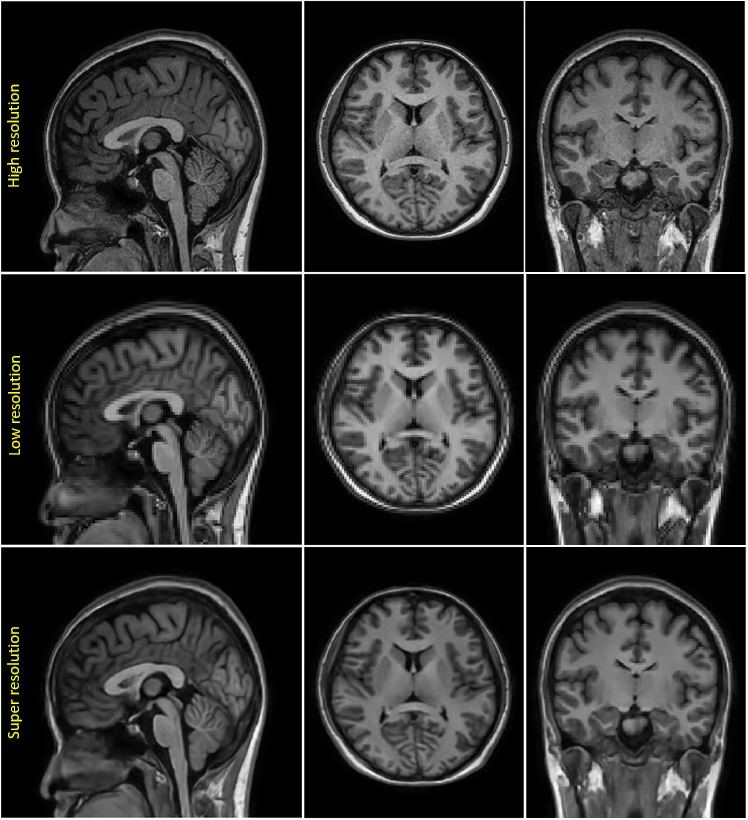
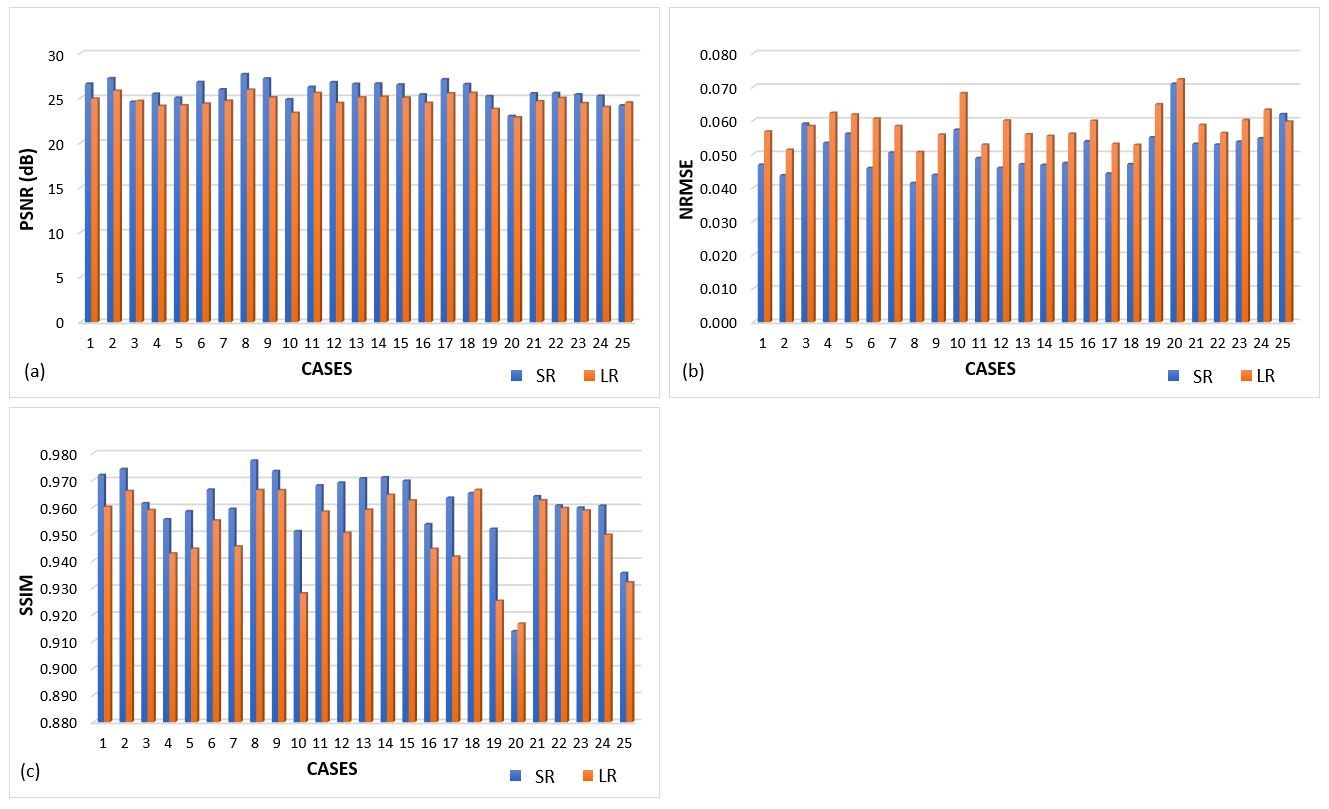
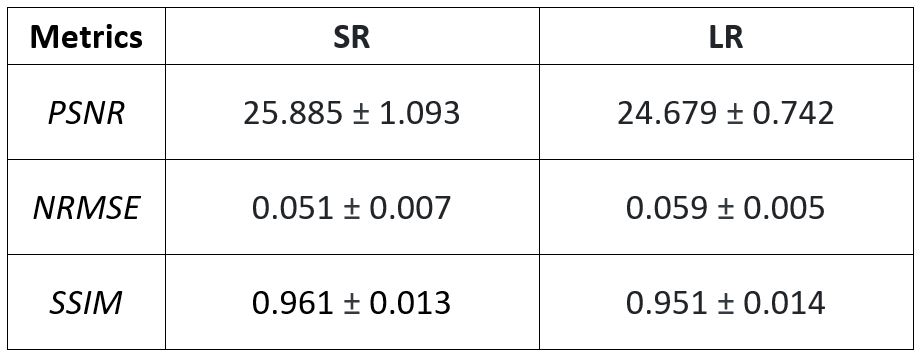
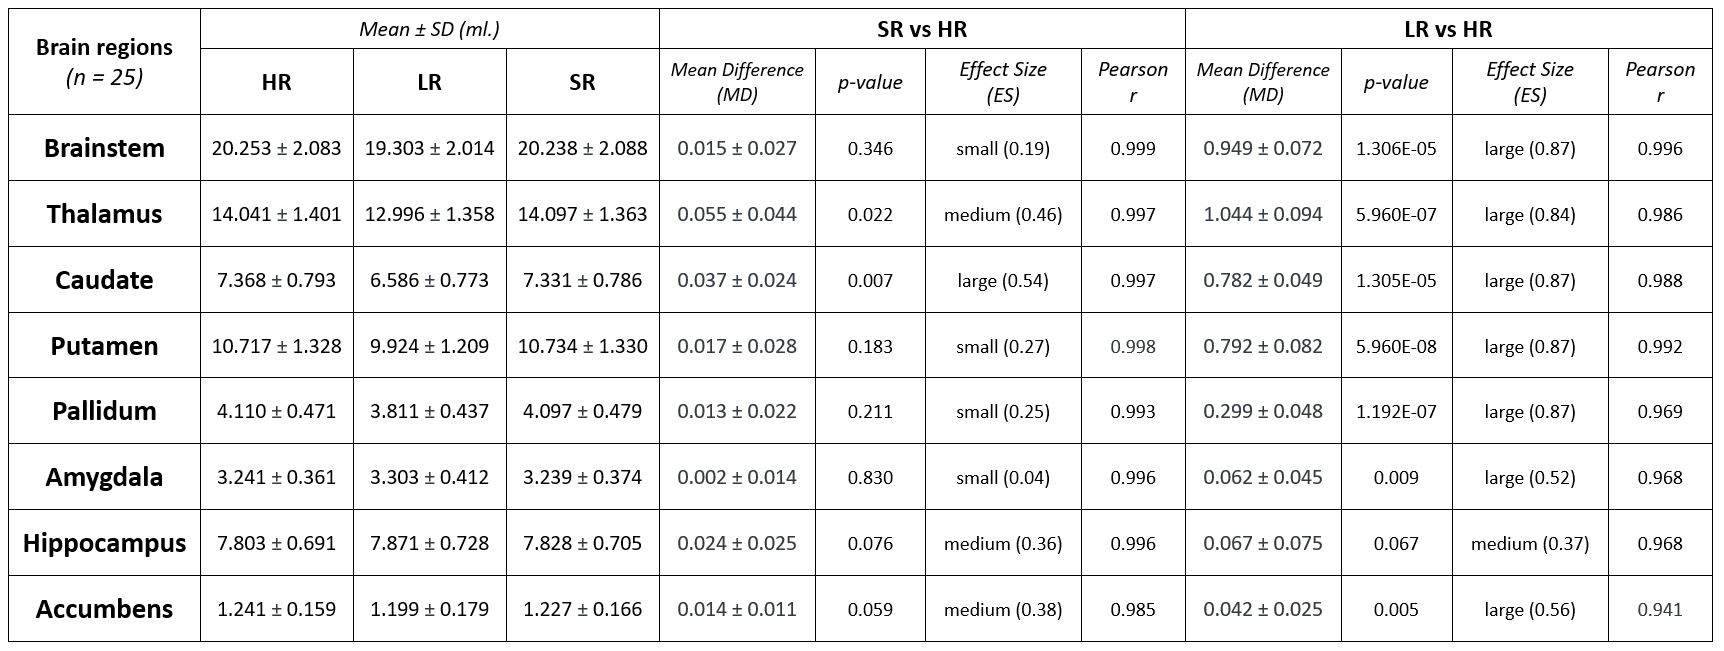
Through experiments, we demonstrated that the DL-SR model generally improves diagnostic image quality as shown in fig. 1, and calculated perceptual quality metrics (PSNR: 25.885 vs 24.679, NRMSE: 0.051 vs 0.059, SSIM: 0.961 VS 0.951) in fig. 2 and table 1. Moreover, table 2 showed volumes of subcortical regions (i.e., brain stem, thalamus, caudate, putamen, pallidum, amygdala, hippocampus, and accumbens) in millimetres. There were no significant differences (p>0.01) in quantitative volumetric measurement between HR and SR at subcortical regions, except for caudate region. In contrast, the significant differences (p<0.01) between HR and LR were found at almost regions, excluding hippocampus region.Discussion
In this study, we implemented RDN which was capable of transforming low-resolution brain MRI into high-resolution images which were able to maintain diagnostic image quality and accuracy of BVM. However, some issues should be explored further. Firstly, other advanced networks7-9 may further improve image resolution. Secondly, we used simulated LR and HR data for training rather than acquired LR. This should be achieved because it is possible for the network to learn actual acquisition artifacts that may appear when a matrix's size changes or patient motion. Finally, more training datasets from multi-vendor scanners may help the trained model become more generalized.Conclusion
The combination of CS and DL-SR techniques appears to be a potential tool for improving BVM workflow for less than one minute scanned data at clinical 1.5T MRI.Acknowledgements
We would like to thank Chiang Mai University for funding and acknowledge the support of Philips Healthcare Thailand to provide Compressed-SENSE MRI sequence and other technical support.References
1. Azevedo CJ, Cen SY, Khadka S, Liu S, Kornak J, Shi Y et.al. (2018) Thalamic atrophy in multiple sclerosis: a magnetic resonance imaging marker of neurodegeneration throughout disease. Ann Neurol 83(2):223–234
2. Pini L, Pievani M, Bocchetta M, Altomare D, Bosco P, Cavedo E et.al (2016) Brain atrophy in Alzheimer’s Disease and aging. Ageing Res Rev 30:25–48
3. Pruessmann KP, Weiger M, Scheidegger MB, Boesiger P (1999) SENSE: sensitivity encoding for fast MRI. Magn Reson Med 42(5):952–962
4. Yarach Uten, Saekho Suwit, Setsompop Kawin, et.al. (2021). Feasibility of Accelerated 3D T1-Weighted MRI using Compressed-SENSE: Application to Quantitative Volume Measurement of Human Brain Structures. Magnetic Resonance Materials in Physics, Biology, and Medicine. 34. 10.1007/s10334-021-00939-8.
5. Lyu, Qing & You, Chenyu & Shan, Hongming & Wang, Ge. (2018). Super-resolution MRI through Deep Learning.
6. Yulun Zhang, Yapeng Tian, et.al. (2018). Residual Dense Network for Image Super-Resolution. https://doi.org/10.48550/arXiv.1802.08797
7. Chaudhari, AS, Fang, Z, Kogan, F, et al. Super-resolution musculoskeletal MRI using deep learning. Magn Reson Med. 2018; 80: 2139– 2154. https://doi.org/10.1002/mrm.27178
8. Zhu D, Qiu D. Residual dense network for medical magnetic resonance images super-resolution. Comput Methods Programs Biomed. 2021 Sep; 209:106330. doi: 10.1016/j.cmpb.2021.106330. Epub 2021 Aug 4. PMID: 34388684.
9. Zhou, Z, Ma, A, Feng, Q, et al. Super-resolution of brain tumor MRI images based on deep learning. J Appl Clin Med2022; 2022; e13758. https://doi.org/10.1002/acm2.13758
Figures