4185
Optimized Quantitative Susceptibility Mapping of Deep Cerebellar Nuclei using the phase of 3D-EPI Multi-Parametric Mapping at 7T1Clinical Research, DZNE Bonn, Bonn, Germany, 2DZNE Bonn, Bonn, Germany, 3Department of Neurology, Medical University of Graz, Graz, Austria, 4High Field MR Center, Department of Biomedical Imaging and Image-Guided Therapy, Medical University of Vienna, Vienna, Austria, 5Department of Neurology, University Hospital Bonn, Bonn, Germany, 6Department of Physics and Astronomy, University of Bonn, Bonn, Germany
Synopsis
Keywords: Susceptibility, Quantitative Susceptibility mapping
RF transmit field inhomogeneities at 7T usually degrade the image quality in regions such as the cerebellum and brainstem, which has so far delayed its use to study cerebellar ataxias with higher fields. We present an optimized pipeline that maximizes the QSM contrast of nuclei in the cerebellum based on multi-echo MPM data. We show that averaging the individual susceptibility maps increases the signal-to-noise ratio (SNR) and reduces the group standard deviation. We introduced a weighted averaging based on the individual acquisition SNRs. Final maps presented high contrast of the dentate nucleus and a high delineation of its denticulated silhouette.Introduction
Quantitative Susceptibility Mapping (QSM) can quantitatively assess iron concentration in the brain. In spinocerebellar ataxias (SCAs), the deep cerebellar nuclei are core areas of early neurodegeneration and therefore of particular interest1. Ultra-high field MRI allows an increased resolution compared to 3T. However, RF-transmit field inhomogeneities at 7T prevented its exploitation to study cerebellar-related disorders, such as SCAs, to a larger extent. Overcoming these challenges by utilizing universal pTx pulses2 at 7T may have direct translational impact on SCAs. In the current pilot study, we hypothesize that high-resolution QSM will enhance the sensitivity and specificity to delineate cerebellar structures. We optimized a pipeline for QSM processing of Multi-Parametric Mapping (MPM) data with a focus on infratentorial structures, in particular, to explore high-resolution quantitative imaging of deep cerebellar nuclei at 7T.Methods
Three female healthy controls (31, 35, and 26 years old) were imaged on a Siemens MAGNETOM 7T Plus scanner using a 32-channel receive, 8-channel transmit coil (Nova Medical). Data was acquired using a multi-echo skipped-CAIPI2 3D EPI-based MPM3 sequence with magnetization transfer (MT), proton density (PD) and T1 contrasts. Each subject was measured once using CP-mode water excitation pulses4 and once using universal interleaved binomial kT-points excitation pulses5. Sequence parameters were: 0.6 mm isotropic resolution; TA=15:04 min; TE=[5.3,12.2,19.1,26.0] ms; TR of 48, 34.5, 34.5 ms and nominal flip angle (FA) of 6, 4, 25° for MTw, PDw, and T1w images, respectively. For each contrast, the susceptibility maps were individually calculated using the following steps:- quantitative unwrapping and multi-echo phase combination with ROMEO6 (using the spatially unwrapped first echo as the template for temporal unwrapping; mask generation using the “robust mask” and phase offset correction);
- conversion from dB0 to wrapped phase at a nominal TE of 10ms;
- QSM reconstruction with QSMxT7 (in which brain masks were generated for each contrast based on the corresponding magnitude with a threshold of 25, 25 and 40% for MTw, PDw, and T1w, respectively).
- Finally, we averaged the three QSM maps with different weight combinations, aiming to reduce noise and therefore to increase susceptibility contrast-to-noise ratio.
Results
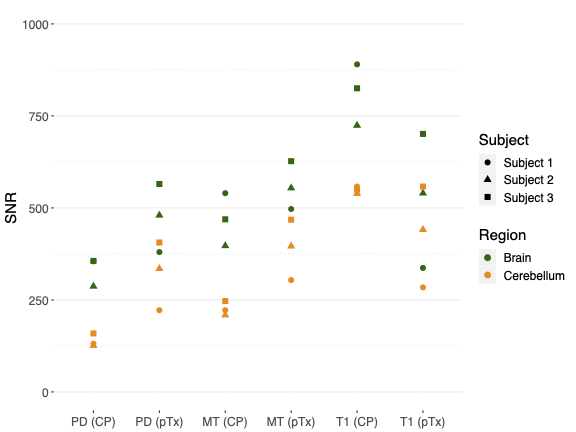
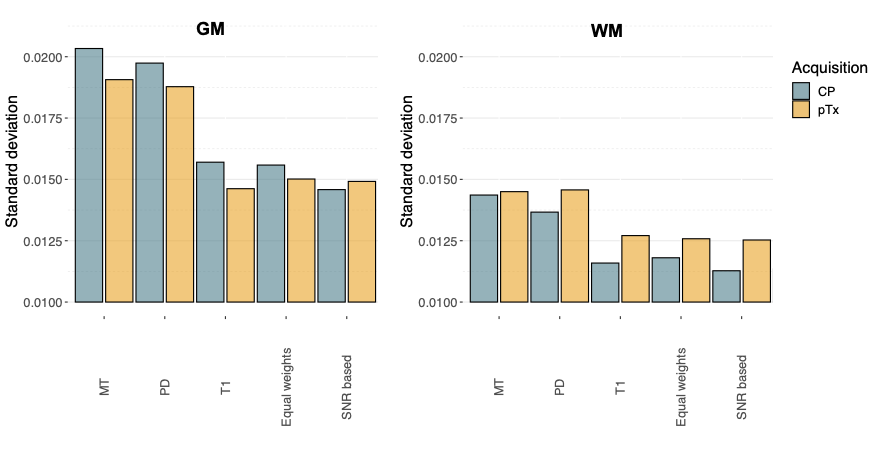
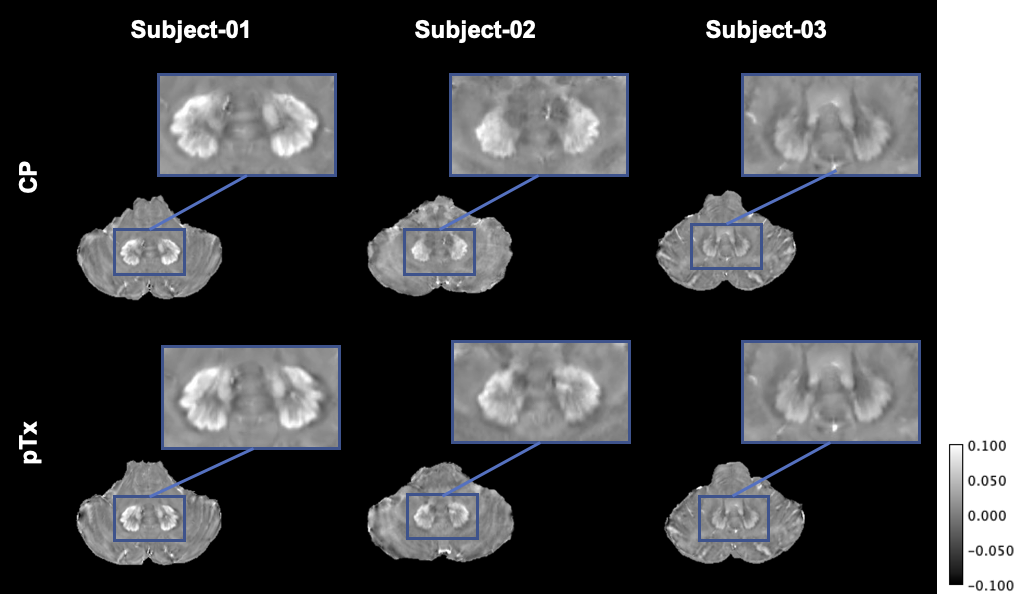
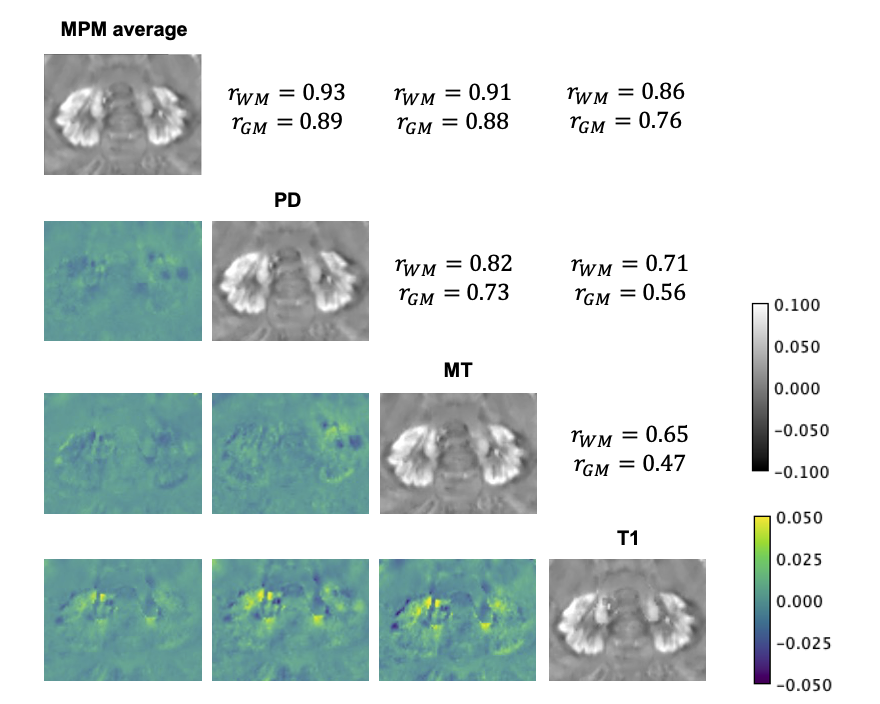
SNR estimates for each subject are shown in Figure 1. Figure 2 shows the standard deviations (SDs) of the susceptibility values for GM and WM. In all subjects, the dentate nucleus can be easily identified, and a high detail level of the denticulated silhouette can be seen in Figure 3. Motion artifacts were found in subject 2. For each pair of QSM maps of different MPM contrasts (diagonal, Figure 4), the Pearson correlation coefficient (r) of the susceptibility was calculated within the WM and GM masks. Similarly, differences between the weighted averaged QSM map and each individual QSM map were calculated.Discussion
In Figure 1, the image magnitude SNR was found to be higher for both PDw and MTw when using pTx compared to CP excitation. In T1w, CP leads to higher SNR in the whole brain (including the cerebellum) than pTx, as the actual CP-mode FA is closer to the signal-maximizing Ernst angle. This effect is less pronounced in the cerebellum. The final QSM maps were averaged to minimize noise. We included equal weighting and SNR-based weights and calculated the standard deviations of the susceptibility values in GM and WM using CP and pTx. GM was found to have a higher standard deviation compared to WM (Figure 2). Increased variance due to residual inversion artifacts close to the outer brain boundary may play a larger role in the standard deviation in the GM mask than in the WM mask. Averaging the individual QSM maps with SNR-based weights resulted in a lower standard deviation in WM compared to equal weights, albeit not as clearly for the pTX data as for the CP data. Interestingly, overall WM susceptibility standard deviation was larger for pTX data than for CP data, both on the individual contrasts and after averaging. Further investigations are required on this. In all subjects, the dentate nucleus could be identified and a high detail level of its denticulated silhouette was found (Figure 3). Visually, differences between equal weighting and SNR-based weights were little. WM was shown to have higher r than GM in all comparison pairs. This could be driven by the overall increased standard deviation level of GM. The lowest differences were found between the SNR-based averaged QSM maps and the QSM map reconstructed from PD. T1 was shown to have the lowest r in GM as well as the highest susceptibility differences (bottom row). This could be due to arterial blood signal contributing much stronger in the T1 contrast than in the other contrasts. The major differences between the pairs center adjacent to the silhouette of the dentate nucleus and the superior cerebellar peduncles, likely with contributions from the rhomboidal artery.Conclusions
The developed pipeline maximizes QSM contrast-to-noise ratio of a multi-echo MPM measurement. We have shown high delineation of the silhouette of the dentate nucleus of the cerebellum.Acknowledgements
This work received financial support from the European Union Horizon 2020 Research and Innovation program under grant agreement 885876 (AROMA) and through the German Federal Ministry of Education and Research (BMBF; funding code 01ED2109A) as part of the SCAIFIELD project under the aegis of the EU Joint Programme - Neurodegenerative Disease Research (JPND) (www.jpnd.eu).References
1. Deistung, A.; Jäschke, D.; Draganova, R.; Pfaffenrot, V.; Hulst, T.; Steiner, K. M.; Thieme, A.; Giordano, I. A.; Klockgether, T.; Tunc, S.; Münchau, A.; Minnerop, M.; Göricke, S. L.; Reichenbach, J. R.; Timmann, D. Quantitative Susceptibility Mapping Reveals Alterations of Dentate Nuclei in Common Types of Degenerative Cerebellar Ataxias. Brain Commun. 2022, 4 (1), fcab306. https://doi.org/10.1093/braincomms/fcab306.
2. Gras, V.; Vignaud, A.; Amadon, A.; Bihan, D.; Boulant, N. Universal Pulses: A New Concept for Calibration‐free Parallel Transmission. Magn. Reson. Med. 2017, 77 (2), 635–643. https://doi.org/10.1002/mrm.26148.
3. Weiskopf, N.; Suckling, J.; Williams, G.; Correia, M. M.; Inkster, B.; Tait, R.; Ooi, C.; Bullmore, E. T.; Lutti, A. Quantitative Multi-Parameter Mapping of R1, PD*, MT, and R2* at 3T: A Multi-Center Validation. Front. Neurosci. 2013, 7. https://doi.org/10.3389/fnins.2013.00095.
4. Stirnberg, R.; Brenner, D.; Stöcker, T.; Shah, N. J. Rapid Fat Suppression for Three-Dimensional Echo Planar Imaging with Minimized Specific Absorption Rate: Rapid, Minimum-SAR Fat Suppression. Magn. Reson. Med. 2016, 76 (5), 1517–1523. https://doi.org/10.1002/mrm.26063.
5. Löwen, D.; Pracht, E. D.; Stirnberg, R.; Liebig, P.; Stöcker, T. Interleaved Binomial k T ‐points for Water‐selective Imaging at 7T. Magn. Reson. Med. 2022, 88 (6), 2564–2572. https://doi.org/10.1002/mrm.29376.
6. Dymerska, B.; Eckstein, K.; Bachrata, B.; Siow, B.; Trattnig, S.; Shmueli, K.; Robinson, S. D. Phase Unwrapping with a Rapid Opensource Minimum Spanning Tree Algorithm (ROMEO). Magn. Reson. Med. 2021, 85 (4), 2294–2308. https://doi.org/10.1002/mrm.28563.
7. Stewart, A. W.; Robinson, S. D.; O’Brien, K.; Jin, J.; Widhalm, G.; Hangel, G.; Walls, A.; Goodwin, J.; Eckstein, K.; Tourell, M.; Morgan, C.; Narayanan, A.; Barth, M.; Bollmann, S. QSMxT: Robust Masking and Artefact Reduction for Quantitative Susceptibility Mapping; preprint; Neuroscience, 2021. https://doi.org/10.1101/2021.05.05.442850.
8. Statistical Parametric Mapping: The Analysis of Funtional Brain Images, 1st ed.; Friston, K. J., Ed.; Elsevier/Academic Press: Amsterdam ; Boston, 2007.
Figures