4183
Design of Quadrature RF Coil for Calcium Susceptibility Imaging in Small Tissue Samples
Jacob Degitz1, Edith Valle2, Steven M Wright2, and Mary P McDougall1
1Biomedical Engineering, Texas A&M University, College Station, TX, United States, 2Electrical Engineering, Texas A&M University, College Station, TX, United States
1Biomedical Engineering, Texas A&M University, College Station, TX, United States, 2Electrical Engineering, Texas A&M University, College Station, TX, United States
Synopsis
Keywords: Susceptibility, Non-Array RF Coils, Antennas & Waveguides
One of the earliest significant events in Duchenne muscular dystrophy (DMD) pathology is an elevated influx of calcium ions into afflicted cells. To study this event and its correlation with disease progression, a custom 22mm diameter quadrature volume coil was designed and used to obtain 1H images at 4.7T, the processing protocol was established, and comparisons were made to μCT images.Introduction
One of the first events in Duchenne muscular dystrophy (DMD) pathology is an increase in the intracellular calcium concentration ([Ca2+]i), leading to necrosis1. As this is a consistent event and results in calcifications in DMD animal models2,3, [Ca2+]i could serve as an early biomarker of disease progression. Magnetic resonance imaging (MRI) of calcifications is often performed with advanced susceptibility imaging techniques, such as susceptibility weighting imaging (SWI)4. However, this technique has not yet been implemented in the study of DMD calcifications or homologous animal models. Our research group has access to a cohort of golden retriever muscular dystrophy (GRMD) tissue samples, a commonly used DMD animal model. This enabled us to perform SWI on GRMD calcifications; however, with an average volume of one cubic centimeter, a highly sensitive coil was required, especially due to our technique of choice being SWI. Therefore, to study this biomarker in GRMD model of DMD, we constructed a custom 1H quadrature volume coil for SWI imaging at 4.7T.Methods
HardwareGiven the small dimensions, a Helmholtz pair orthogonal to a saddle coil was the preferred design to straightforwardly generate sensitive quadrature fields. Both coils were constructed from 16AWG enameled copper wire. The Helmholtz pair had a radius and spacing of 19.5mm, while the saddle coil had a radius of 11mm and a height of 39.5mm (Figure 1). A combination of fixed and variable capacitors were used to match and tune the coil to 1H (200MHz) at 4.7T, and standard cable traps were placed in-line to reduce common-mode currents. A 3D printed former was used to place coil traces and allow easy tissue sample exchange from outside the magnet bore. Bench measurements were taken to analyze coil matching (S11), decoupling between coils (S21), and quality factor (Q).
Data Acquisition
A Cu2SO4 phantom was used to evaluate excitation homogeneity and perform B1 mapping via the dual angle method, with tip angles of 60° and 120°. Then, 20 ex vivo bicep femoris samples (12 GRMD, 8 normal) ranging from <1 month to 15 months of age were submerged in Dulbecco's phosphate-buffered saline (DPBS) to limit boundary susceptibility artifacts. Air bubbles at the air-liquid and liquid-tissue boundaries were removed with a needle, though some managed to survive to the imaging process. The samples were then imaged via multi-slice spin-echo (SE) and gradient-echo (GRE) sequences at a 90μm resolution. All imaging was performed on a Varian Inova 4.7T/33cm research scanner. Additionally, to better distinguish between bubbles and calcifications, and to provide a better understanding of tissue geometry without susceptibility effects, μCT images of the tissue samples were acquired at a resolution of 69μm.
Post-Processing
B1 mapping was performed via the dual-angle processing method5. After undergoing high-pass filtering, the GRE phase images were 3D phase unwrapped6,7. Binary masks were constructed by simple thresholding of the SE images with manual touch ups. Background field removal was performed through the projection onto dipole fields (PDF) technique8,9. A standard phase mask was then produced according to 4, which was then multiplied four times by the GRE magnitude image to produce the final SWI image.
Results and Discussion
Bench MeasurementsWhen separated, the Helmholtz pair and saddle coil produced S11 values of -35dB and -37dB, respectively, demonstrating effective matching and tuning. The separated Helmholtz pair had a Q value of 385, and the saddle coil had a Q value of 333. When combined, S11 measurements were -45dB for the Helmholtz pair and -26dB for the saddle coil. Q values remained better than 300, with the Helmholtz pair Q decreasing to 346 and the saddle coil Q decreasing to 319. Decoupling between the two was confirmed with an S21 value of -26dB. This was further ensured by sensitivity measurements taken at the center of the coils, with the Helmholtz pair and saddle coil producing values of -30dB/-8.5dB and -9dB/-38dB, respectively. B1 mapping (Figure 2) demonstrated homogeneous field sensitivity along the axial and coronal planes in quadrature mode. Specifically, the coil field had 0.32% variation within a 2cm2 axial region. Furthermore, a minimal transmit power level of 8dB to achieve a 90-degree tip angle confirmed coil efficiency, as the required power was equal to that of a saddle coil of comparable size (11.5mm radius, 24mm height).
Imaging and Data Processing
Initial analysis of the GRE images demonstrated that the coil was highly sensitive to magnetic susceptibility (Figure 3). Phase effects from these artifacts were successfully removed by PDF, though the technique resulted in some boundary artifacts as is typically the case with background removal algorithms4. The SWI images revealed small points of extreme phase peppered throughout GRMD tissue samples, most notably in the tissue sample shown in Figure 4. The μCT image of the same tissue also demonstrated small accumulations of high-density tissue.
Conclusion
We have demonstrated the effectiveness of the custom quadrature RF coil at analyzing susceptibility in small tissue samples. This was confirmed via comparison with μCT images. Future steps will be to finalize SWI processing of MRI images, after which they will be further compared to μCT images.Acknowledgements
The authors appreciate funding provided by the National Institute of Health through grants R01EB028533 and R01EB028533-02S1.References
- Nowak KJ, Davies KE. Duchenne muscular dystrophy and dystrophin: pathogenesis and opportunities for treatment. EMBO reports. 2004;5(9):872-876.
- Bozycki L, Łukasiewicz K, Matryba P, Pikula S. Whole-body clearing, staining and screening of calcium deposits in the mdx mouse model of Duchenne muscular dystrophy. Skeletal Muscle. 2018;8(1):21.
- Kornegay JN, Bogan JR, Bogan DJ, et al. Canine models of Duchenne muscular dystrophy and their use in therapeutic strategies. Mamm Genome. 2012;23(1-2):85-108.
- Ruetten PPR, Gillard JH, Graves MJ. Introduction to Quantitative Susceptibility Mapping and Susceptibility Weighted Imaging. Review. The British Journal of Radiology. 2019;92(1101):20181016.
- Insko E, Bolinger L. Mapping of the Radiofrequency Field. JMR. 1993;103(1):82-85.
- Li W, Wu B, Liu C. Quantitative susceptibility mapping of human brain reflects spatial variation in tissue composition, NeuroImage. 2011;15; 55:1645-1656.
- Wu B, Li W, Guidon A, Liu C. Whole brain susceptibility mapping using compressed sensing. Mag Res Med. 2012;67(1):137-147.
- Liu T, Khalidov I, De Rochefort L, et al. A novel background field removal method for MRI using projection onto dipole fields (PDF). NMR Biomed. 2011;24(9):1129-1136.
- De Rochefort L, Liu T, Kressler B, et al. Quantitative susceptibility map reconstruction from MR phase data using bayesian regularization: Validation and application to brain imaging. Magn Reson Med. 2010;63(1):194-206.
Figures
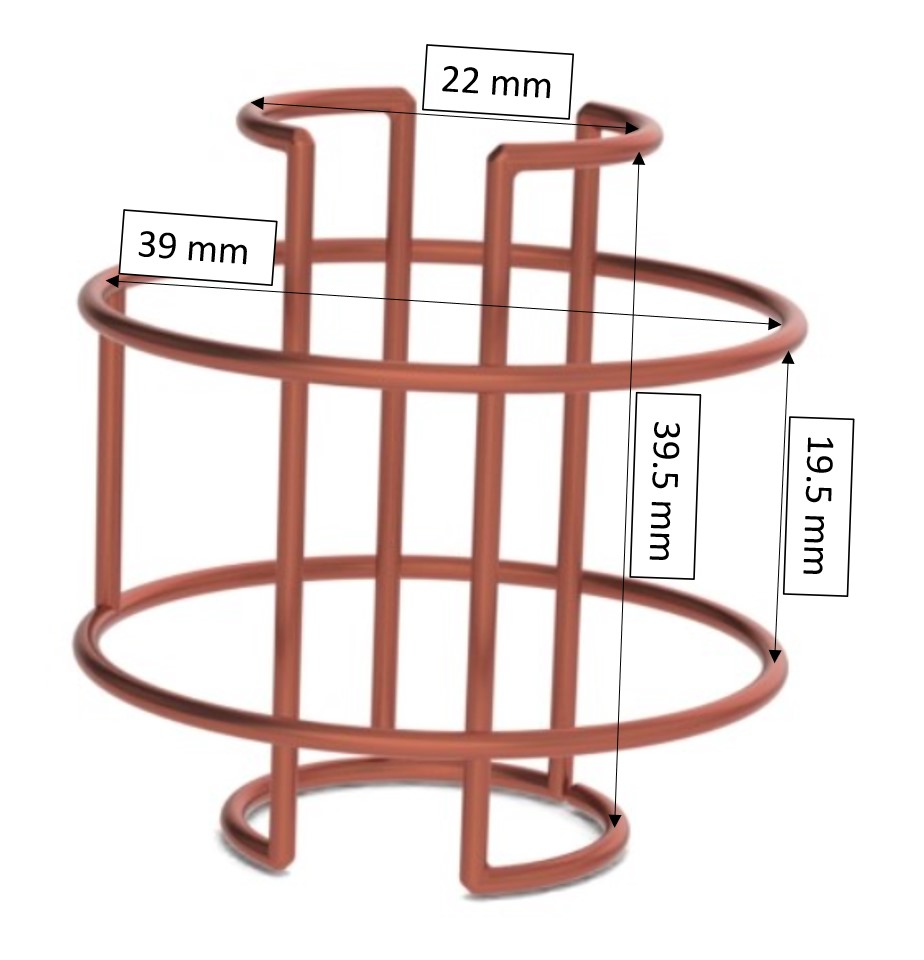
Figure 1: Rendering of Helmholtz
pair and saddle coil, along with dimensions.
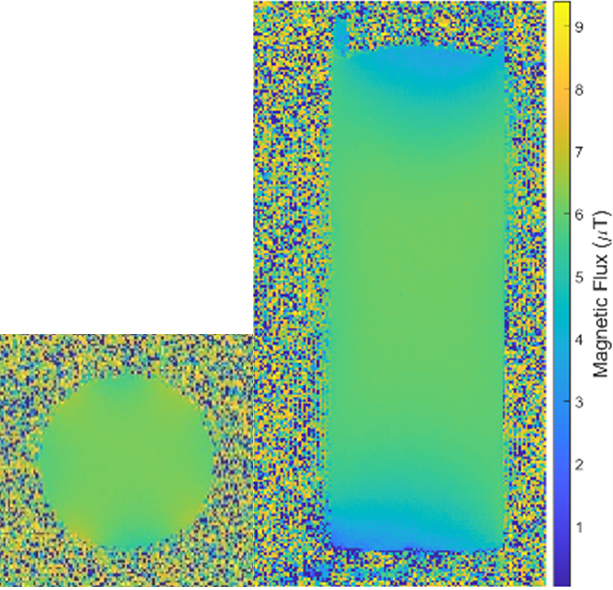
Figure 2: Coronal and axial B1
maps obtained via the dual-angle method.
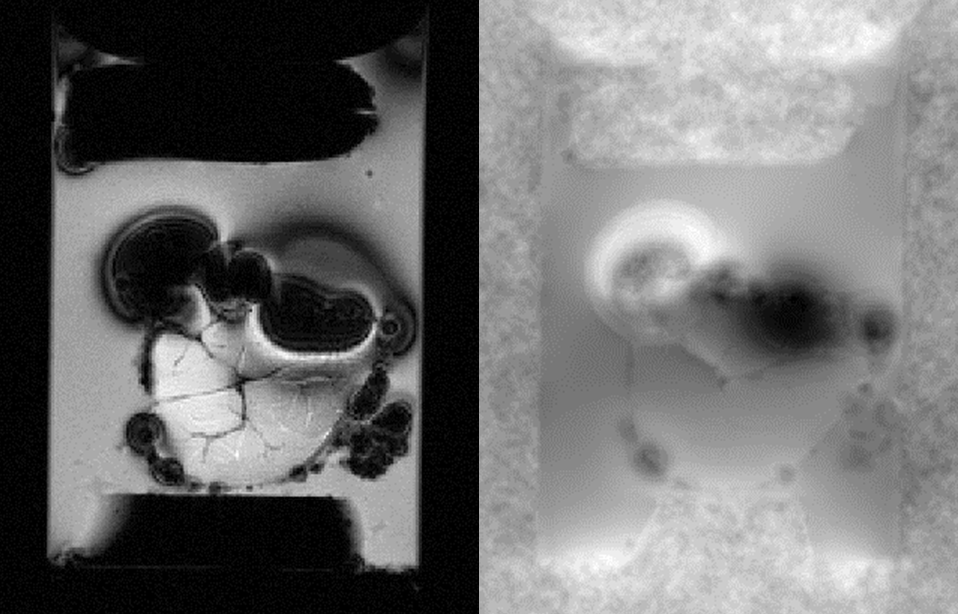
Figure 3: 90μm GRE magnitude
(left) and phase (right) of unafflicted tissue sample. The significant
artifacts caused by air bubbles demonstrates coil sensitivity to susceptibility
sources.
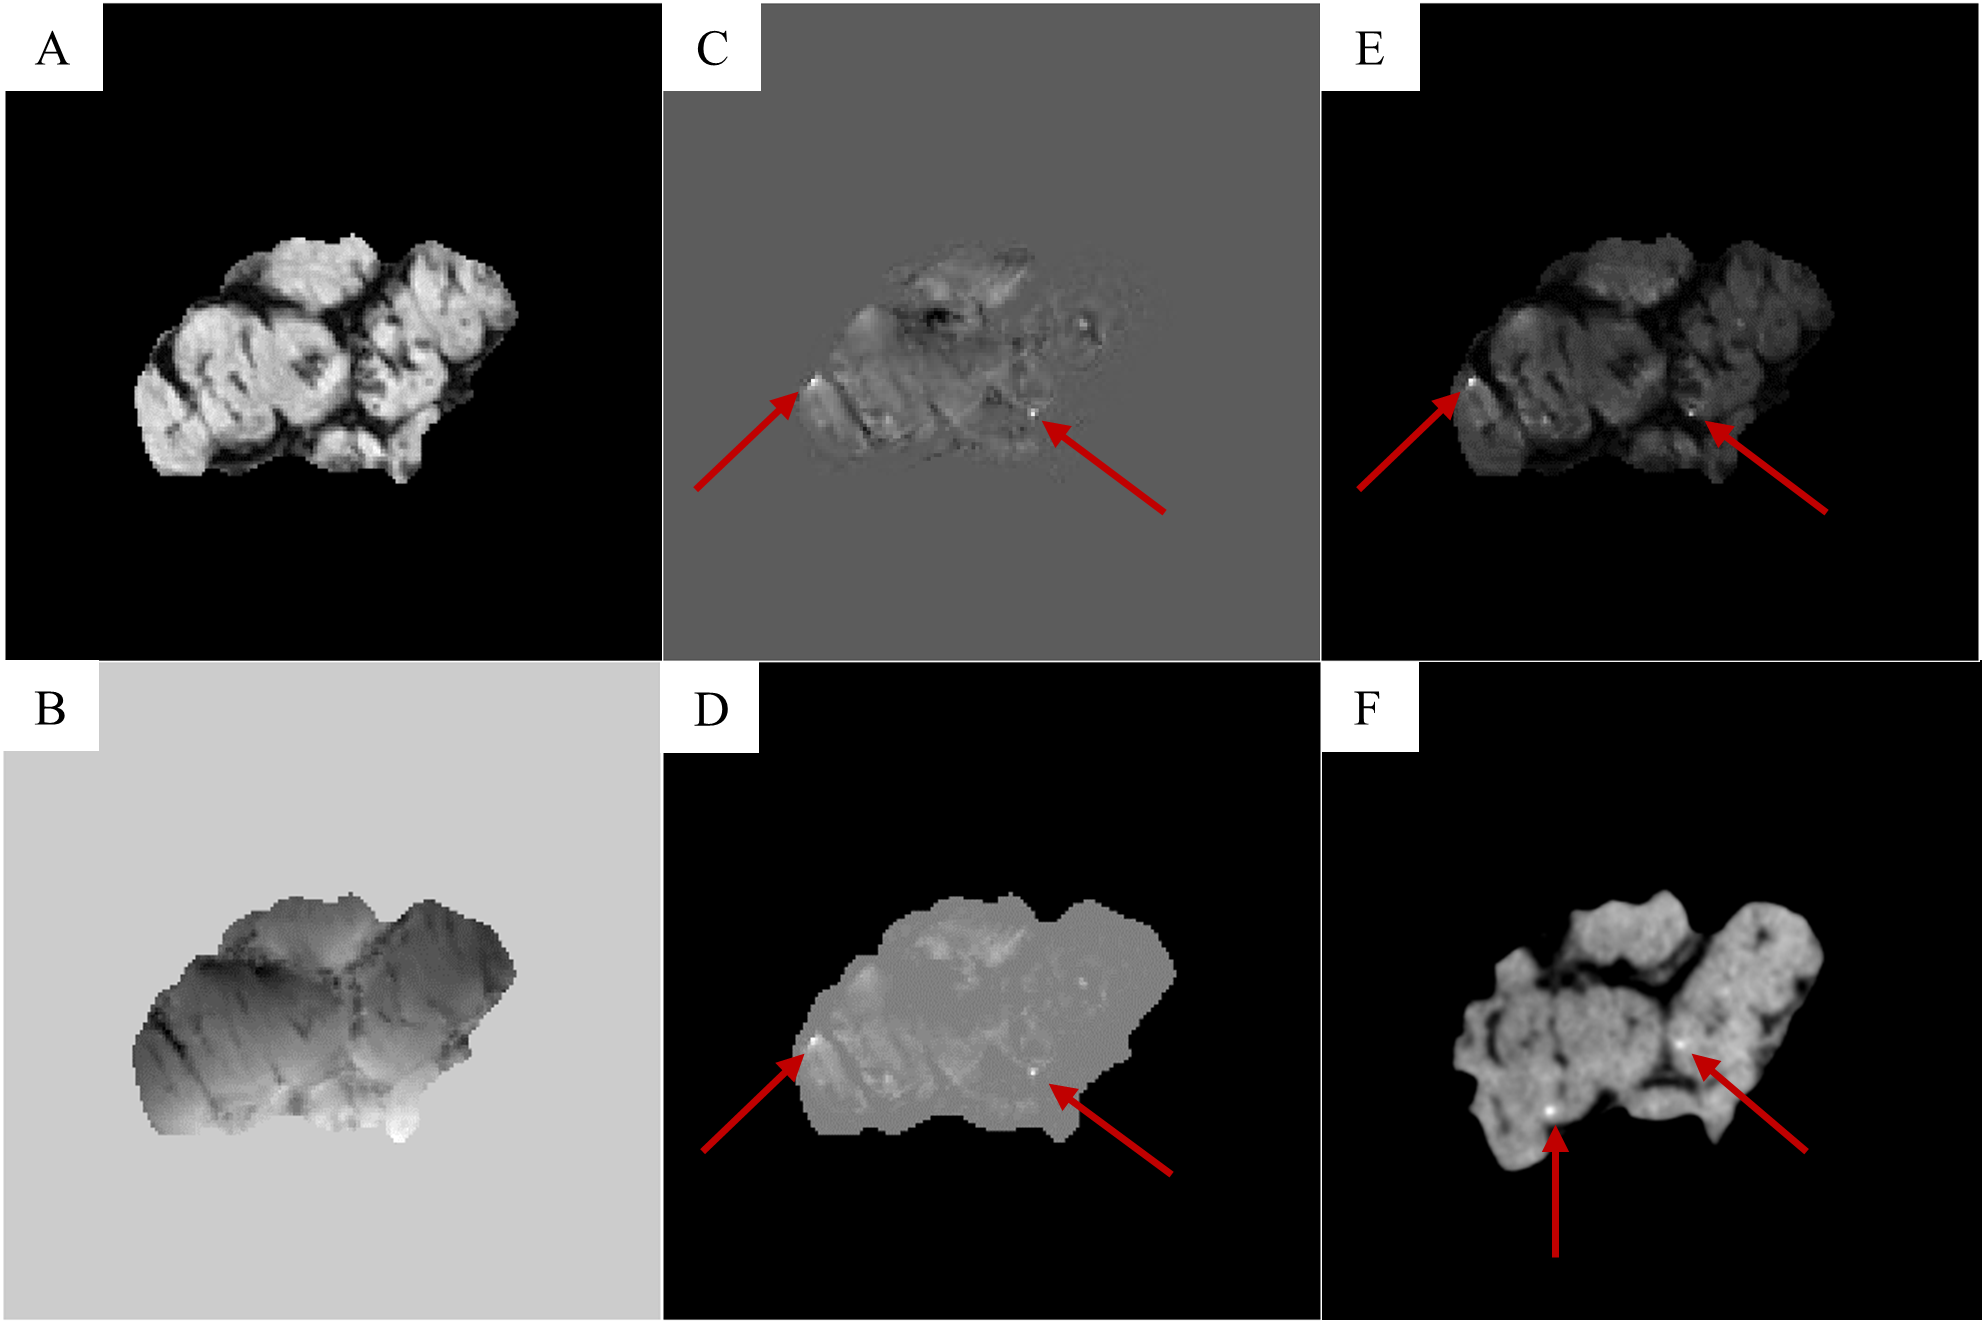
Figure 4: 90μm MRI images (A-E)
of a GRMD tissue sample demonstrating the SWI process, along with a 69μm μCT
image (F) for modality comparison. The phase MRI image undergoes filtering and
unwrapping (B), followed by background field removal (C). The local field is
then converted into a phase mask (D), which is then multiplied by the magnitude
(A) to produce the SWI image (E). Red arrows indicate possible calcifications.
DOI: https://doi.org/10.58530/2023/4183