4181
Imaging the cerebral cortex and substantia nigra in vivo using high-resolution quantitative susceptibility mapping at 5.0-T
Ming Zhang1, Lanlan Gao2, Shuheng Zhang2, and Hongjiang Wei1
1School of Biomedical Engineering, Shanghai Jiao Tong University, Shanghai, China, 2United Imaging Healthcare, Shanghai, China
1School of Biomedical Engineering, Shanghai Jiao Tong University, Shanghai, China, 2United Imaging Healthcare, Shanghai, China
Synopsis
Keywords: Susceptibility, Quantitative Susceptibility mapping, cerebral cortex
It is challenging to resolve the human brain microstructure using MRI due to limited SNR and poor image contrast. High-resolution quantitative susceptibility mapping (QSM) at an ultra-high magnetic field could be a useful tool for revealing the subtle structure of the brain due to intrinsic susceptibility differences between tissues. In this study, the six-layer laminae of the cerebral cortex and swallow-tail sign of SN were successfully resolved using high-resolution QSM at 5.0-T. The preliminary result could indicate the potential of high-resolution QSM for investigating the subtle structures of the human brain and related brain disorders.Introduction
Non-invasively imaging the brain microstructure is of great neuroscientific and clinical importance for understanding the human brain. The high-field MRI scanner is a valuable tool that produces excellent contrast and reveals fine anatomical structure at the sub-millimeter scale. Quantitative susceptibility mapping (QSM) computes the underlying magnetic susceptibility of each voxel and shows excellent delineation between gray-white matters due to the underlying susceptibility differences. Using high-resolution QSM may provide useful information to investigate the function, development, and pathology of the brain. QSM has been used for imaging the cytoarchitecture of the ex vivo mouse at a 10-micron resolution 1 and monitoring the structure change in the white matter of the developing mouse with a resolution of 60 microns 2 both at 9.4-T small animal scanners. However, mapping the susceptibility of human microstructure in vivo at high resolution is still challenging, mainly due to the limited signal-to-noise ratio (SNR).3 Previous studies have shown promising results to reveal fine details of the human cortex at 7.0-T.4 In this study, we aimed to image two important brain structures, the cerebral cortex and substantia nigra (SN) based on QSM at a 5.0 Tesla MR scanner for adequate SNR. The neocortex has six layers that originated from cellular composition and density, myelination level, and iron deposition,5 while SN is a deep gray matter region rich in iron, thus providing intrinsic contrast contributors for QSM to resolve the underlying susceptibilities of the two structures.Methods
In vivo human MR imagingMRI data of one healthy male subject were collected using a 5.0-T MRI scanner (uMR Jupiter, United Imaging Healthcare, Shanghai, China) equipped with a 48-channel phased array coil for adequate SNR. A small portion of the parietal lobe region was scanned using a 2D gradient-echo sequence (GRE) with the following parameters: axial view; TR=450 ms; flip angle=40°; TE1/TE2/TE3/TE4/TE5=6.23/11.36/16.49/21.62/26.75 ms; slice thickness=3 mm; slices number=12; image matrix=1122x1248; in-plane resolution=0.16x0.16 mm2; GRAPPA factor=2 (in the phase-encoding direction); bandwidth (BW)=180 Hz/pixel; 3 averages; total scan time=13 min 2 s. The SN region was scanned using a 3D GRE sequence. The scanning parameters were; TR=30 ms; flip angle=10°; TE1/TE2/TE3/TE4=4.1/9.3/14.5/19.7 ms; image matrix=514x448x46; image resolution=0.5x0.5x1 mm3; GRAPPA factor=2; BW=200 Hz/pixel; 2 averages; scan time=15 min 8 s.
Data post-processing
The undersampled k-space data were reconstructed using the GRAPPA method. The phase data from each coil was unwrapped and combined.6 A BM4D filter 7 was applied to denoise the magnitude and unwrapped phase images to enhance SNR. The tissue phase was estimated using V_SHARP 8 and the susceptibility map was finally reconstructed using STAR-QSM.9 The diamagnetic/paramagnetic susceptibility map-weighted imaging map (dSMWI/pSMWI) 10 was also computed.
Results
Fig 1 shows the results for imaging the cerebral cortex. The six-layer structure of the cortical cortex could be observed in QSM (Fig 1(f)). The layer-specific susceptibility pattern could be observed based on the cortical susceptibility profile.Fig 2 shows the results using SMWI for visualizing the cortical vasculature. In the paramagnetic SMWI map, the veins on the cortical surface and intracortical veins crossing the cortex could be clearly revealed.
Fig 3 shows the results for imaging the SN structure. The swallow-tail sign of SN was observed as hypointensities in the QSM map.
Discussion
The SNR was expected to increase proportionally with the magnetic field. The SNR at 5.0-T was theoretically about 1.7 times that of 3.0-T and 0.7 times that of 7.0-T. However, a higher magnetic field will lead to more inhomogeneities in the B1 field and thus less uniform excitation of tissues, the prerequisite for quantitative MRI techniques, including QSM based on phase signal.11 This issue is not negligible at 7.0-T compared with 5.0-T. Besides, lower cost, lower specific absorption rate (SAR), and more homogeneous B0 field are also advantages of 5.0-T compared with the 7.0-T MRI scanner. Therefore, a magnetic strength between 3.0-T and 7.0-T may be a better choice for the present MRI scanner in clinical applications.The cortical microstructure and SN were both two important structures in the human brain. The cortical cortex plays an important role in neuronal signal transfer.12 SN is associated with movement function and loss of swallow-tail sign of SN is a diagnostic image marker of Parkinson's disease.13 Ultrahigh-resolution QSM can provide more meaningful information for studying these two structures than other MRI image contrasts.
For technical consideration, since the laminar structure of the neocortex was relatively thin 14 and was thus susceptible to involuntary motion, a 2D acquisition was used for the cerebral cortex. The major limitation of this study was that the laminar cortex structure could only be seen in limited locations under the present hardware setting. A more densely packed coil may be useful for a higher SNR and image resolution at the same magnitude field.
Conclusion
In conclusion, this study demonstrated the feasibility of QSM for revealing the laminar structure of the cerebral cortex and the swallow-tail sign of SN of a healthy subject in vivo using high-resolution QSM at 5.0T.Acknowledgements
No acknowledgement found.References
1. Wei H, Xie L, Dibb R, et al. Imaging whole-brain cytoarchitecture of mouse with MRI-based quantitative susceptibility mapping. Neuroimage. 2016;137:107-115.2. Argyridis I, Li W, Johnson GA, et al. Quantitative magnetic susceptibility of the developing mouse brain reveals microstructural changes in the white matter. Neuroimage. 2014;88:134-142.
3. Trampel R, Bazin P-L, Pine K, et al. In-vivo magnetic resonance imaging (MRI) of laminae in the human cortex. NeuroImage. 2019;197:707-715.
4. Wei H, Bilgic B, Setsompop K, et al. Imaging Human Brain Cortical Substructure with Quantitative Susceptibility Mapping at 7 T. Proc Intl Soc Mag Reson Med 2018:5005.
5. Wagstyl K, Larocque S, Cucurull G, et al. BigBrain 3D atlas of cortical layers: Cortical and laminar thickness gradients diverge in sensory and motor cortices. PLoS Biol. 2020;18(4):e3000678.
6. Schofield MA, Zhu Y. Fast phase unwrapping algorithm for interferometric applications. Opt Lett. 2003;28(14):1194-1196.
7. Maggioni M, Katkovnik V, Egiazarian K, et al. Nonlocal transform-domain filter for volumetric data denoising and reconstruction. IEEE Transactions on Image Processing. 2013;22(1):119-133.
8. Wu B, Li W, Guidon A, et al. Whole brain susceptibility mapping using compressed sensing. Magn Reson Med. 2012;67(1):137-147.
9. Wei H, Dibb R, Zhou Y, et al. Streaking artifact reduction for quantitative susceptibility mapping of sources with large dynamic range. NMR Biomed. 2015;28(10):1294-1303.
10. Gho SM, Liu C, Li W, et al. Susceptibility map-weighted imaging (SMWI) for neuroimaging. Magn Reson Med. 2014;72(2):337-346.
11. Platt T, Ladd ME, Paech D. 7 Tesla and Beyond: Advanced Methods and Clinical Applications in Magnetic Resonance Imaging. Invest Radiol. 2021;56(11):705-725.
12. Whitaker KJ, Vértes PE, Romero-Garcia R, et al. Adolescence is associated with genomically patterned consolidation of the hubs of the human brain connectome. Proceedings of the National Academy of Sciences. 2016;113(32):9105-9110.
13. Blazejewska AI, Schwarz ST, Pitiot A, et al. Visualization of nigrosome 1 and its loss in PD: pathoanatomical correlation and in vivo 7 T MRI. Neurology. 2013;81(6):534-540.
14. Fischl B, Dale AM. Measuring the thickness of the human cerebral cortex from magnetic resonance images. Proc Natl Acad Sci U S A. 2000;97(20):11050-11055.
Figures
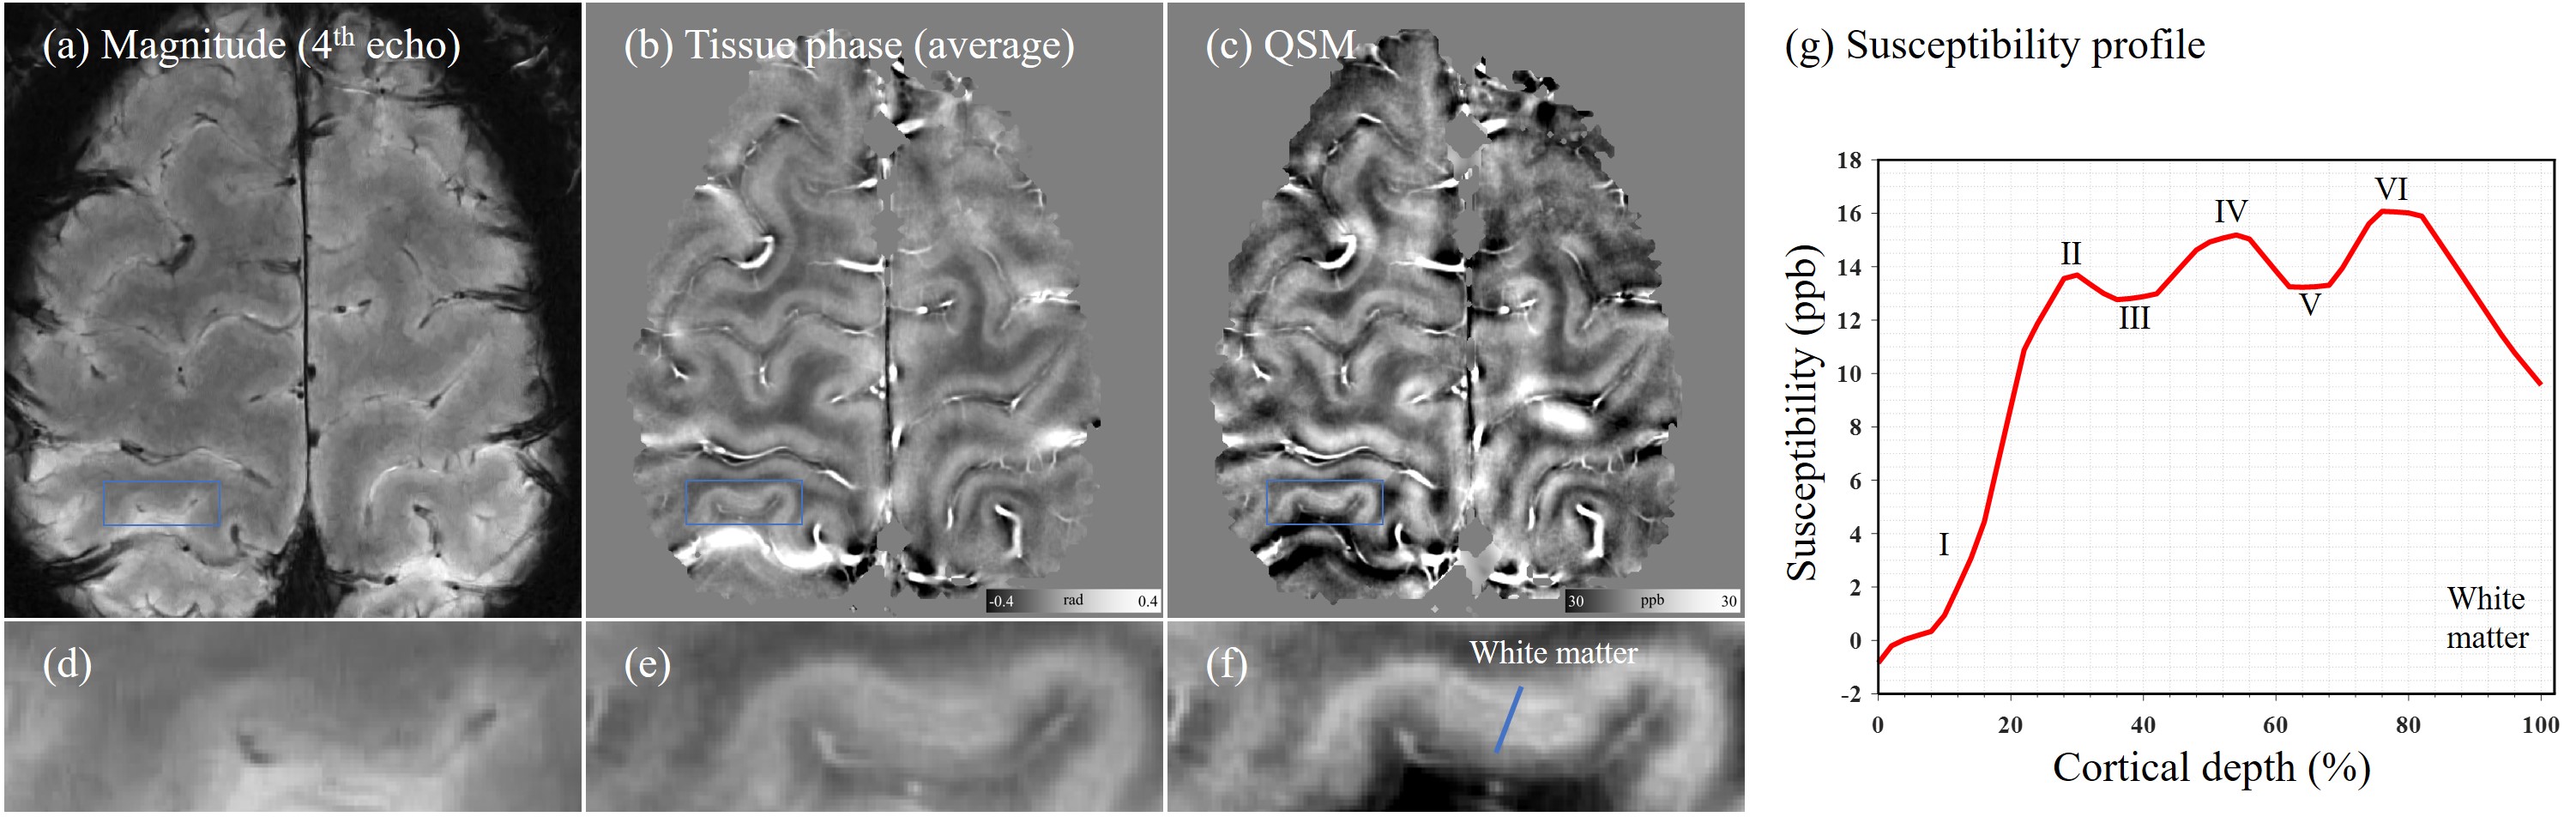
Figure 1. Illustration of magnitude, tissue phase and QSM maps for revealing the laminar structure of the cortical cortex. The QSM-based cortical profile is presented in (g).
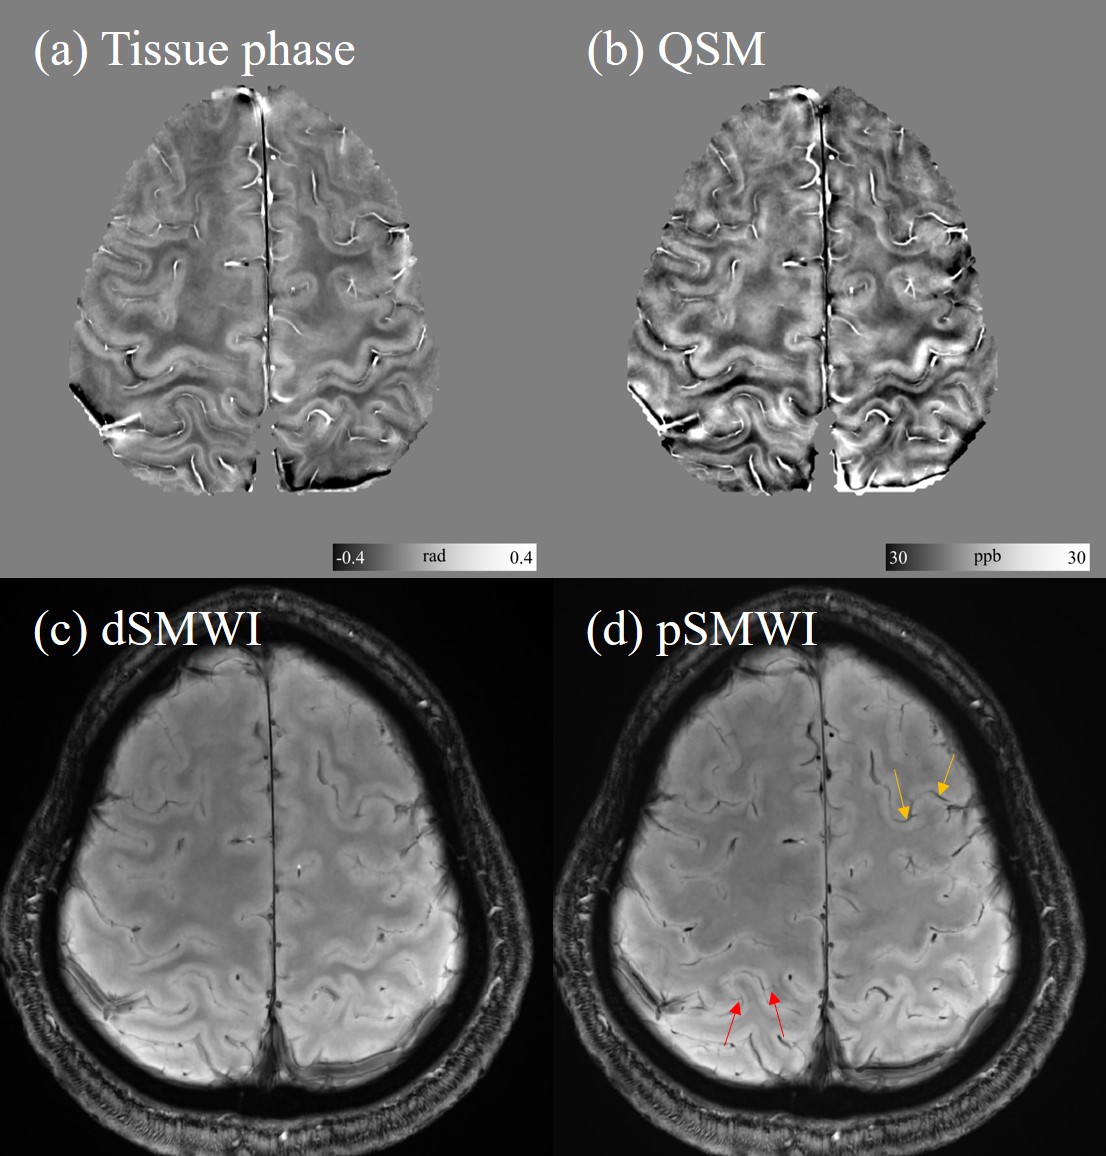
Figure 2. Representative image slice of dSMWI and pSMWI for visualizing the cortical vasculature in the cerebral cortex. The intracortical veins crossing the cortex (red arrows) and veins on the cortical surface (yellow arrows) could be observed on pSMWI.
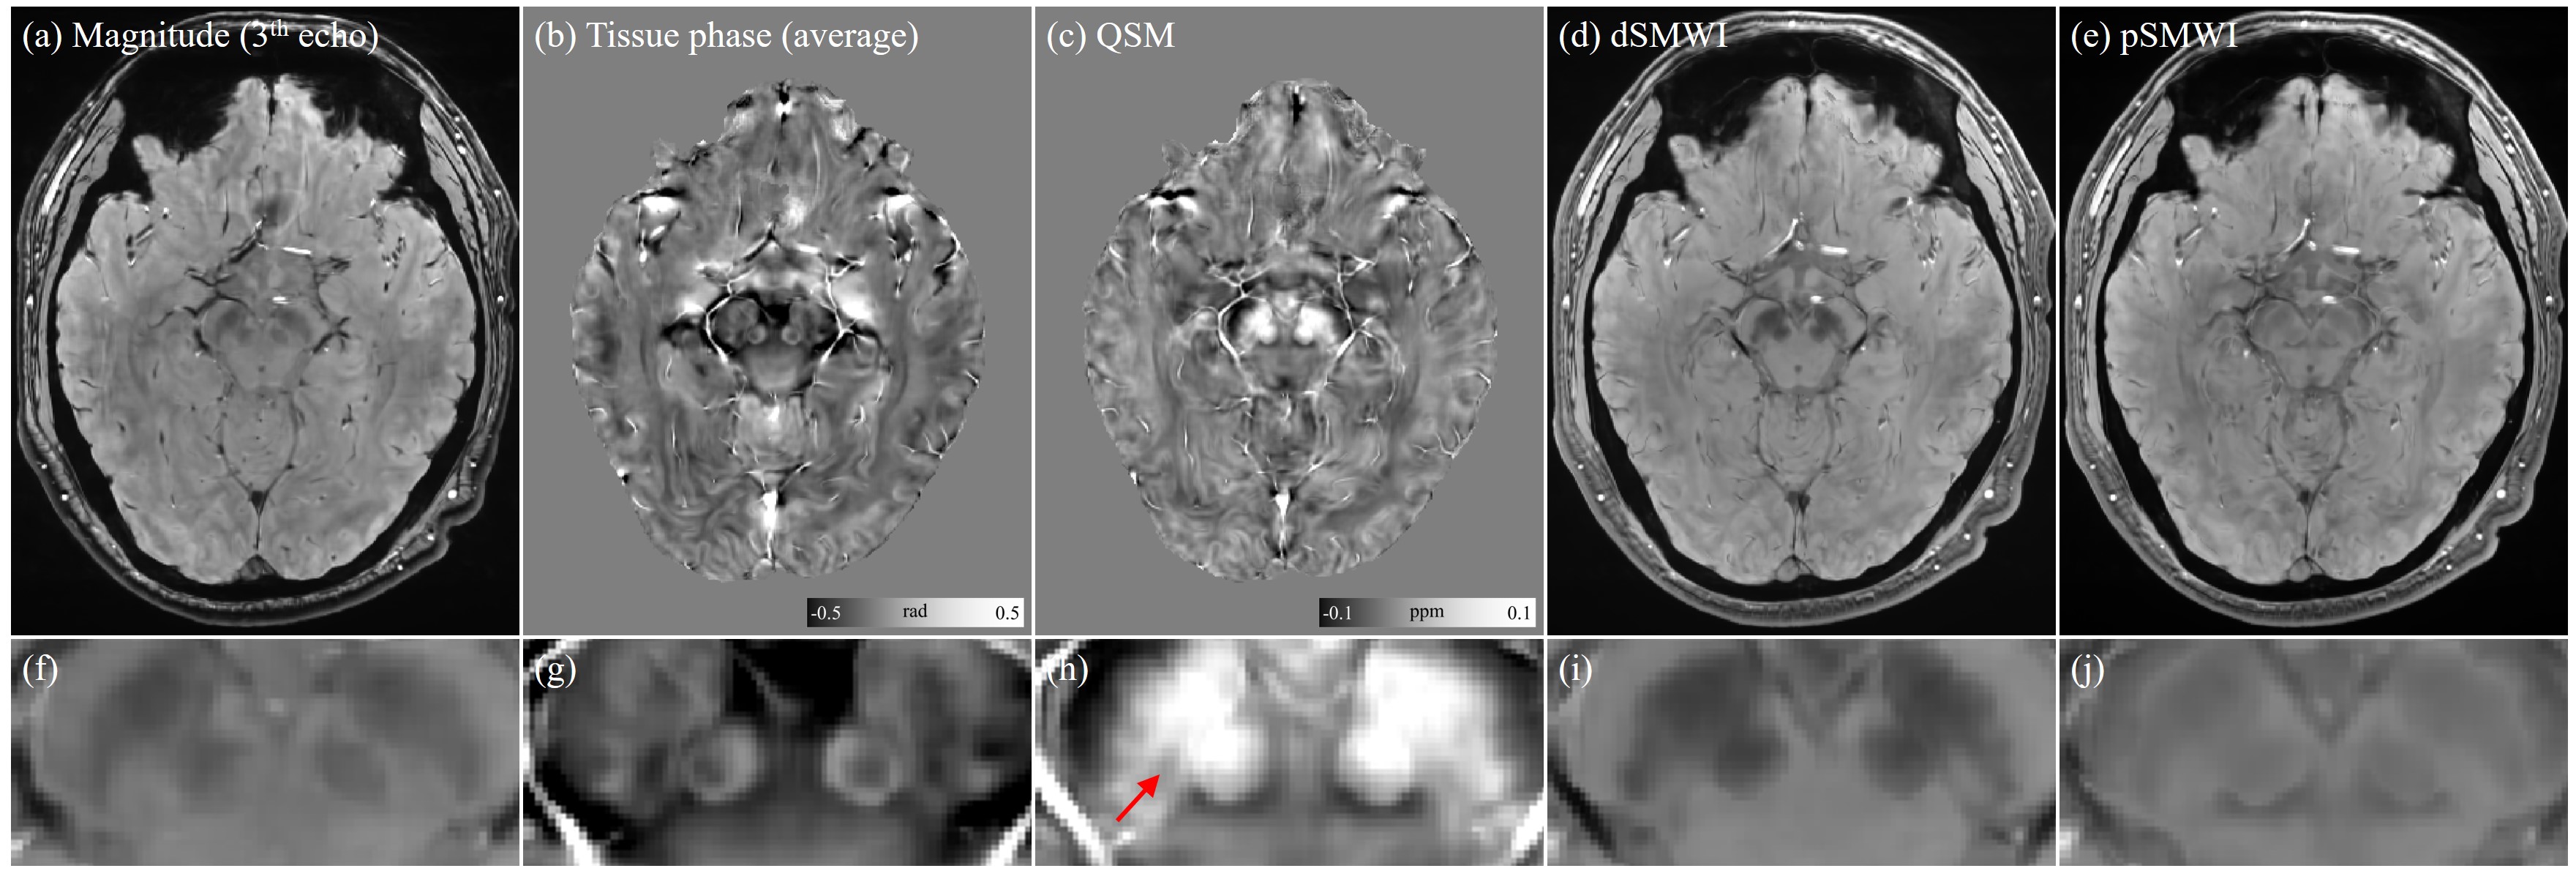
Figure 3. Representative image slice of magnitude, tissue phase, QSM, dSMWI and pSMWI for imaging SN. Hypointensities in SN in QSM were observed (indicated by a red arrow).
DOI: https://doi.org/10.58530/2023/4181