4180
INR-QSM: unsupervised quantitative susceptibility mapping using implicit neural representation
Ming Zhang1, Yuyao Zhang2, and Hongjiang Wei1
1School of Biomedical Engineering, Shanghai Jiao Tong University, Shanghai, China, 2School of Information and Science and Technology, ShanghaiTech University, Shanghai, China
1School of Biomedical Engineering, Shanghai Jiao Tong University, Shanghai, China, 2School of Information and Science and Technology, ShanghaiTech University, Shanghai, China
Synopsis
Keywords: Susceptibility, Quantitative Susceptibility mapping, implicit neural representation
This study introduced an unsupervised deep learning-based method for QSM reconstruction using implicit neural representation (INR-QSM), a training databases-free method for high-quality QSM reconstruction. In INR-QSM, the susceptibility map was represented as a continuous function of the spatial coordinates. A coordinate-based multilayer perceptron (MLP) parameterized this function, took the coordinate as input and predicted the susceptibility value at the corresponding spatial location. The parameters of MLP were updated by minimizing a custom cost function. Preliminary results on two different datasets demonstrated the potential of INR for unsupervised QSM reconstruction.Introduction
Quantitative susceptibility mapping (QSM) has shown its promise in various clinical applications, such as neurodegenerative disorders 1 and brain development.2 Solving the inversion problem from tissue phase to susceptibility is known to be an ill-conditioned problem. Recently, deep learning-based methods have shown promising results in producing high-quality QSM images. However, most of them typically need a large amount of data and high-quality QSM labels during training.3 To address this problem, we proposed an unsupervised and training database-free deep learning method for QSM reconstruction. The key idea behind the proposed method comes from the implicit neural representation (INR),4 a recently developed approach that provides new insights into object representations and achieves great performance in multiple computer vision tasks. In INR, the object is represented as a continuous function of the coordinates by using a coordinate-based neural network, typically a multilayer perceptron (MLP). In this study, INR was applied to the unsupervised QSM reconstruction framework (INR-QSM) for learning a high-quality QSM image without training labels. The MLP was trained to map the coordinates to the corresponding susceptibility values at each input coordinate by using a custom loss function.Methods
General PrincipleThe general principle of INR-QSM is shown in Figure 1. For each input voxel coordinate $$$(x,y,z)$$$ of the tissue phase $$$\varphi$$$, the MLP predicted the susceptibility intensity $$$\chi(x,y,z)$$$ at the corresponding spatial location as the output. The weight of the coordinate-based MLP was updated by minimizing the following loss function, which included a data consistency (DC) term and two regularization terms:
$${{\mathcal{L}}_{total}}={{\mathcal{L}}_{DC}}+{{\lambda }_{TV}}{{\mathcal{L}}_{TV}}+{{\lambda }_{grad}}{{\mathcal{L}}_{grad}}$$
where $$${{\lambda }_{TV}} $$$ and $$${{\lambda }_{grad}}$$$ were the weighting parameters of the total variation (TV) loss and gradient loss, respectively.
The DC term enforces the consistency between the input phase and the estimated phase by integrating the forward physical model on output QSM:
$${{\mathcal{L}}_{DC}}={{\left\| {{F}^{-1}}DF\chi -\varphi \right\|}_{2}}$$
where $$$F$$$ is the Fourier transform operator and $$$D$$$ is the k-space dipole kernel.
The TV term takes advantage of the sparsity constraint of QSM in the TV domain:
$${{\mathcal{L}}_{TV}}={{\left\| \nabla \chi \right\|}_{2}}$$
where $$$\nabla$$$ is the discrete gradient operator in three directions.
The gradient loss is used to retain the edge information of QSM.5
$${{\mathcal{L}}_{grad}}={{\left\| \nabla {{F}^{-1}}DF\chi -\nabla \varphi \right\|}_{2}}$$
Implementation Details
The input coordinate was projected to a higher dimension by using positional encoding to enable MLP to better learn the high-frequency features before feeding into the network.4 $$${{\lambda }_{TV}} $$$ was set as 0.05 and $$${{\lambda }_{grad}}$$$ was set as 1 in the loss function. The Adam optimizer 6 with a learning rate of 5x10⁻⁴ was used to train the MLP. The model was trained for 400 epochs on one NVIDIA Geforce RTX 3090 GPU. The training patch was 64x64x64 due to GPU memory.
Performance Evaluation
Two different datasets were used for inference. Data from two subjects were obtained using a 3T MR scanner (Prisma, Siemens Healthcare, Erlangen, Germany) with a spatial resolution of 1x1x1 mm and an image matrix of 210x224x160. Subject#1 and subject#2 were scanned with 22 and 11 head orientations, respectively. The 2016 QSM reconstruction challenge data with 12 head orientations was also used for evaluation.
Four common quantitative metrics, including high-frequency error norm (HFEN), root mean square error (RMSE), peak signal-to-noise ratio (PSNR), and structural similarity index (SSIM) were used to evaluate the performance of the reconstruction methods. A classical method STAR-QSM (streaking artifact reduction for QSM) 7 was used for comparison purposes. The COSMOS map (calculation of susceptibility through multiple orientation sampling) 8 from multiple head positions was regarded as the reference image.
Results
Figure 2 and Figure 3 show the reconstructed QSM images of subject#1 and subject#2 with the difference maps referenced to COSMOS. INR-QSM showed a slight improvement compared with STAR-QSM with more homogeneous susceptibilities in white matter regions. In addition, INR-QSM outperformed STAR-QSM in terms of all four quantitative evaluation parameters.Figure 4 presents the QSM reconstruction results on QSM challenge data using INR. INR-QSM also showed better quantitative metrics than STAR-QSM.
Discussion
The preliminary results on two datasets have indicated the ability of INR to represent the susceptibility map as a continuous function of voxel coordinates. Although INR-QSM showed better evaluation metrics, however, INR-QSM seemed to produce a smoother map than STAR-QSM. Efforts using different encoding strategies on the input coordinates 9, 10 or adopting sinusoidal activation functions for INR 11 are now in progress to better recover the high-frequency details of QSM maps.Conclusion
We introduced an unsupervised QSM reconstruction method using INR. The preliminary results could indicate the potential of INR for reconstructing high-quality QSM without external supervision data.Acknowledgements
No acknowledgement found.References
1. Acosta-Cabronero J, Cardenas-Blanco A, Betts MJ, et al. The whole-brain pattern of magnetic susceptibility perturbations in Parkinson's disease. Brain. 2017;140(1):118-131.2. Zhang Y, Wei H, Cronin MJ, et al. Longitudinal atlas for normative human brain development and aging over the lifespan using quantitative susceptibility mapping. Neuroimage. 2018;171:176-189.
3. Shi Y, Feng R, Li Z, et al. Towards in vivo ground truth susceptibility for single-orientation deep learning QSM: A multi-orientation gradient-echo MRI dataset. Neuroimage. 2022;261:119522.
4. Mildenhall B, Srinivasan PP, Tancik M, et al. Nerf: Representing scenes as neural radiance fields for view synthesis. Communications of the ACM. 2021;65(1):99-106.
5. Yoon J, Gong E, Chatnuntawech I, et al. Quantitative susceptibility mapping using deep neural network: QSMnet. Neuroimage. 2018;179:199-206.
6. Kingma DP, Ba J. Adam: A method for stochastic optimization. arXiv preprint arXiv:14126980. 2014.
7. Wei H, Dibb R, Zhou Y, et al. Streaking artifact reduction for quantitative susceptibility mapping of sources with large dynamic range. NMR Biomed. 2015;28(10):1294-1303.
8. Liu T, Spincemaille P, de Rochefort L, et al. Calculation of susceptibility through multiple orientation sampling (COSMOS): A method for conditioning the inverse problem from measured magnetic field map to susceptibility source image in MRI. Magnetic Resonance in Medicine. 2009;61(1):196-204.
9. Tancik M, Srinivasan P, Mildenhall B, et al. Fourier features let networks learn high frequency functions in low dimensional domains. Advances in Neural Information Processing Systems. 2020;33:7537-7547.
10. Liu R, Sun Y, Zhu J, et al. Recovery of continuous 3D refractive index maps from discrete intensity-only measurements using neural fields. Nature Machine Intelligence. 2022;4(9):781-791.
11. Sitzmann V, Martel J, Bergman A, et al. Implicit neural representations with periodic activation functions. Advances in Neural Information Processing Systems. 2020;33:7462-7473.
Figures
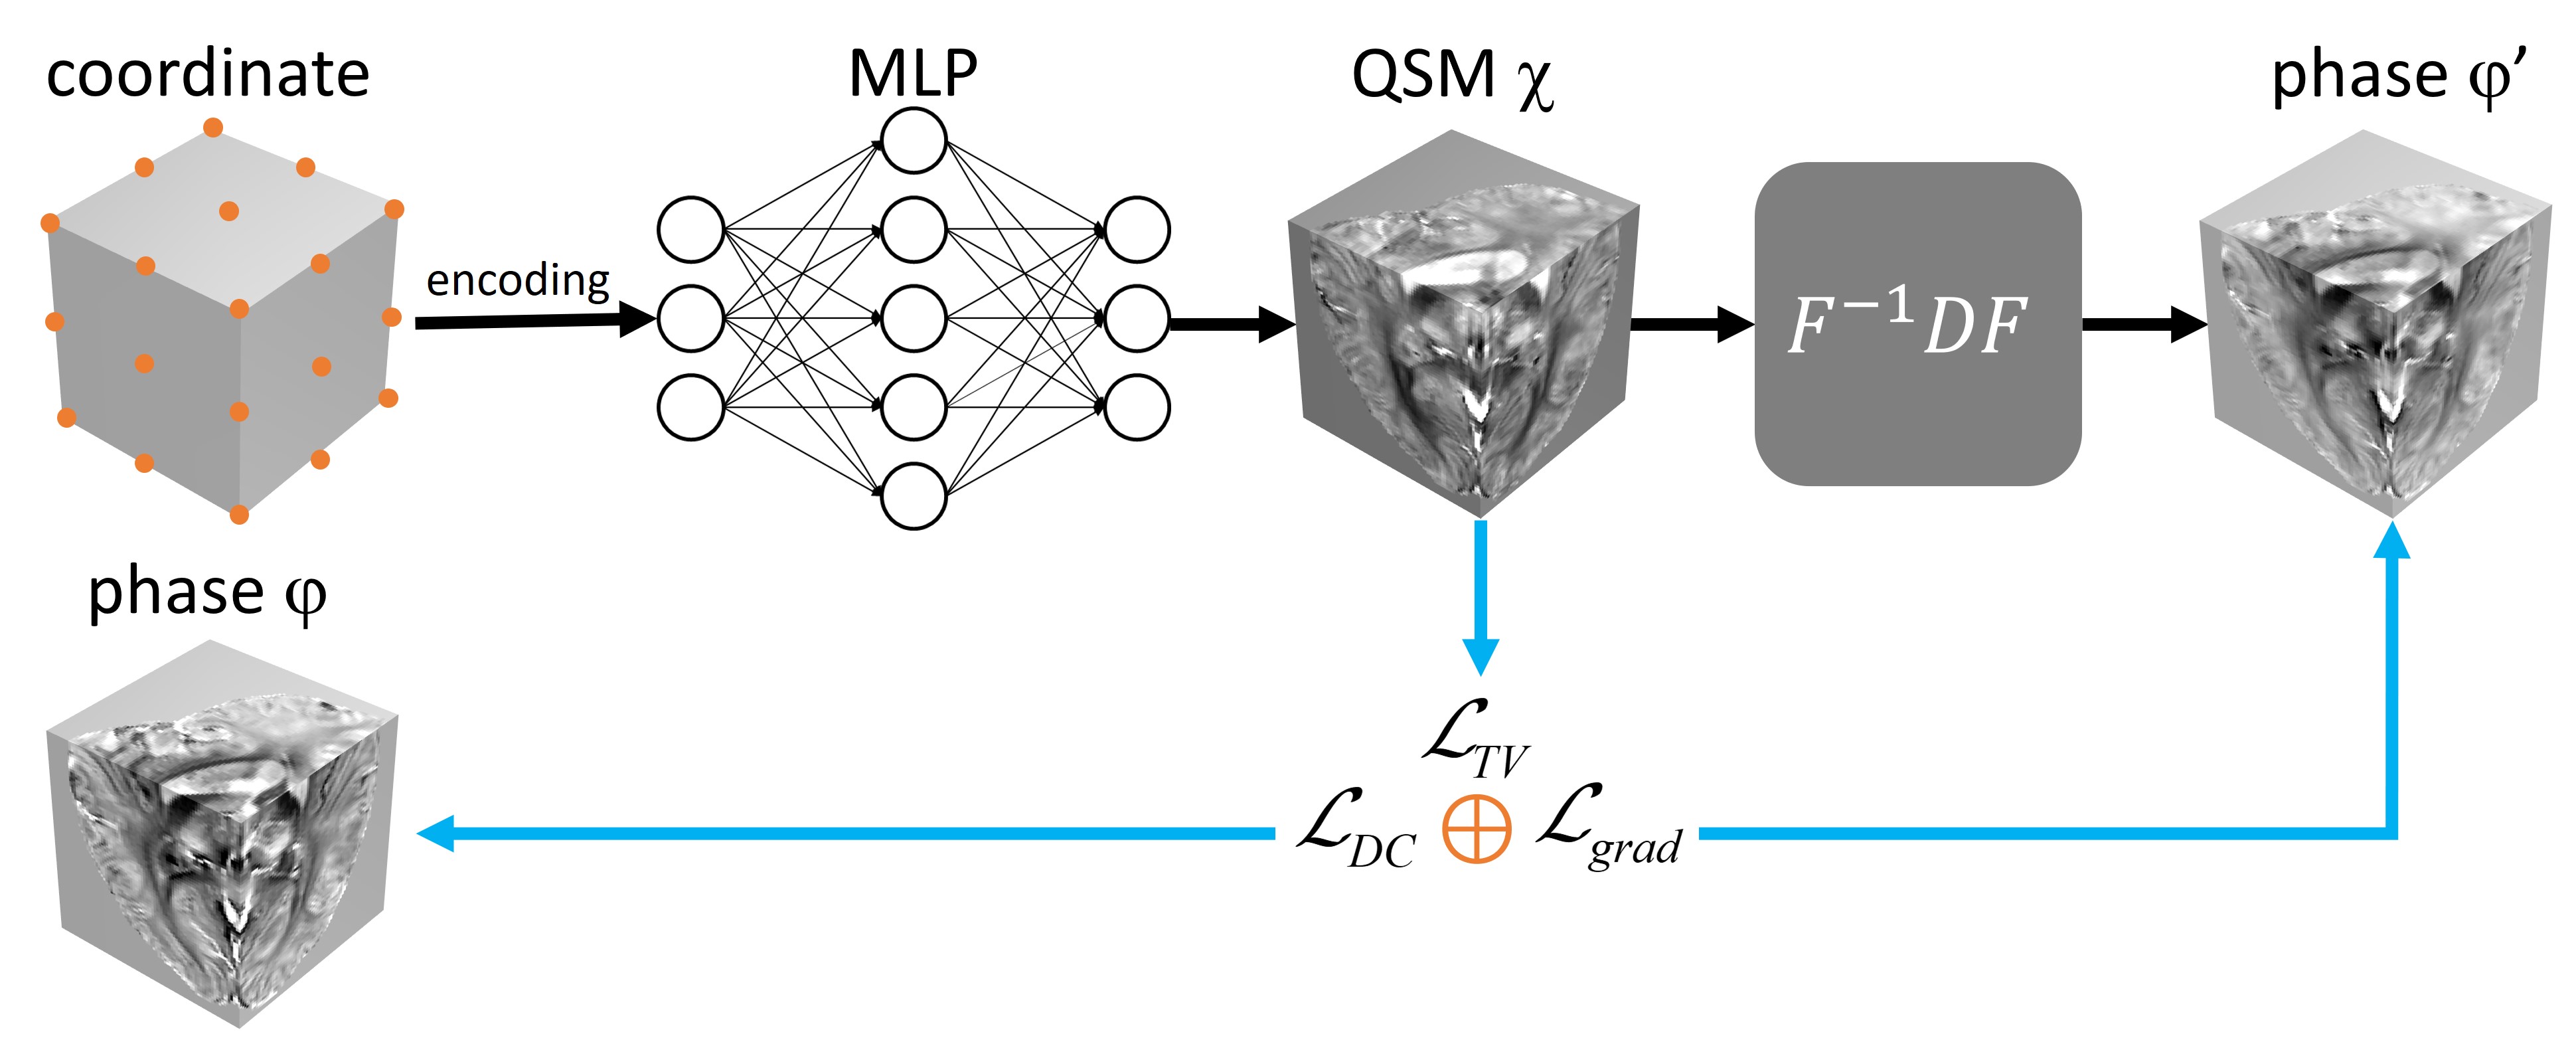
Figure 1. The schematic
illustration of INR-QSM.
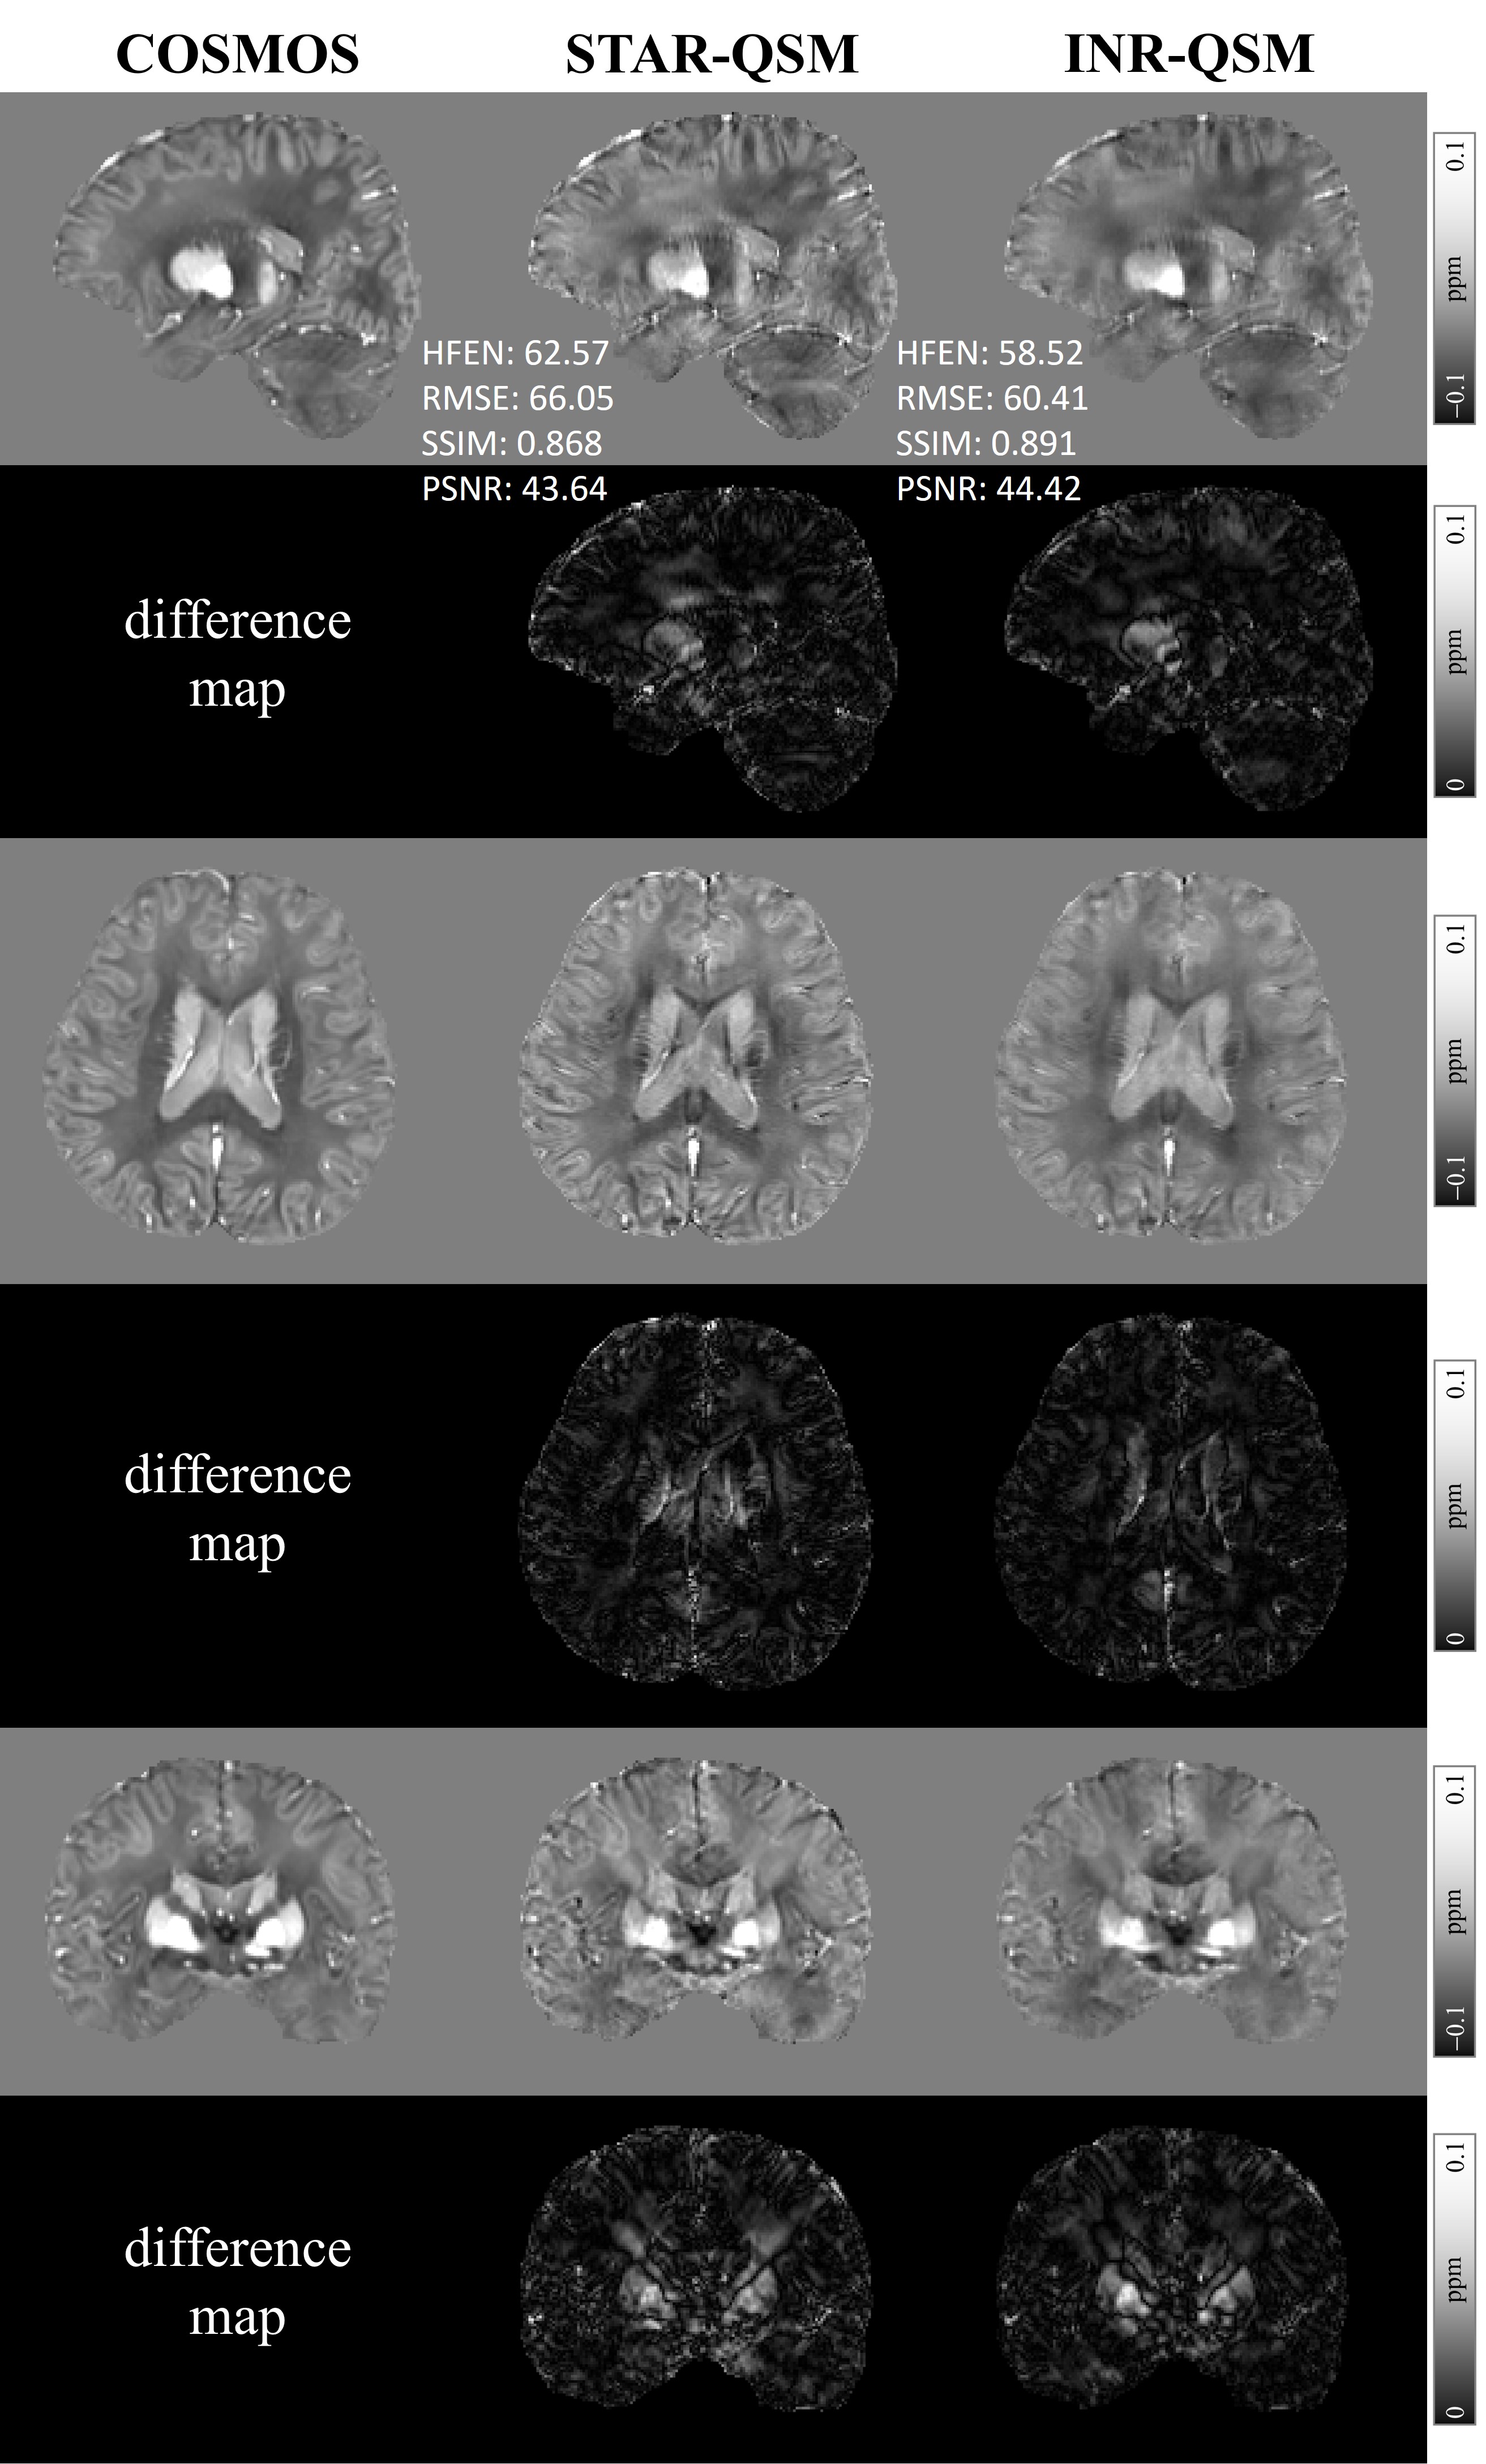
Figure 2. QSM maps
reconstructed by INR-QSM and STAR-QSM on subject#1 with 22 head orientations. The
difference maps and quantitative performance metrics with respect to the COSMOS
map are also presented.
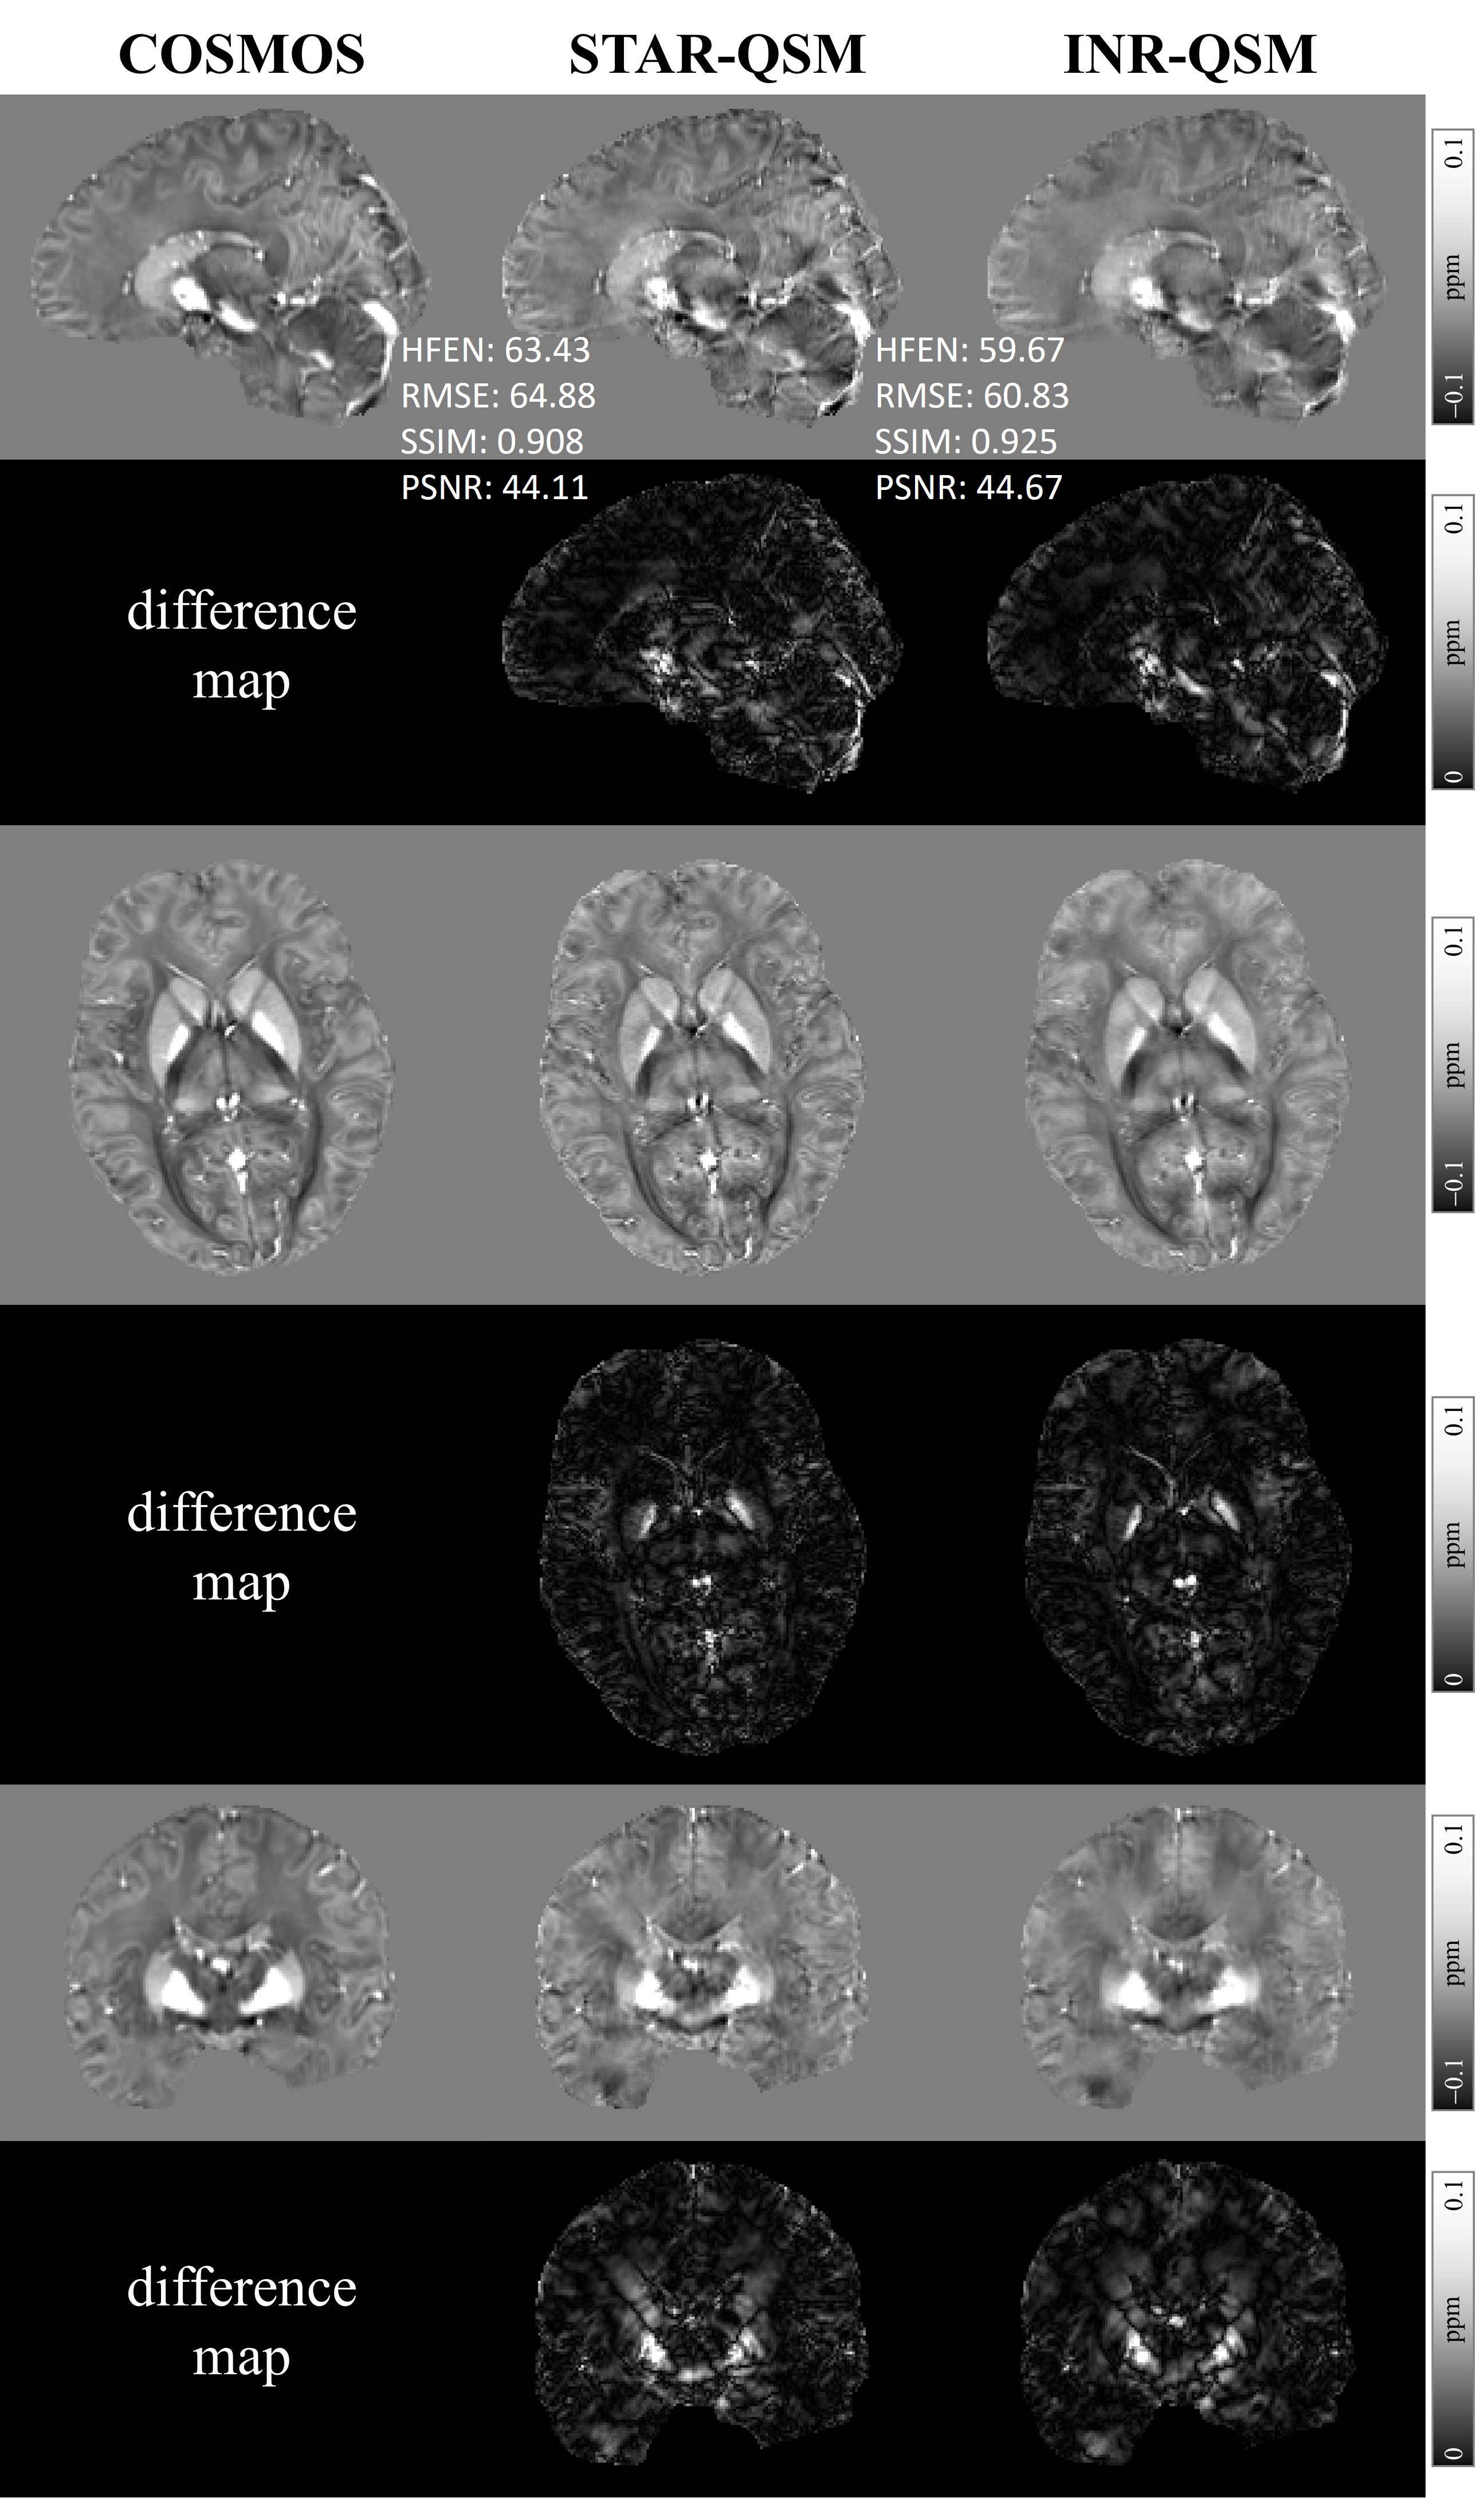
Figure 3. QSM maps
reconstructed by INR-QSM and STAR-QSM on subject#2 with 11 head orientations.
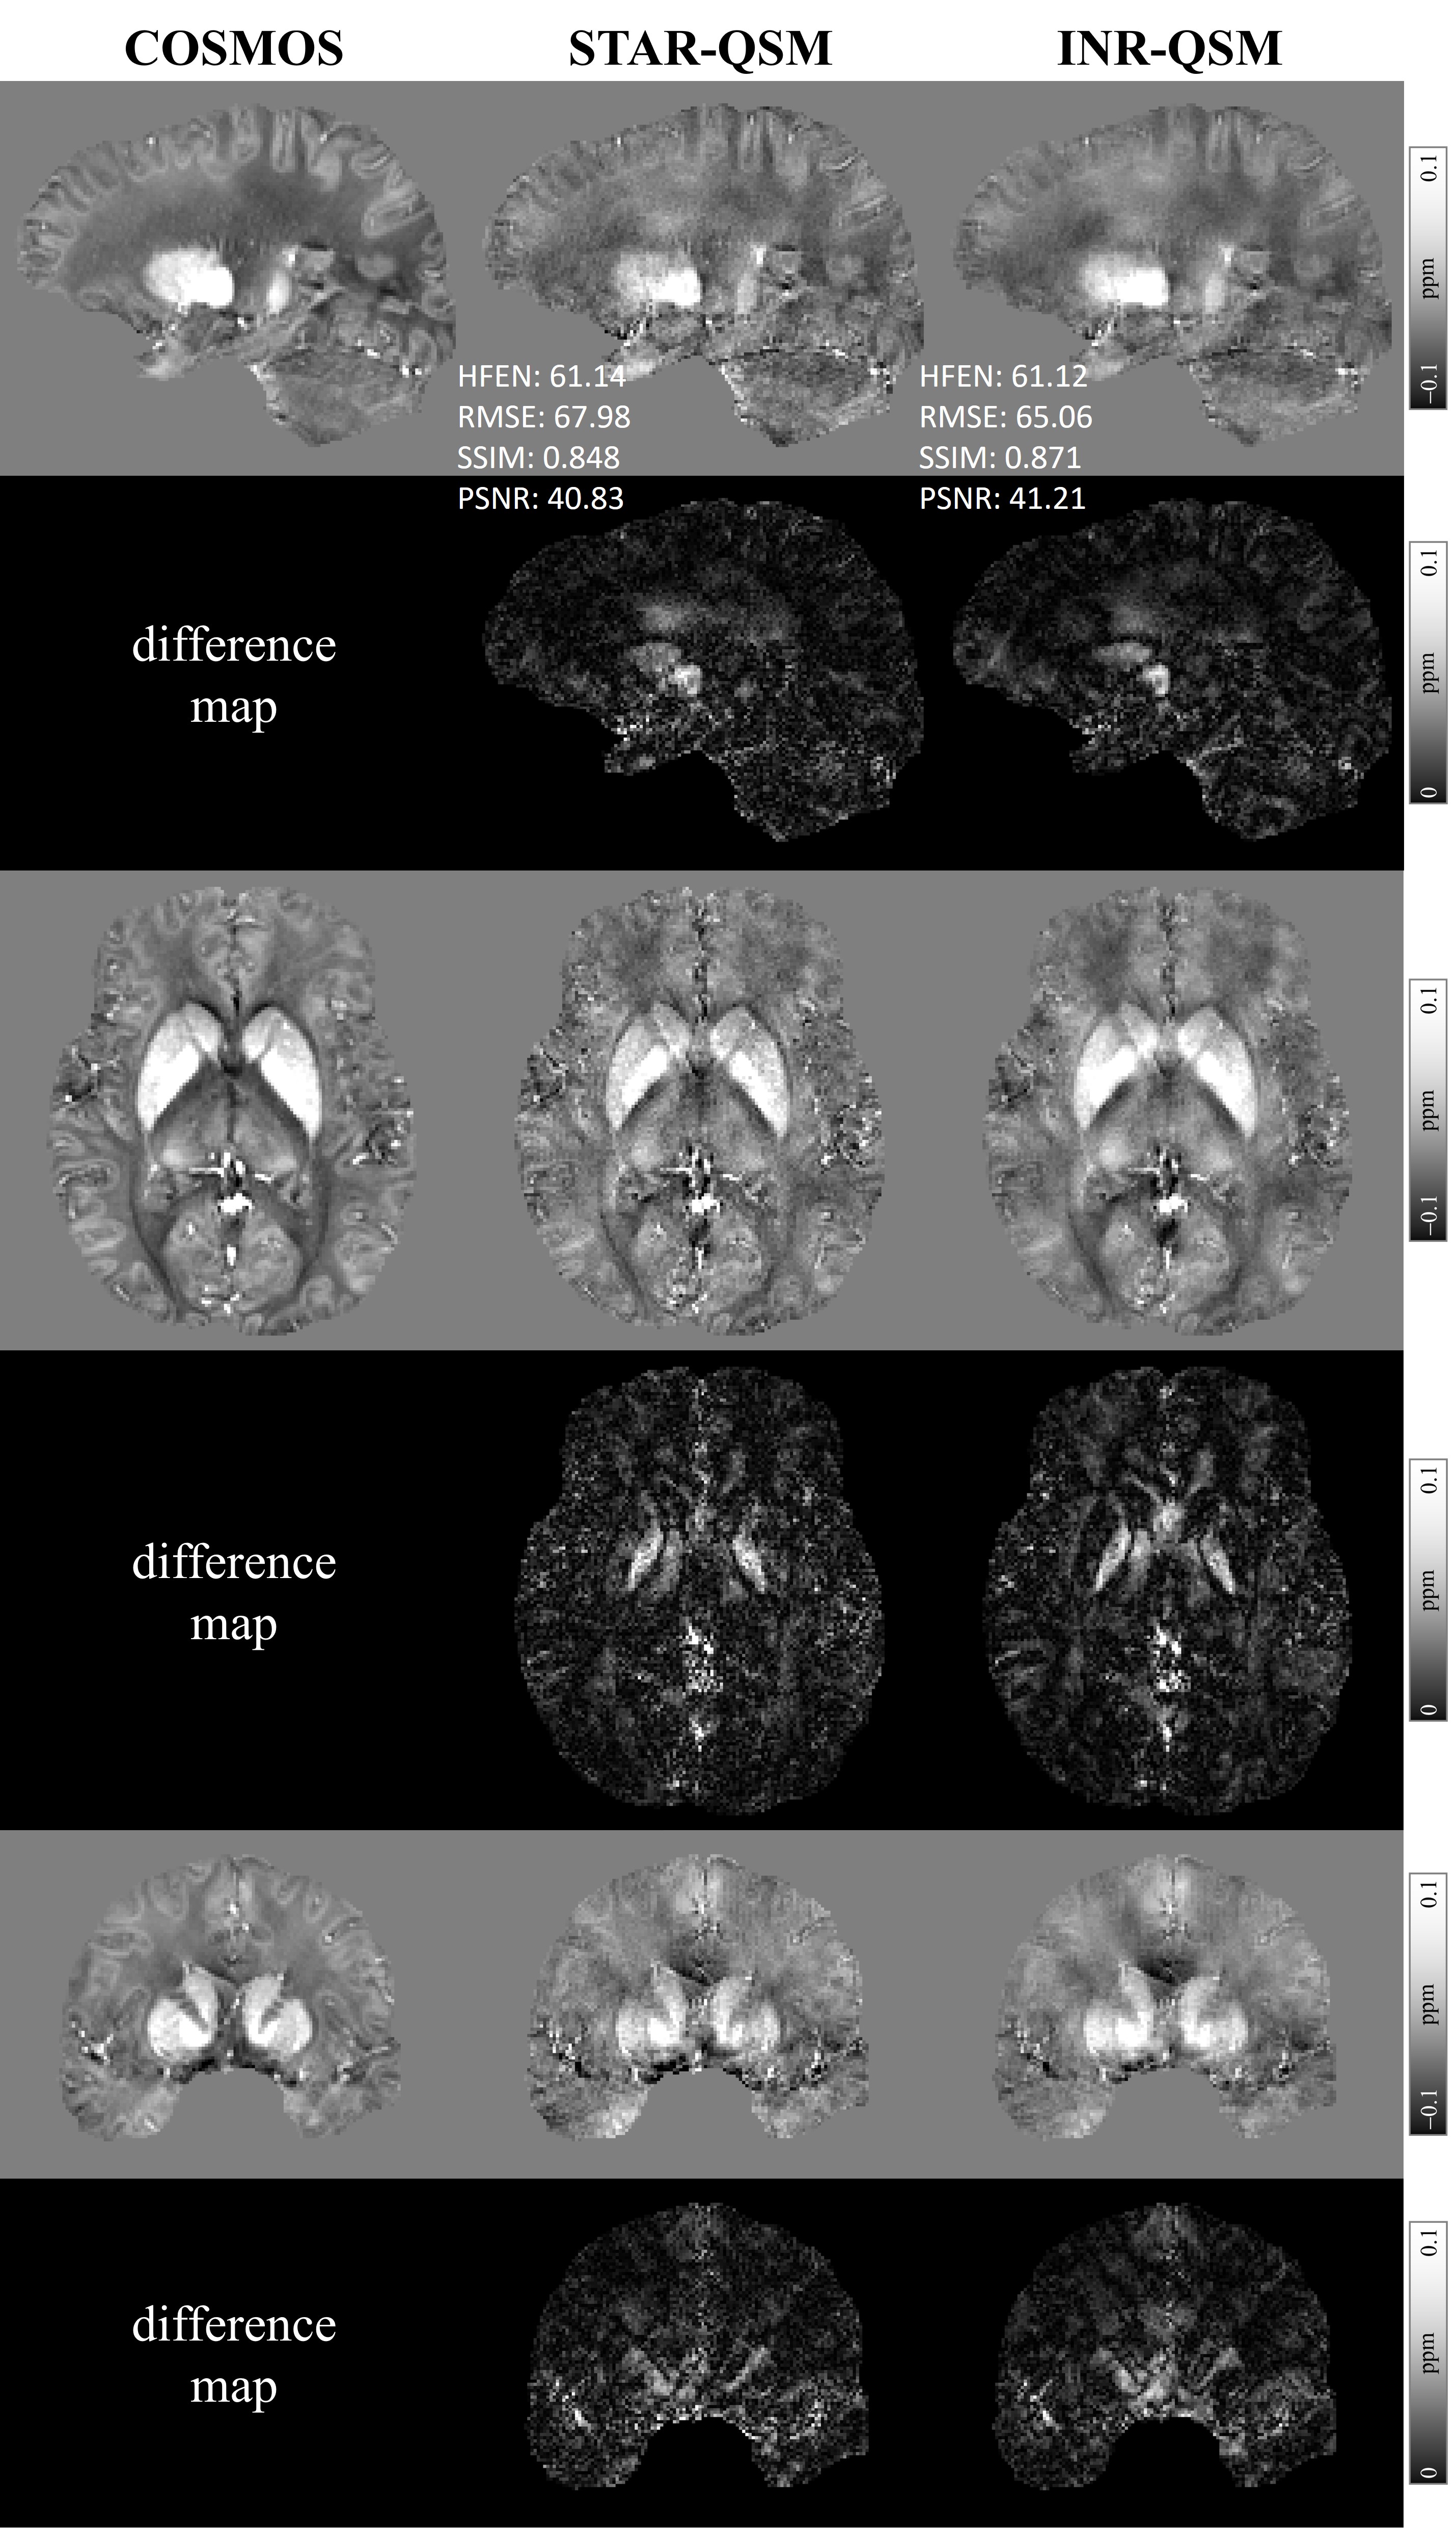
Figure 4. Comparison of QSM
maps from INR-QSM and STAR-QSM on QSM challenge data.
DOI: https://doi.org/10.58530/2023/4180