4179
Depiction of Small Vessels in QSM is Influenced by Regularization Parameter in TGV-Regularized Parallel Image Reconstruction1Physics, UBC MRI Research Centre, Vancouver, BC, Canada, 2Department of Pediatrics, UBC, Vancouver, BC, Canada
Synopsis
Keywords: Susceptibility, Brain, small vessel, central vein, phase, regularization, vein, qsm, quantitative, mapping
Quantitative susceptibility mapping is a possible modality with which to measure and identify diseases involving small vasculature in the brain. However, multi-echo gradient echo images that are a requirement for high quality quantitative susceptibility map reconstruction require long scan durations, limiting clinical utility. This duration can be reduced with the use of parallel imaging strategies, and non-linear reconstruction with total generalized variation regularization is an increasingly popular strategy for undersampled reconstruction. We demonstrate that the depiction of small vessels and surrounding structures in QSM is significantly sensitive to the choice of regularization parameter used in the reconstruction.Introduction
Quantitative susceptibility mapping (QSM) is an emerging technique for identification and analysis of disease-associated pathology in neuroimaging.1-2 While intended as a quantitative contrast to measure relative susceptibility, QSM images also exhibit good qualitative contrast, particularly around vasculature, and recent works have investigated their utility in Multiple-Sclerosis (MS) and cerebral small-vessel diseases.3 Reconstructing the susceptibility from the image data is achieved by first unwrapping the image phase and converting to units of magnetic field, removing harmonic field components, and solving the ill-posed dipole inversion problem.4 Fidelity of the input image phase is critical, and so multi-echo GRE sequences with 3-7 echoes are commonly used for acquisition to provide robust information about the phase evolution over time. However, the need to sample the phase evolution at various echo times (TE) makes fully-sampled multi-echo GRE acquisitions infeasible, with most QSM experiments utilizing parallel imaging strategies to reduce acquisition time.5-6Parallel imaging uses information acquired across multiple receive coils to reconstruct Complex-valued images from undersampled k-space data, and describes image reconstruction as a non-linear optimization problem. Total generalized variation (TGV) can be used for regularization in the non-linear reconstruction.7-8 The cost function of TGV leverages the strengths of widely used total variation (TV) in reducing noise and avoiding loss of edges in the image while at the same time avoiding staircasing effects often present in TV. TV implicitly assumes a constant piecewise image by only imposing constraints on the first derivative. This results in patches of constant intensity being associated with a lower cost function than a smooth intensity gradient. TGV overcomes this limitation by including second derivatives in the cost function and promoting smoothly varying image intensity.
A limitation of TGV is that it can falsely suppress or amplify low-contrast image features, with this behaviour becoming more severe at high undersampling factors. In this work, we investigate the effect of TGV regularization on the depiction of small vessels in QSM across a range of acceleration factors.
Methods
A fully sampled multi-echo GRE scan was performed on a healthy volunteer at 3T (Philips Elition) with a 32-channel head coil and an acquisition voxel size of 0.5mm x 0.75mm x 2.00mm. Acquisition duration was 13 minutes. Four echo times were acquired (TE = 6.0 ms, 12.7 ms, 19.3 ms, 26.0 ms), and the raw k-space data was exported from the scanner. The raw data and the sensitivity maps were retrospectively undersampled (R = 1.44,1.97, 3, 4, 5.74, 8) using uniform random undersampling and reconstructed using the Berkely Advanced Reconstruction Toolbox (BART) implementation of parallel image reconstruction with CS using TGV regularization.9 Each undersampled k-space was reconstructed with 6 different regularization weights, ranging from 0.0005 to 0.1. A fully-sampled reconstruction was performed using SENSE for comparison. Image reconstruction times were approximately 10 minutes per volume on a 32-core workstation.All reconstructed images were identically processed using the QSM toolbox from the UBC MRI Research Centre. Phase unwrapping was performed using Laplacian-based unwrapping.10 Background field subtraction was performed using an implementation of regularized SHARP.11 Susceptibility was reconstructed using the rapid two-step dipole inversion method.12 QSM reconstruction times were approximately 20 seconds per volume on a 32-core workstation.
Results
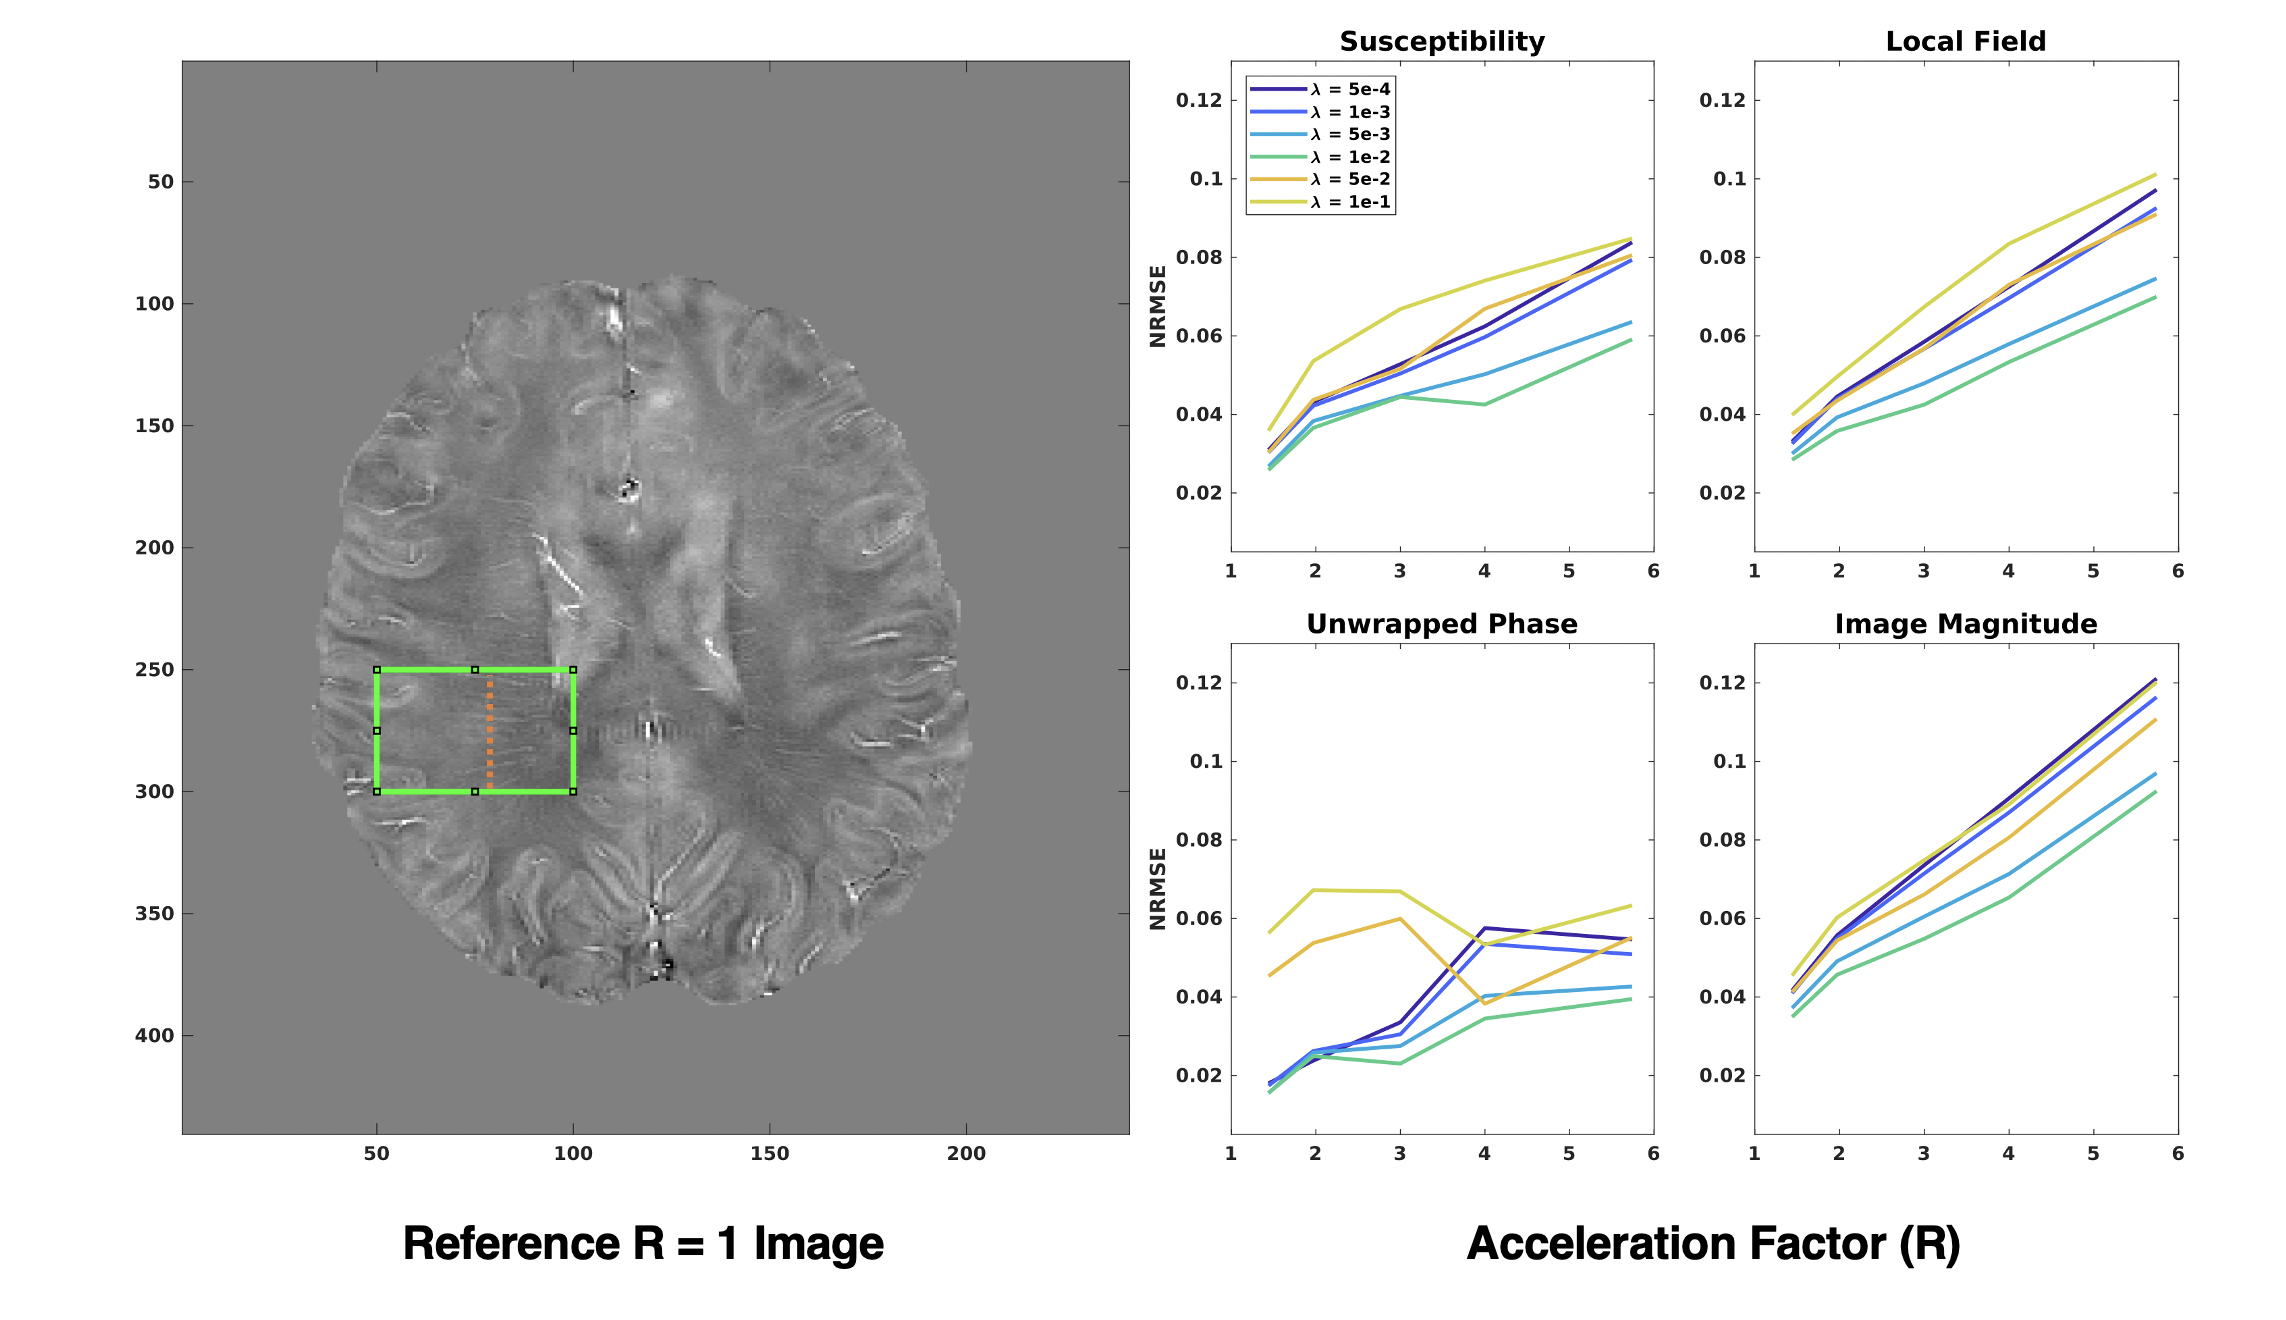
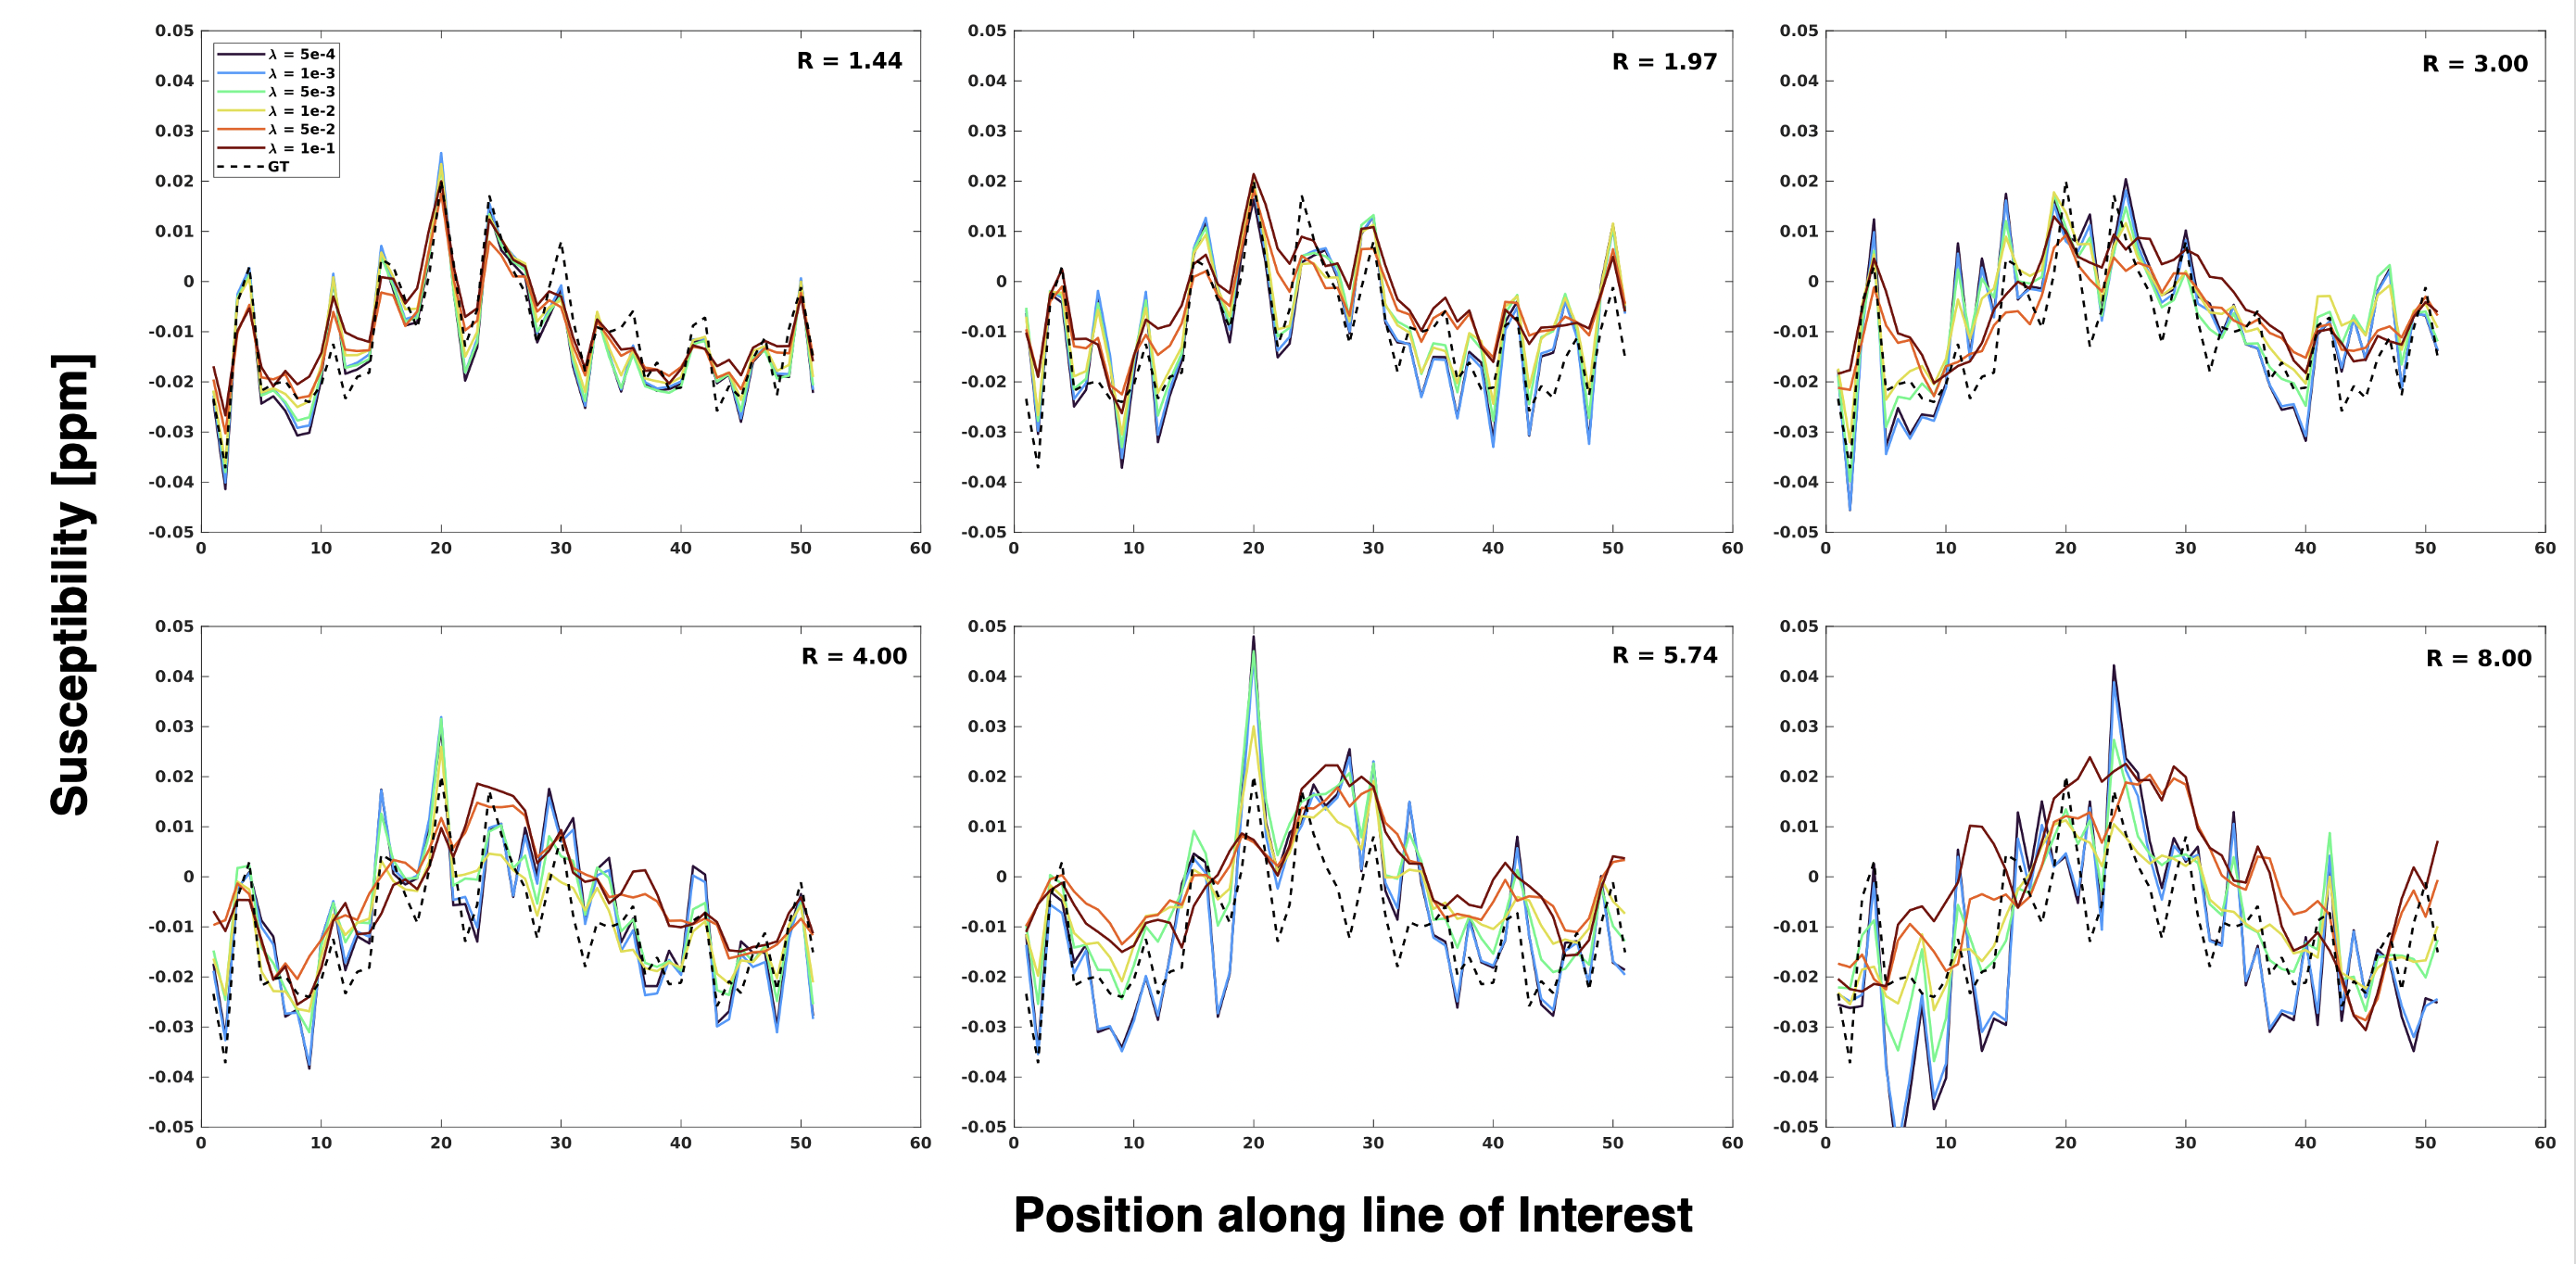
A region of the imaging volume containing a high density of small vessels was chosen for analysis (shown in green in Fig. 1), and normalized root mean-square error (NRMSE) was measured in this region between the reconstructed and reference QSM images for each undersampling factor and regularization parameter. The NRMSE was also measured in the local field images, the unwrapped phase images, and the magnitude images (Fig. 1).Within the region of interest, an intensity profile was chosen through the region of interest, crossing perpendicularly to small vessels, and compared to the reference image over the same range, shown in Fig. 2. The influence of regularization strength in measured susceptibility was apparent at all acceleration factors, with low regularization factors consistently resulting in overestimation of susceptibility, and high regularization factors providing an underestimate. This behaviour was more prominent with increased acceleration factor. At reasonable acceleration factors of between 3 and 6 (for a 32-channel head coil), the measured susceptibility in small vessels can vary by up to 200% dependent upon regularization.
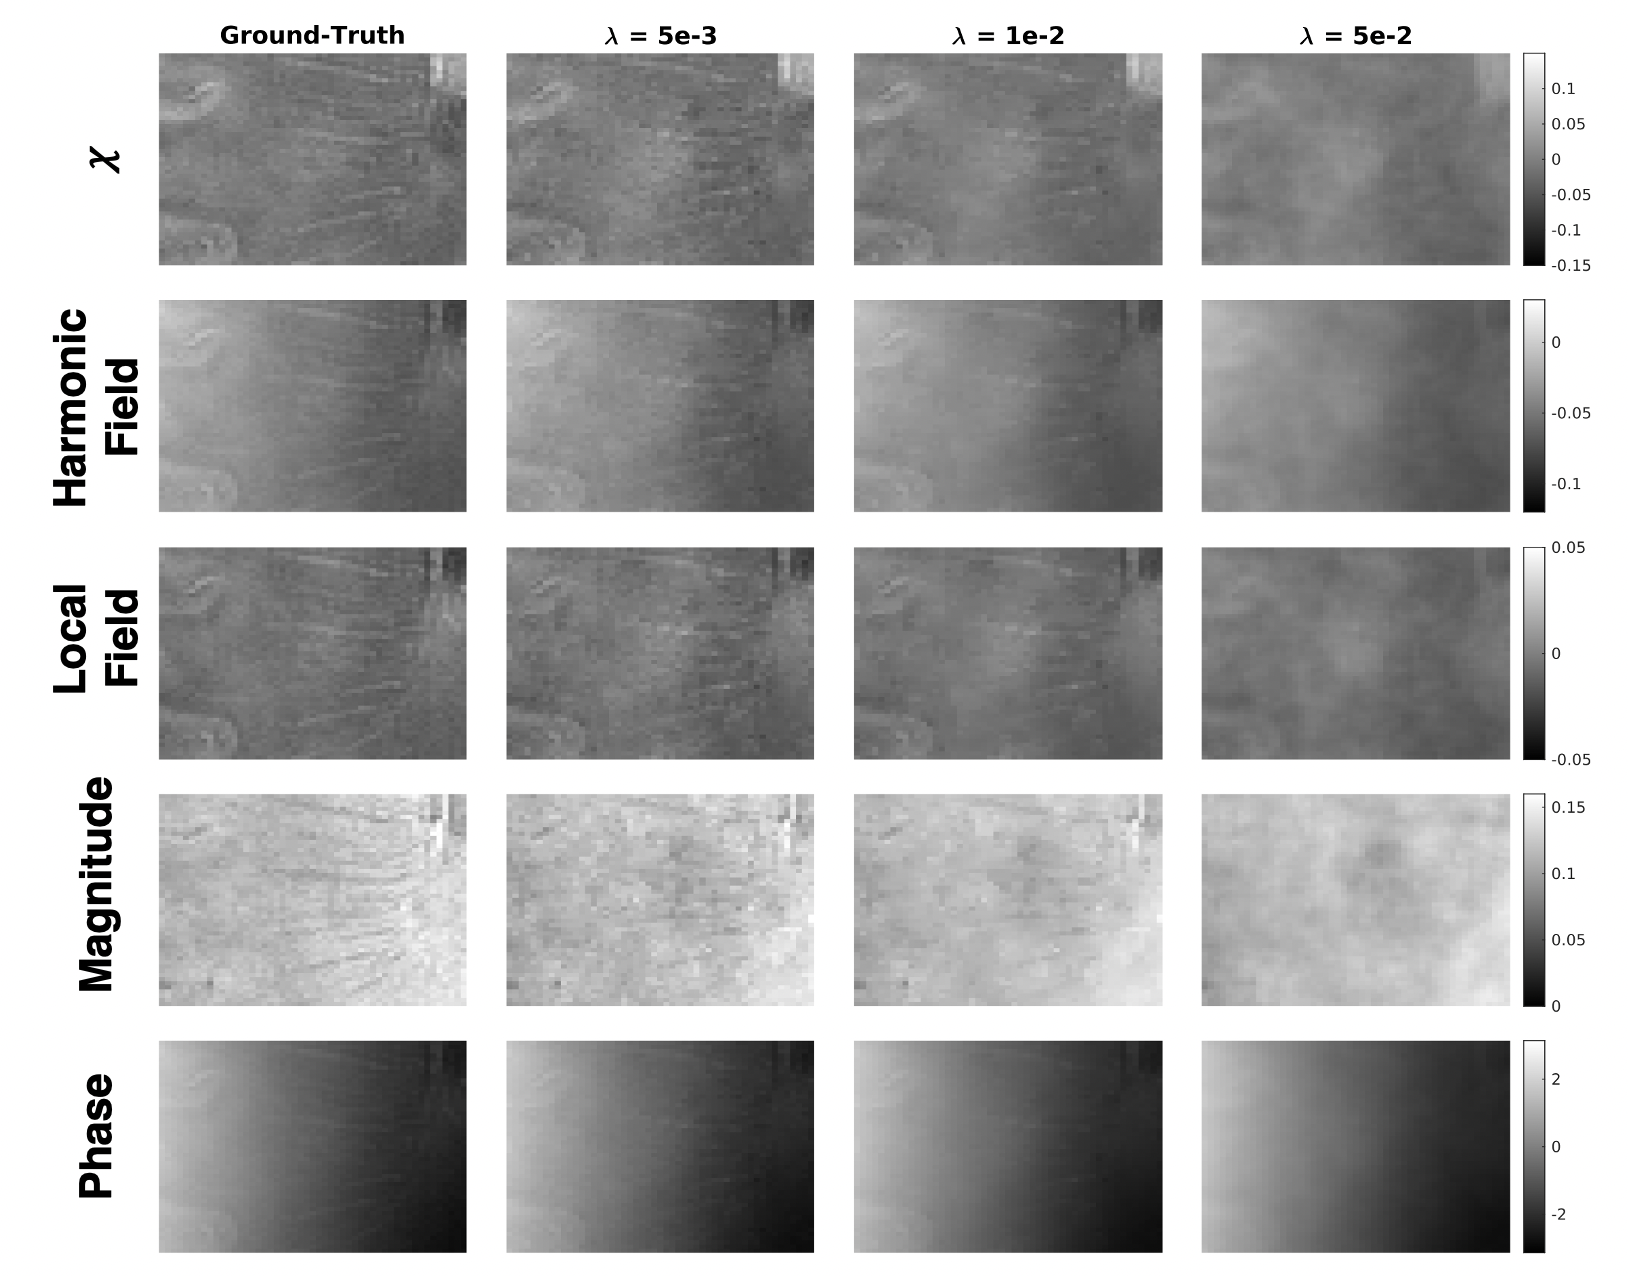
A visual comparison of susceptibility, local field, unwrapped phase and magnitude images at different regularization parameters is shown in Figure 3 for an acceleration factor of $$$R = 5.74$$$.
Discussion
The presented findings demonstrate that TGV-regularized image reconstruction can have significant downstream influence on the depiction of small vasculature in reconstructed susceptibility maps. We showed that small changes in regularization strength result in large deviations of the measured magnetic susceptibility in small vessels compared to the reference, which has implications for cerebral blood oxygenation measurements.Furthermore, qualitative depiction of the small vessels was very sensitive to regularization at clinically relevant acceleration factors, with small changes to the regularization parameter resulting in severe reduction in contrast.
Unwrapped phase shows increased NRMSE at high regularization strengths, however such trends are not seen in the estimated local field NRMSE. It is likely that smoothly varying errors introduced by strong regularization are removed along with the background field.
Acknowledgements
All work was conducted at the University of British Columbia, located on the traditional, ancestral and unceded territory of the Musqueam people.References
1. Lee K, Ellison B, Selim M, et al. Quantitative susceptibility mapping improves cerebral microbleed detection relative to susceptibility-weighted images. Journal of Neuroimaging n/a doi: 10.1111/jon.13054.
2. Li J, Huang W, Luo X, et al. The central vein sign in multiple sclerosis lesions: Susceptibility relaxation optimization from a routine MRI multiecho gradient echo sequence. Journal of Neuroimaging 2022;32:48–56 doi: 10.1111/jon.12938.
3. Li J, Nguyen TD, Zhang Q, Guo L, Wang Y. Cerebral Microbleeds Are Associated With Increased Brain Iron and Cognitive Impairment in Patients With Cerebral Small Vessel Disease: A Quantitative Susceptibility Mapping Study. Journal of Magnetic Resonance Imaging 2022;56:904–914 doi: 10.1002/jmri.28092.
4. Deistung A, Schweser F, Reichenbach JR. Overview of quantitative susceptibility mapping: Overview of Quantitative Susceptibility Mapping. NMR Biomed. 2017;30:e3569 doi: 10.1002/nbm.3569.
5. Lustig M, Donoho D, Pauly JM. Sparse MRI: The application of compressed sensing for rapid MR imaging. Magnetic Resonance in Medicine 2007;58:1182–1195 doi: 10.1002/mrm.21391.
6. Pruessmann KP, Weiger M, Scheidegger MB, Boesiger P. SENSE: Sensitivity encoding for fast MRI. Magn. Reson. Med. 1999;42:952–962 doi: 3.0.CO;2-S">10.1002/(SICI)1522-2594(199911)42:5<952::AID-MRM16>3.0.CO;2-S.
7. Knoll F, Bredies K, Pock T, Stollberger R. Second order total generalized variation (TGV) for MRI. Magn. Reson. Med. 2011;65:480–491 doi: 10.1002/mrm.22595.
8. Knoll F, Clason C, Bredies K, Uecker M, Stollberger R. Parallel imaging with nonlinear reconstruction using variational penalties. Magn. Reson. Med. 2012;67:34–41 doi: 10.1002/mrm.22964.
9. BART Toolbox for Computational Magnetic Resonance Imaging, DOI: 10.5281/zenodo.592960
10. Schofield MA, Zhu Y. Fast phase unwrapping algorithm for interferometric applications. Opt. Lett., OL 2003;28:1194–1196 doi: 10.1364/OL.28.001194.
11. Sun H, Wilman AH. Background field removal using spherical mean value filtering and Tikhonov regularization. Magnetic Resonance in Medicine 2014;71:1151–1157 doi: 10.1002/mrm.24765.
12. Kames C, Wiggermann V, Rauscher A. Rapid two-step dipole inversion for susceptibility mapping with sparsity priors. Neuroimage 2018;167:276–283 doi: 10.1016/j.neuroimage.2017.11.018.
Figures