4173
Optimising an Acquisition Protocol and Pipeline for Robust Clinical Quantitative Susceptibility Mapping to Investigate Movement Disorders
Oliver C. Kiersnowski1, David L. Thomas2, Adam K. Yamamoto2,3, Mohammed Elgwely2,3, Anastasia Papadaki2,3, Tarek Yousry2,3, John S. Thornton2,3, and Karin Shmueli1
1Department of Medical Physics and Biomedical Engineering, University College London, London, United Kingdom, 2Neuroradiological Academic Unit, UCL Queen Square Institute of Neurology, University College London, London, United Kingdom, 3Lysholm Department of Neuroradiology, National Hospital for Neurology and Neurosurgery, London, United Kingdom
1Department of Medical Physics and Biomedical Engineering, University College London, London, United Kingdom, 2Neuroradiological Academic Unit, UCL Queen Square Institute of Neurology, University College London, London, United Kingdom, 3Lysholm Department of Neuroradiology, National Hospital for Neurology and Neurosurgery, London, United Kingdom
Synopsis
Keywords: Susceptibility, Quantitative Susceptibility mapping
Quantitative susceptibility mapping (QSM) has been used to investigate movement disorders but has not been integrated into routine clinical practice. We developed an acquisition protocol and a robust QSM pipeline for neuroradiological investigation of movement disorders. We show that high quality QSMs can be acquired using a multi-echo 3D gradient-echo sequence with partial k-space filling in under 6 minutes with only one of eleven patient QSMs corrupted by motion artifacts. We show that Laplacian phase unwrapping and projection onto dipole fields (PDF) background field removal are robust to artifacts across patients with strong susceptibility sources associated with various pathologies.Introduction
Quantitative susceptibility mapping (QSM) utilises the phase of the complex MRI signal to reveal underlying tissue susceptibility ($$$\chi$$$) distributions. $$$\chi$$$ is known to correlate with tissue iron content1,2, which is a biomarker in movement disorders3. QSM has shown abnormal tissue iron content in diseases such as Parkinson’s disease4–8, Alzheimer’s disease9, multiple sclerosis10 and others11. However, QSM has not yet been integrated into routine neuroradiology practice. Here, we optimised an acquisition protocol, and a robust QSM pipeline for clinically evaluating movement disorders under the Quantitative Neuroradiology Initiative12 framework.Methods
Acquisition Protocol OptimisationData for QSM must be acquired in an acceptable timeframe, especially for investigating movement disorders, where motion can cause artefacts. Therefore, seven multi-echo 3D gradient echo (GRE) sequences with different partial k-space approaches (Table 1) were acquired in a single healthy volunteer on a clinical 3T Siemens Prisma MR system and QSM were reconstructed using a preliminary pipeline with iterative Tikhonov13 susceptibility calculation. Test sequence parameters were based on experience and preliminary consensus guidelines14–17 and had TE1/ΔTE/TE5=4.92/4.92/24.6 ms; GRAPPAPE1=3; PE1 direction R>>L; PE2 direction F>>H; adaptive coil combination; flip angle=15°; TR=30 ms; resolution 1x1x1 mm3; FOV=256x192x176 mm3.
After comparing all sequences, 11 patients with movement disorders underwent routine clinical scans with sequence 7 appended to the clinical protocol having given informed consent and with approval by the local ethics committee.
QSM Pipeline Development
32 pipelines (Figure 1a), combining different unwrapping, background field removal and susceptibility calculation techniques, were tested to optimise a robust QSM pipeline for clinical use. For all pipelines, field maps and noise maps were obtained through a non-linear fit18,19 of the complex data over echo times, with residual phase wraps removed using Laplacian unwrapping20 or ROMEO21. Background fields were removed using Laplacian boundary value (LBV)22 or PDF23, followed by four susceptibility calculation techniques: iterative Tikhonov13, non-linear total generalised variation (nlTGV)24, weak harmonic (WH) QSM25 and non-linear dipole inversion with automatic stopping26,27 (Auto-NDI). Regularisation values for iterative Tikhonov, nlTGV and WH-QSM, calculated by averaging optimal values from L-Curves28 on all 11 patients, were 0.0363, 1.76×10⁻⁵ and 1.17×10⁻⁵, respectively. All 32 QSM pipelines were tested in the 11 movement disorder patient data-sets to determine the most robust QSM pipeline applicable to clinical data.
QSMs were calculated with two brain masking techniques: (i) One-pass: a mask from FSL BET29 on the longest echo magnitude image was eroded by 2 layers and (ii) Two-pass: a second mask was created by thresholding the first at the mean of the inverse noise map13. QSMs from both the first and second masks were combined according to Karsa et al.30 to reduce artefacts around strong susceptibility sources and noisy regions.
Analysis
Three physicists and two neuroradiologists visually compared the preliminary whole-brain QSMs, from each sequence on a healthy volunteer, focusing on the basal ganglia, subthalamic nucleus and substantia nigra due to their importance in movement disorders3,31–33. For a quantitative comparison, all pipelines were applied to the magnitude and phase numerical phantom images from the QSM Challenge 2.034 and the root mean square error (RMSE) and structural similarity index tuned for QSM (XSIM35) were calculated relative to the ground truth.
Results and Discussion
Acquisition Protocol OptimisationEach sequence produced QSMs of high quality and sequence 7 (5min38s) was used for QSM pipeline selection due to its high contrast in the brain stem and clear boundaries between regions such as the subthalamic nuclei and substantia nigra (Figure 2), that are important in movement disorders. Sequences with 6/8 partial Fourier in the second phase encoding (‘slice’) direction (3 and 6) resulted in QSMs with poorer visible separation between the substantia nigra and the subthalamic nuclei (Figure 2).
QSM Pipeline: Numerical Phantom
RMSE and XSIM for all pipelines (Figure 1b) indicate that ROMEO phase unwrapping with LBV background field removal was optimal for all susceptibility calculation methods. Two-pass masking has better RMSE and XSIM than single-pass for iterative Tikhonov and Auto-NDI, but not for nlTGV and WH-QSM, however, visual comparisons show artefact reduction with two-pass masking for these methods too (Figure 3a).
QSM Pipeline: Patients
Two-pass masking reduced artefacts, particularly in the presence of large pathologies, compared to one-pass masking (Figure 3b). Laplacian unwrapping was less prone to streaking artefacts than ROMEO (Figure 4a), and PDF showed fewer large streaks across all patients than LBV, which sometimes left residual background fields (Figure 4b). Laplacian unwrapping and PDF background field removal were most robust for all four susceptibility calculation methods. Only 1 out of the 11 patients’ images suffered from motion artefacts completely corrupting the QSM.
Conclusions
Evaluating QSM pipelines solely using simulated data was insufficient to predict robustness in clinical scans. We showed that two-pass masking30 improves QSM in the presence of various pathologies. A 3D-GRE protocol with partial k-space and an elliptical shutter allowed acquisition in 5min 38s. A QSM pipeline including Laplacian phase unwrapping20 and projection onto dipole fields (PDF)23 background field removal provided high-quality QSM and was robust for patients displaying differing pathology. In future work, neuroradiologists will score susceptibility maps to select an optimal susceptibility calculation method and finalise a robust QSM pipeline to enhance routine clinical MRI in movement disorders.Acknowledgements
Oliver Kiersnowski’s work was supported by the EPSRC-funded UCL Centre for Doctoral Training in Intelligent, Integrated Imaging in Healthcare (i4health)(EP/S021930/1). John Thornton and Tarek Yousry received support from the National Institute for Health Research University College London Hospital Biomedical Research Centre. Karin Shmueli was supported by European Research Council Consolidator Grant DiSCo MRI SFN 770939.References
- Shmueli K, de Zwart JA, van Gelderen P, Li TQ, Dodd SJ, Duyn JH. Magnetic susceptibility mapping of brain tissue in vivo using MRI phase data. Magn Reson Med. 2009;62(6):1510-1522. doi:10.1002/mrm.22135
- Langkammer C, Schweser F, Krebs N, et al. Quantitative susceptibility mapping (QSM) as a means to measure brain iron? A post mortem validation study. Neuroimage. 2012;62(3):1593-1599. doi:10.1016/j.neuroimage.2012.05.049
- Dusek P, Jankovic J, Le W. Iron dysregulation in movement disorders. Neurobiol Dis. 2012;46(1):1-18. doi:10.1016/j.nbd.2011.12.054
- Langkammer C, Pirpamer L, Seiler S, et al. Quantitative susceptibility mapping in Parkinson’s disease. PLoS One. 2016;11(9):1-13. doi:10.1371/journal.pone.0162460
- An H, Zeng X, Niu T, et al. Quantifying iron deposition within the substantia nigra of Parkinson’s disease by quantitative susceptibility mapping. J Neurol Sci. 2018;386(December 2017):46-52. doi:10.1016/j.jns.2018.01.008
- Barbosa JHO, Santos AC, Tumas V, et al. Quantifying brain iron deposition in patients with Parkinson’s disease using quantitative susceptibility mapping, R2 and R2*. Magn Reson Imaging. 2015;33(5):559-565. doi:10.1016/j.mri.2015.02.021
- Shahmaei V, Faeghi F, Mohammdbeigi A, Hashemi H, Ashrafi F. Evaluation of iron deposition in brain basal ganglia of patients with Parkinson’s disease using quantitative susceptibility mapping. Eur J Radiol Open. 2019;6(April):169-174. doi:10.1016/j.ejro.2019.04.005
- Thomas GEC, Leyland LA, Schrag AE, Lees AJ, Acosta-Cabronero J, Weil RS. Brain iron deposition is linked with cognitive severity in Parkinson’s disease. J Neurol Neurosurg Psychiatry. 2020;91(4):418-425. doi:10.1136/jnnp-2019-322042
- O’Callaghan J, Holmes H, Powell N, et al. Tissue magnetic susceptibility mapping as a marker of tau pathology in Alzheimer’s disease. Neuroimage. 2017;159:334-345. doi:10.1016/j.neuroimage.2017.08.003
- Granziera C, Wuerfel J, Barkhof F, et al. Quantitative magnetic resonance imaging towards clinical application in multiple sclerosis. Brain. 2021;144(5):1296-1311. doi:10.1093/brain/awab029
- Eskreis-Winkler S, Zhang Y, Zhang J, et al. The clinical utility of QSM: disease diagnosis, medical management, and surgical planning. NMR Biomed. 2017;30(4). doi:10.1002/nbm.3668
- Goodkin O, Pemberton H, Vos SB, et al. The quantitative neuroradiology initiative framework: application to dementia. Br J Radiol. 2019;92(1101):20190365. doi:10.1259/bjr.20190365
- Karsa A, Punwani S, Shmueli K. An optimized and highly repeatable MRI acquisition and processing pipeline for quantitative susceptibility mapping in the head-and-neck region. Magn Reson Med. 2020;84(6):3206-3222. doi:10.1002/mrm.28377
- Biondetti E, Karsa A, Thomas DL, Shmueli K. Investigating the accuracy and precision of TE-dependent versus multi-echo QSM using Laplacian-based methods at 3 T. Magn Reson Med. 2020;84(6):3040-3053. doi:10.1002/mrm.28331
- Karsa A, Punwani S, Shmueli K. The effect of low resolution and coverage on the accuracy of susceptibility mapping. Magn Reson Med. 2019;81(3):1833-1848. doi:10.1002/mrm.27542
- Kiersnowski OC, Karsa A, Wastling SJ, Thornton JS, Shmueli K. The Effect of Oblique Image Acquisition on the Accuracy of Quantitative Susceptibility Mapping and a Robust Tilt Correction Method. bioRxiv. Published online January 1, 2021:2021.11.30.470544. doi:10.1101/2021.11.30.470544
- Haacke EM, Liu S, Buch S, Zheng W, Wu D, Ye Y. Quantitative susceptibility mapping: Current status and future directions. Magn Reson Imaging. 2015;33(1):1-25. doi:10.1016/j.mri.2014.09.004
- Liu T, Wisnieff C, Lou M, Chen W, Spincemaille P, Wang Y. Nonlinear formulation of the magnetic field to source relationship for robust quantitative susceptibility mapping. Magn Reson Med. 2013;69(2):467-476. doi:10.1002/mrm.24272
- Biondetti E, Karsa A, Grussu F, Thomas DL, Shmueli K. Multi-echo quantitative susceptibility mapping : how to combine echoes for accuracy and precision at 3 Tesla. 2022;(January):1-16. doi:10.1002/mrm.29365
- Schofield MA, Zhu Y. Fast phase unwrapping algorithm for interferometric applications. Opt Lett. 2003;28(14):1194. doi:10.1364/ol.28.001194
- Dymerska B, Eckstein K, Bachrata B, et al. Phase unwrapping with a rapid opensource minimum spanning tree algorithm (ROMEO). Magn Reson Med. 2021;85(4):2294-2308. doi:10.1002/mrm.28563
- Zhou D, Liu T, Spincemaille P, Wang Y. Background field removal by solving the Laplacian boundary value problem. NMR Biomed. 2014;27(3):312-319. doi:10.1002/nbm.3064
- Liu T, Khalidov I, de Rochefort L, et al. A novel background field removal method for MRI using projection onto dipole fields (PDF). NMR Biomed. 2011;24(9):1129-1136. doi:10.1002/nbm.1670
- Milovic C, Bilgic B, Zhao B, Acosta-Cabronero J, Tejos C. Fast nonlinear susceptibility inversion with variational regularization. Magn Reson Med. 2018;80(2):814-821. doi:10.1002/mrm.27073
- Milovic C, Bilgic B, Zhao B, Langkammer C, Tejos C, Acosta-Cabronero J. Weak-harmonic regularization for quantitative susceptibility mapping. Magn Reson Med. 2019;81(2):1399-1411. doi:10.1002/mrm.27483
- Polak D, Chatnuntawech I, Yoon J, et al. Nonlinear dipole inversion (NDI) enables robust quantitative susceptibility mapping (QSM). NMR Biomed. 2020;33(12). doi:10.1002/nbm.4271
- Milovic C, Shmueli K. Automatic, Non-Regularized Nonlinear Dipole Inversion for Fast and Robust Quantitative Susceptibility Mapping. In: In Proceedings of ISMRM & SMRT Annual Meeting . ; 2021.
- Hansen PC, O’Leary DP. The Use of the L-Curve in the Regularization of Discrete Ill-Posed Problems. SIAM Journal on Scientific Computing. 1993;14(6):1487-1503. doi:10.1137/0914086
- Smith SM. Fast robust automated brain extraction. Hum Brain Mapp. 2002;17(3):143-155. doi:10.1002/hbm.10062
- Karsa A, Shmueli K. A New, Simple Two-Pass Masking Approach for Streaking Artifact Removal in Any QSM Pipeline (Abstract #2462). In: In Proceedings of ISMRM & SMRT Annual Meeting . ; 2021.
- Dexter DT, Jenner P, Schapira AHV, Marsden CD. Alterations in levels of iron, ferritin, and other trace metals in neurodegenerative diseases affecting the basal ganglia. Ann Neurol. 1992;32(1 S):S94-S100. doi:10.1002/ana.410320716
- Mazzucchi S, Frosini D, Costagli M, et al. Quantitative susceptibility mapping in atypical Parkinsonisms. Neuroimage Clin. 2019;24. doi:10.1016/j.nicl.2019.101999
- Yu K, Ren Z, Li J, Guo S, Hu Y, Li Y. Direct visualization of deep brain stimulation targets in patients with Parkinson’s disease via 3-T quantitative susceptibility mapping. doi:10.1007/s00701-021-04715-4/Published
- Marques JP, Meineke J, Milovic C, et al. QSM reconstruction challenge 2.0: A realistic in silico head phantom for MRI data simulation and evaluation of susceptibility mapping procedures. Magn Reson Med. 2021;86(1):526-542. doi:10.1002/mrm.28716
- Milovic C, Tejos C, Irarrazaval P. Structural Similarity Index Metric setup for QSM applications (XSIM). In: 5th International Workshop on MRI Phase Contrast & Quantitative Susceptibility Mapping. ; 2019.
Figures
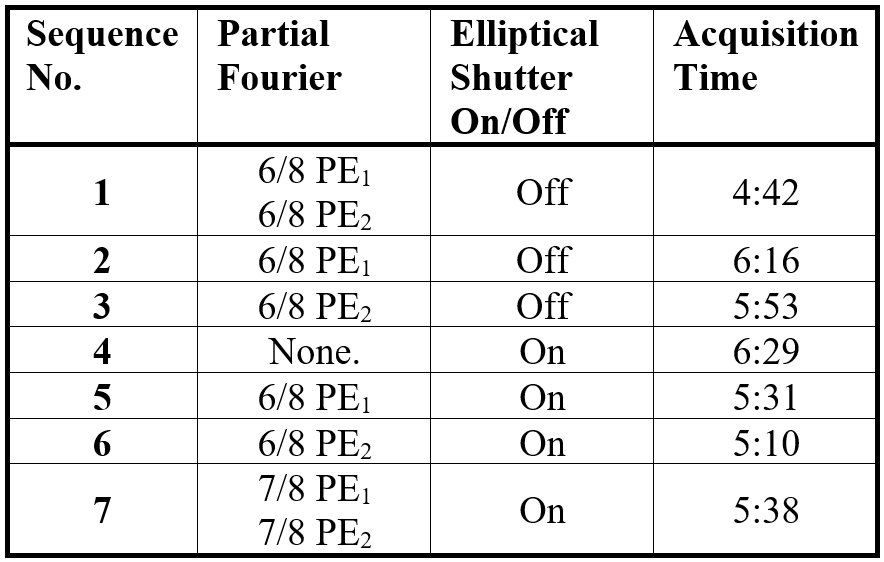
Table 1: All multi-echo 3D
gradient echo protocols that were compared for use in clinically acquiring QSM
data for investigating movement disorders. The effect of partial Fourier in each
and both PE directions was investigated, together with an elliptical k-space shutter. Sequence 7 was found
to have the best trade-off between image quality and acquisition time as shown
in Figure 2.
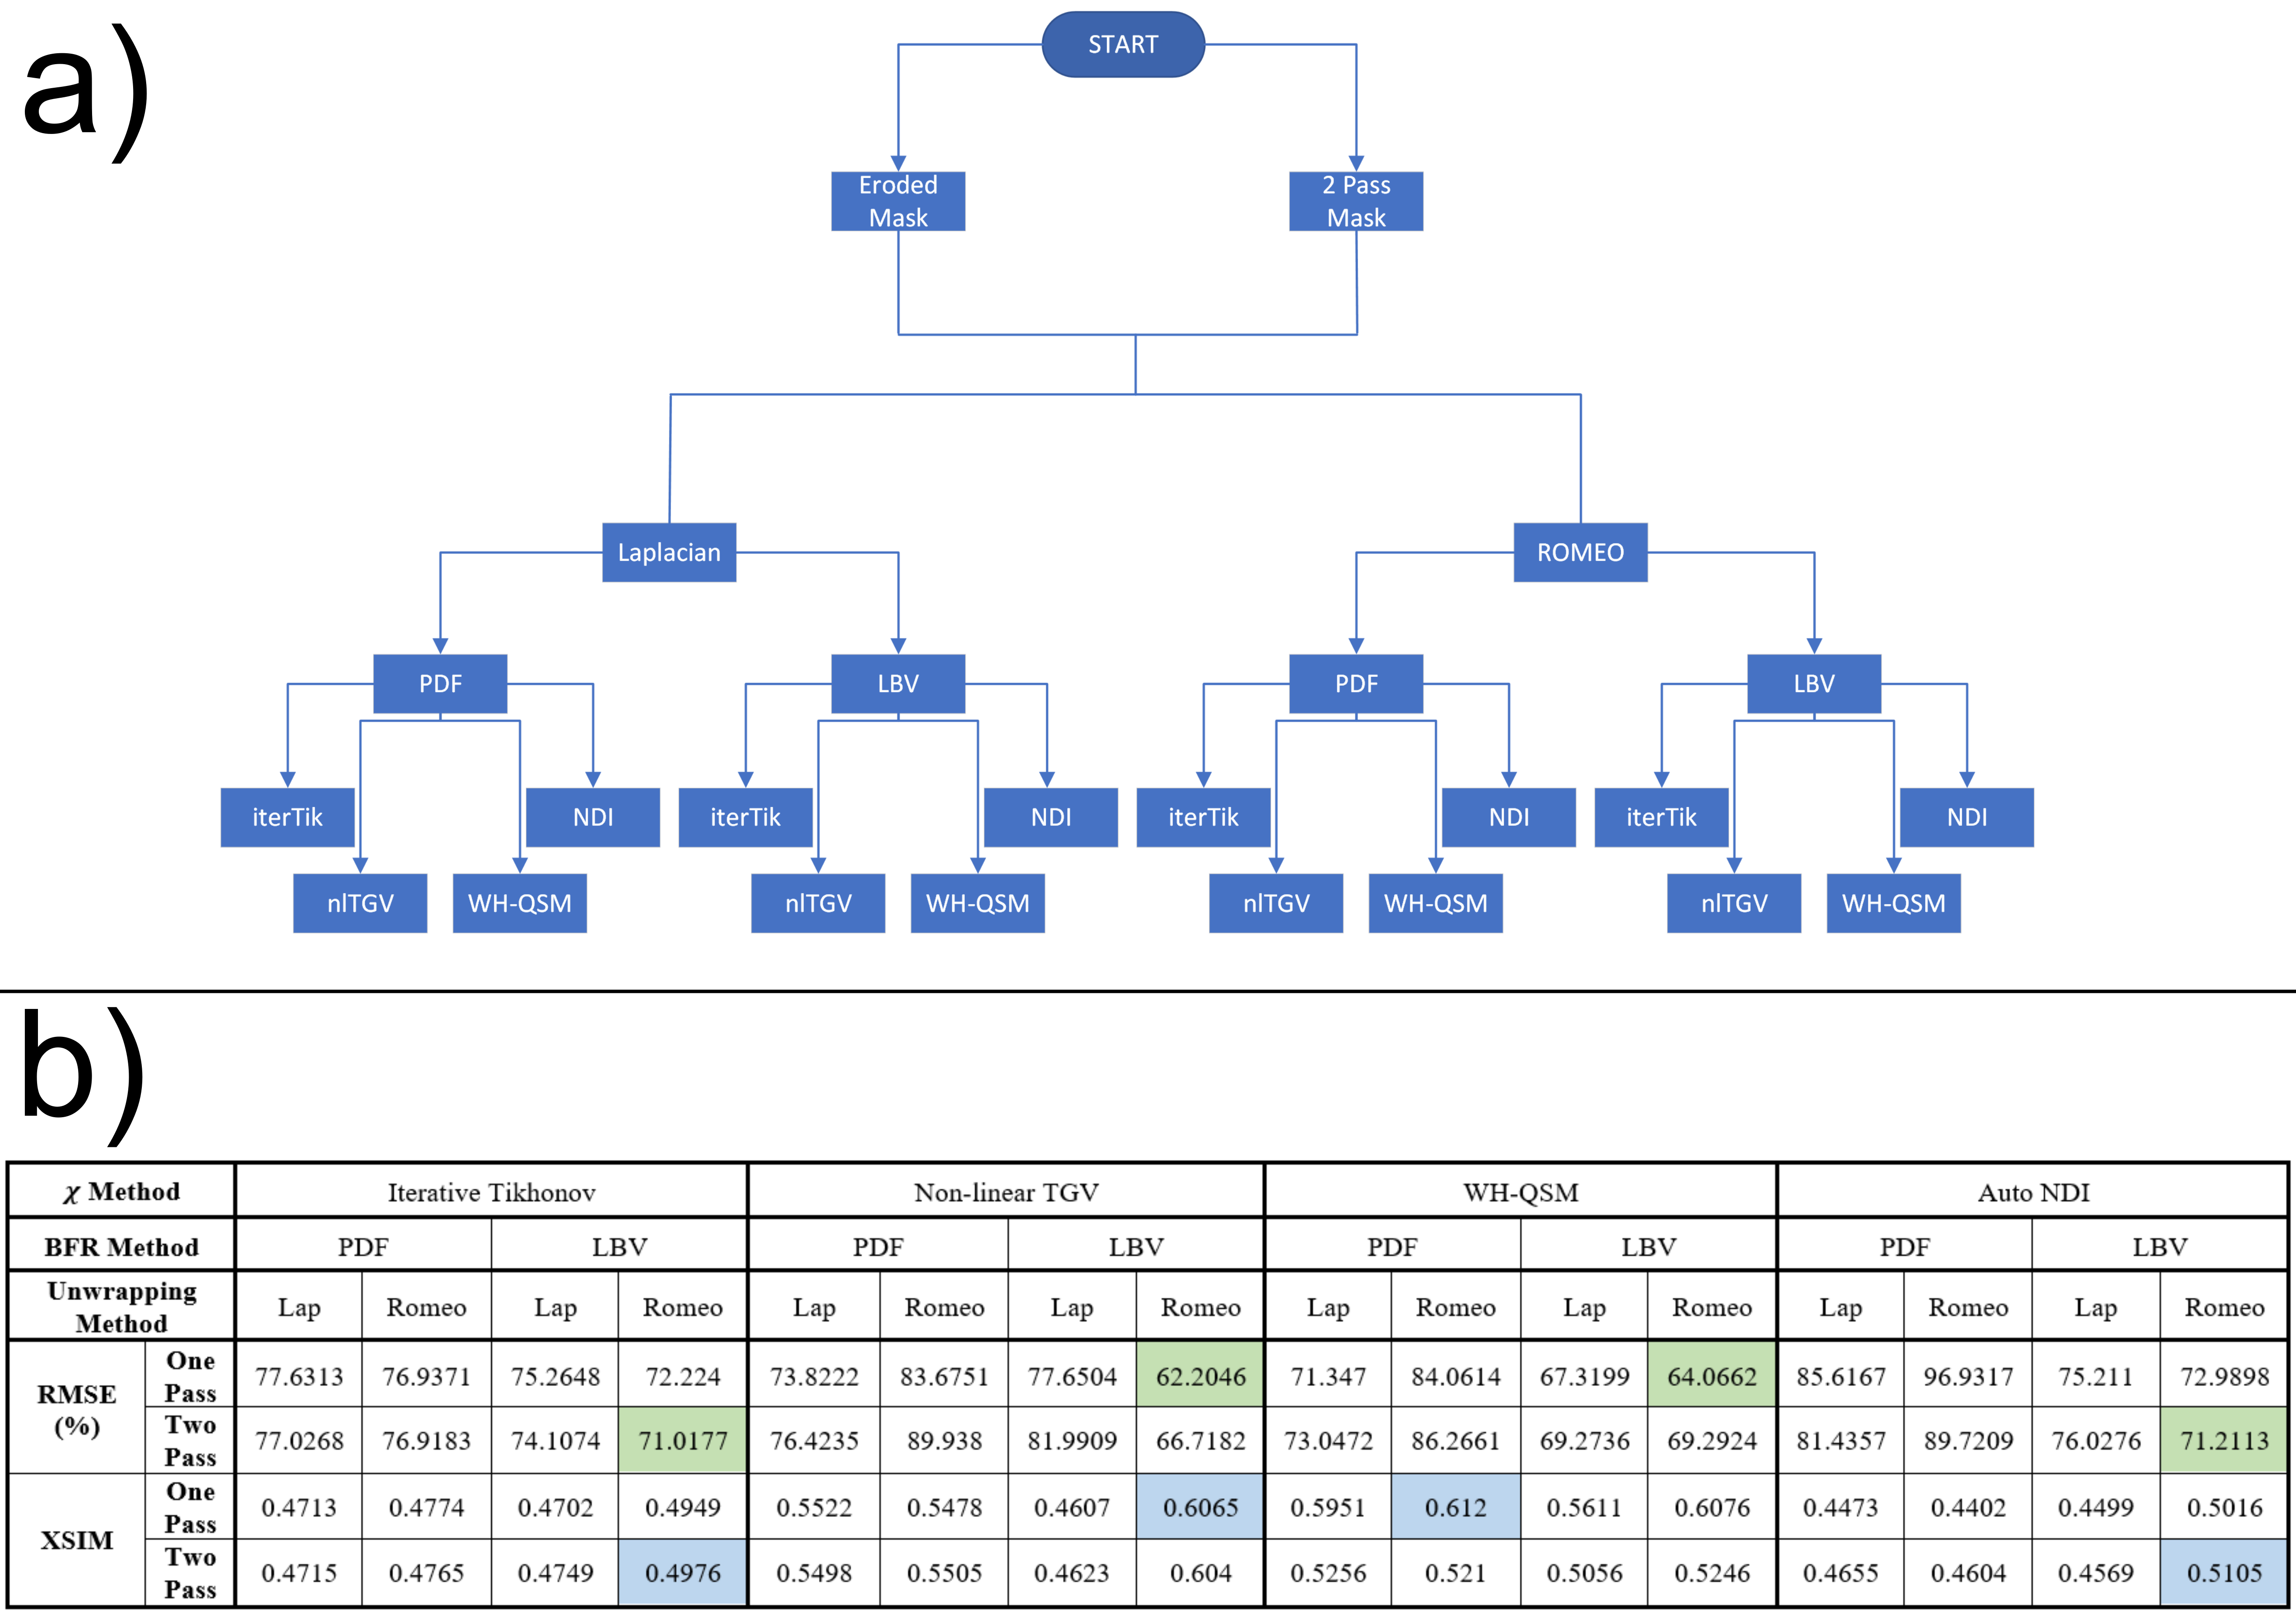
Figure 1: a) All QSM pipelines
tested. b) RMSE and XSIM scores for all pipelines run on the QSM
Challenge 2.0 numerical phantom agree for all χ calculation methods except WH-QSM. Optimal
RMSE and XSIM for each χ calculation method are green and blue,
respectively. Optimal RMSE were obtained with ROMEO unwrapping and LBV
background field removal, and show that two-pass masking is superior to
single-pass for iterative Tikhonov and auto NDI, but not nlTGV and WH-QSM.
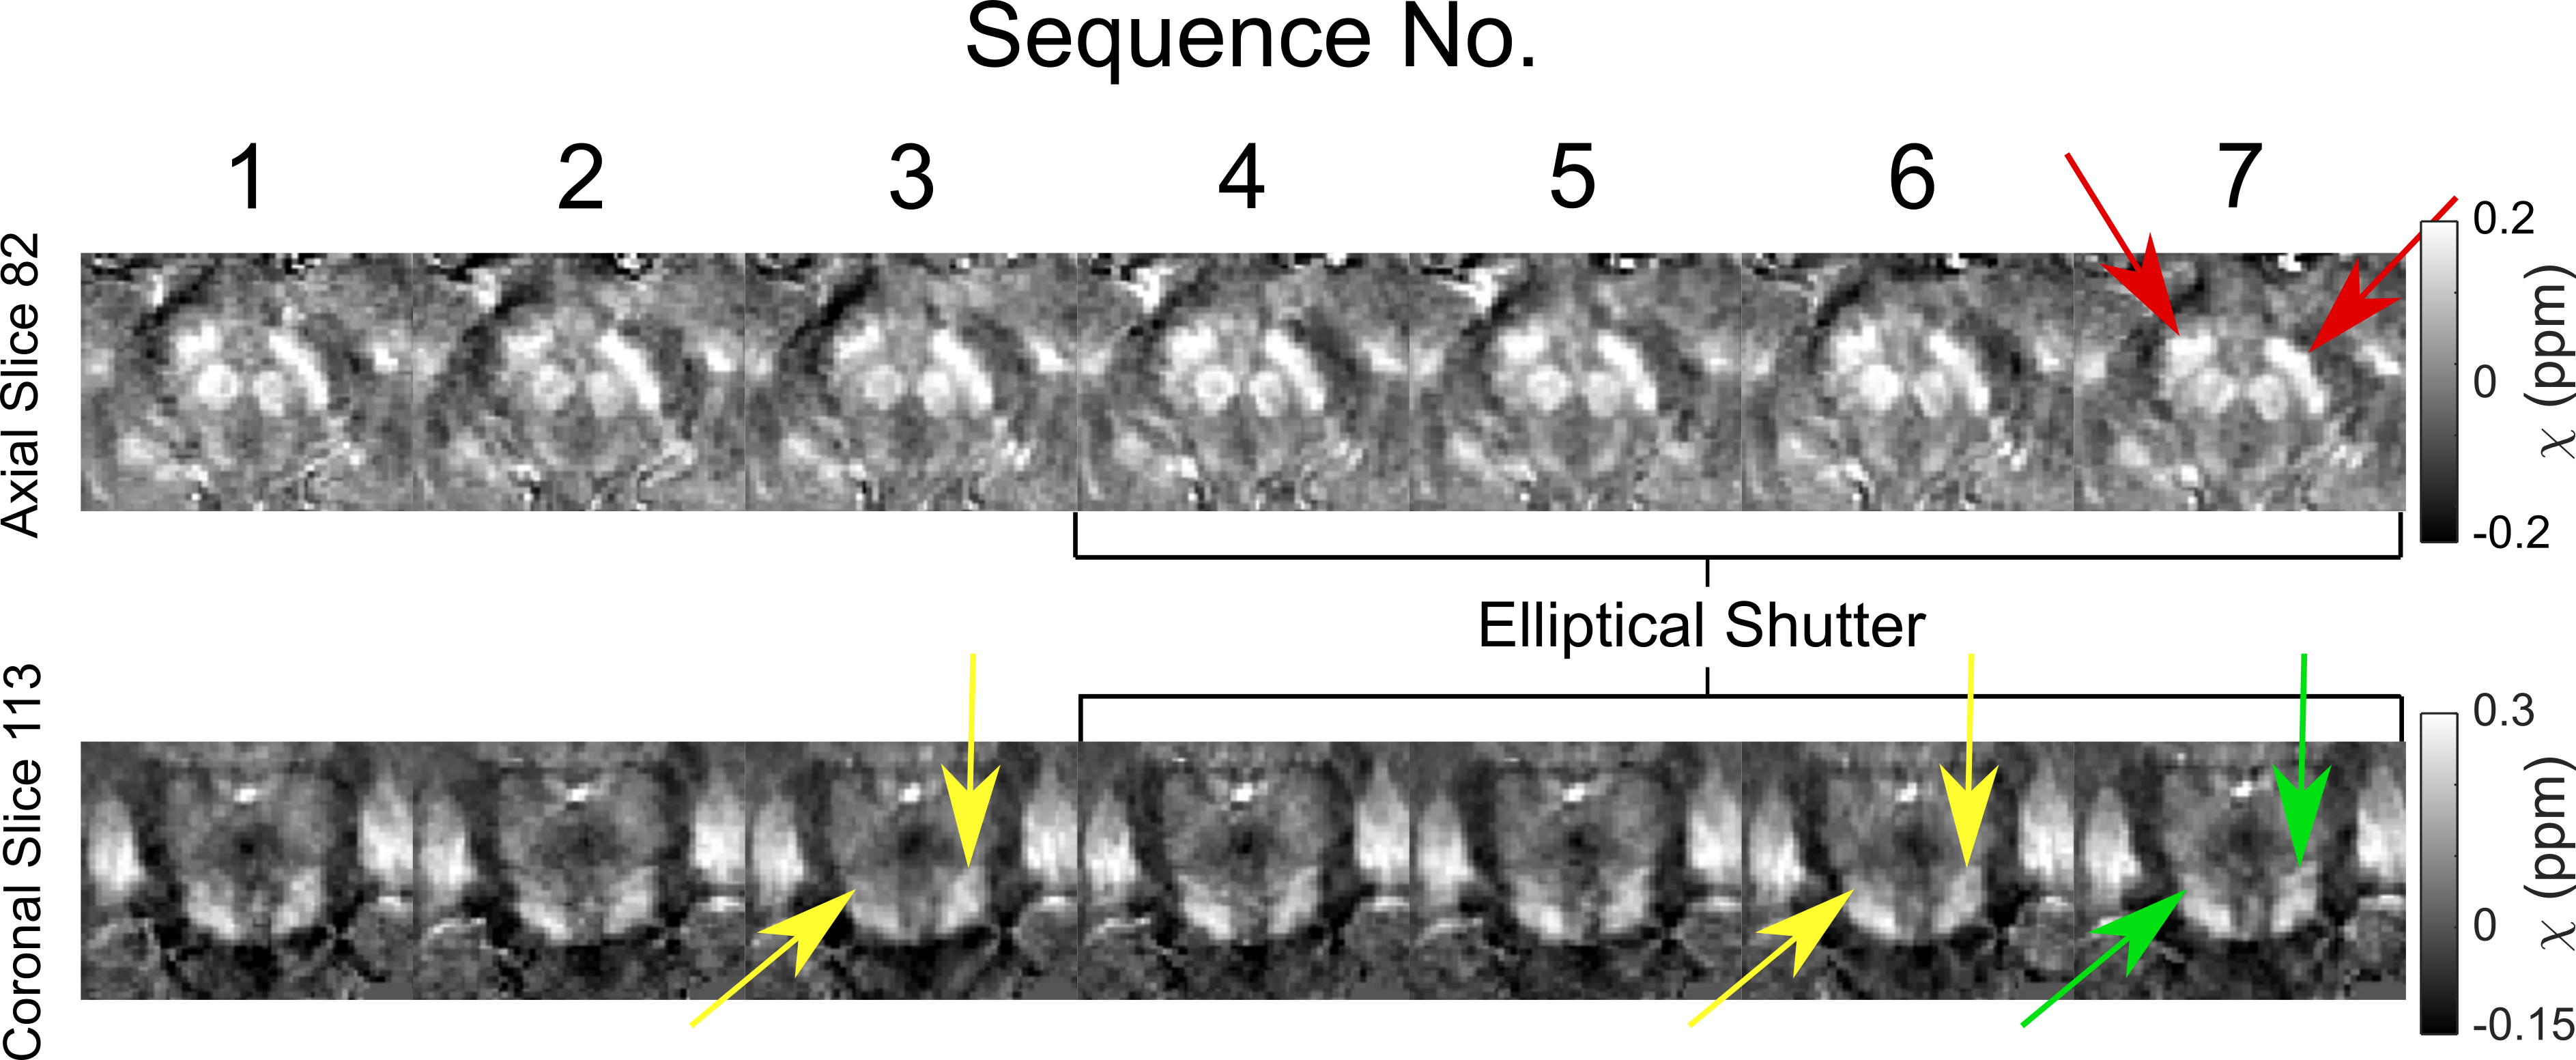
Figure 2: Axial and coronal
views of basal ganglia regions for all sequences tested (see Table 1). Red
arrows indicate where sequence 7, taken forward for preliminary clinical use,
had high contrast and good delineation of the substantia nigra (red arrows) and
subthalamic nuclei (green arrows), compared to other sequences. Partial Fourier
in the slice-direction (sequences 3&6) blurred the separation between
smaller brain stem structures (yellow arrows).
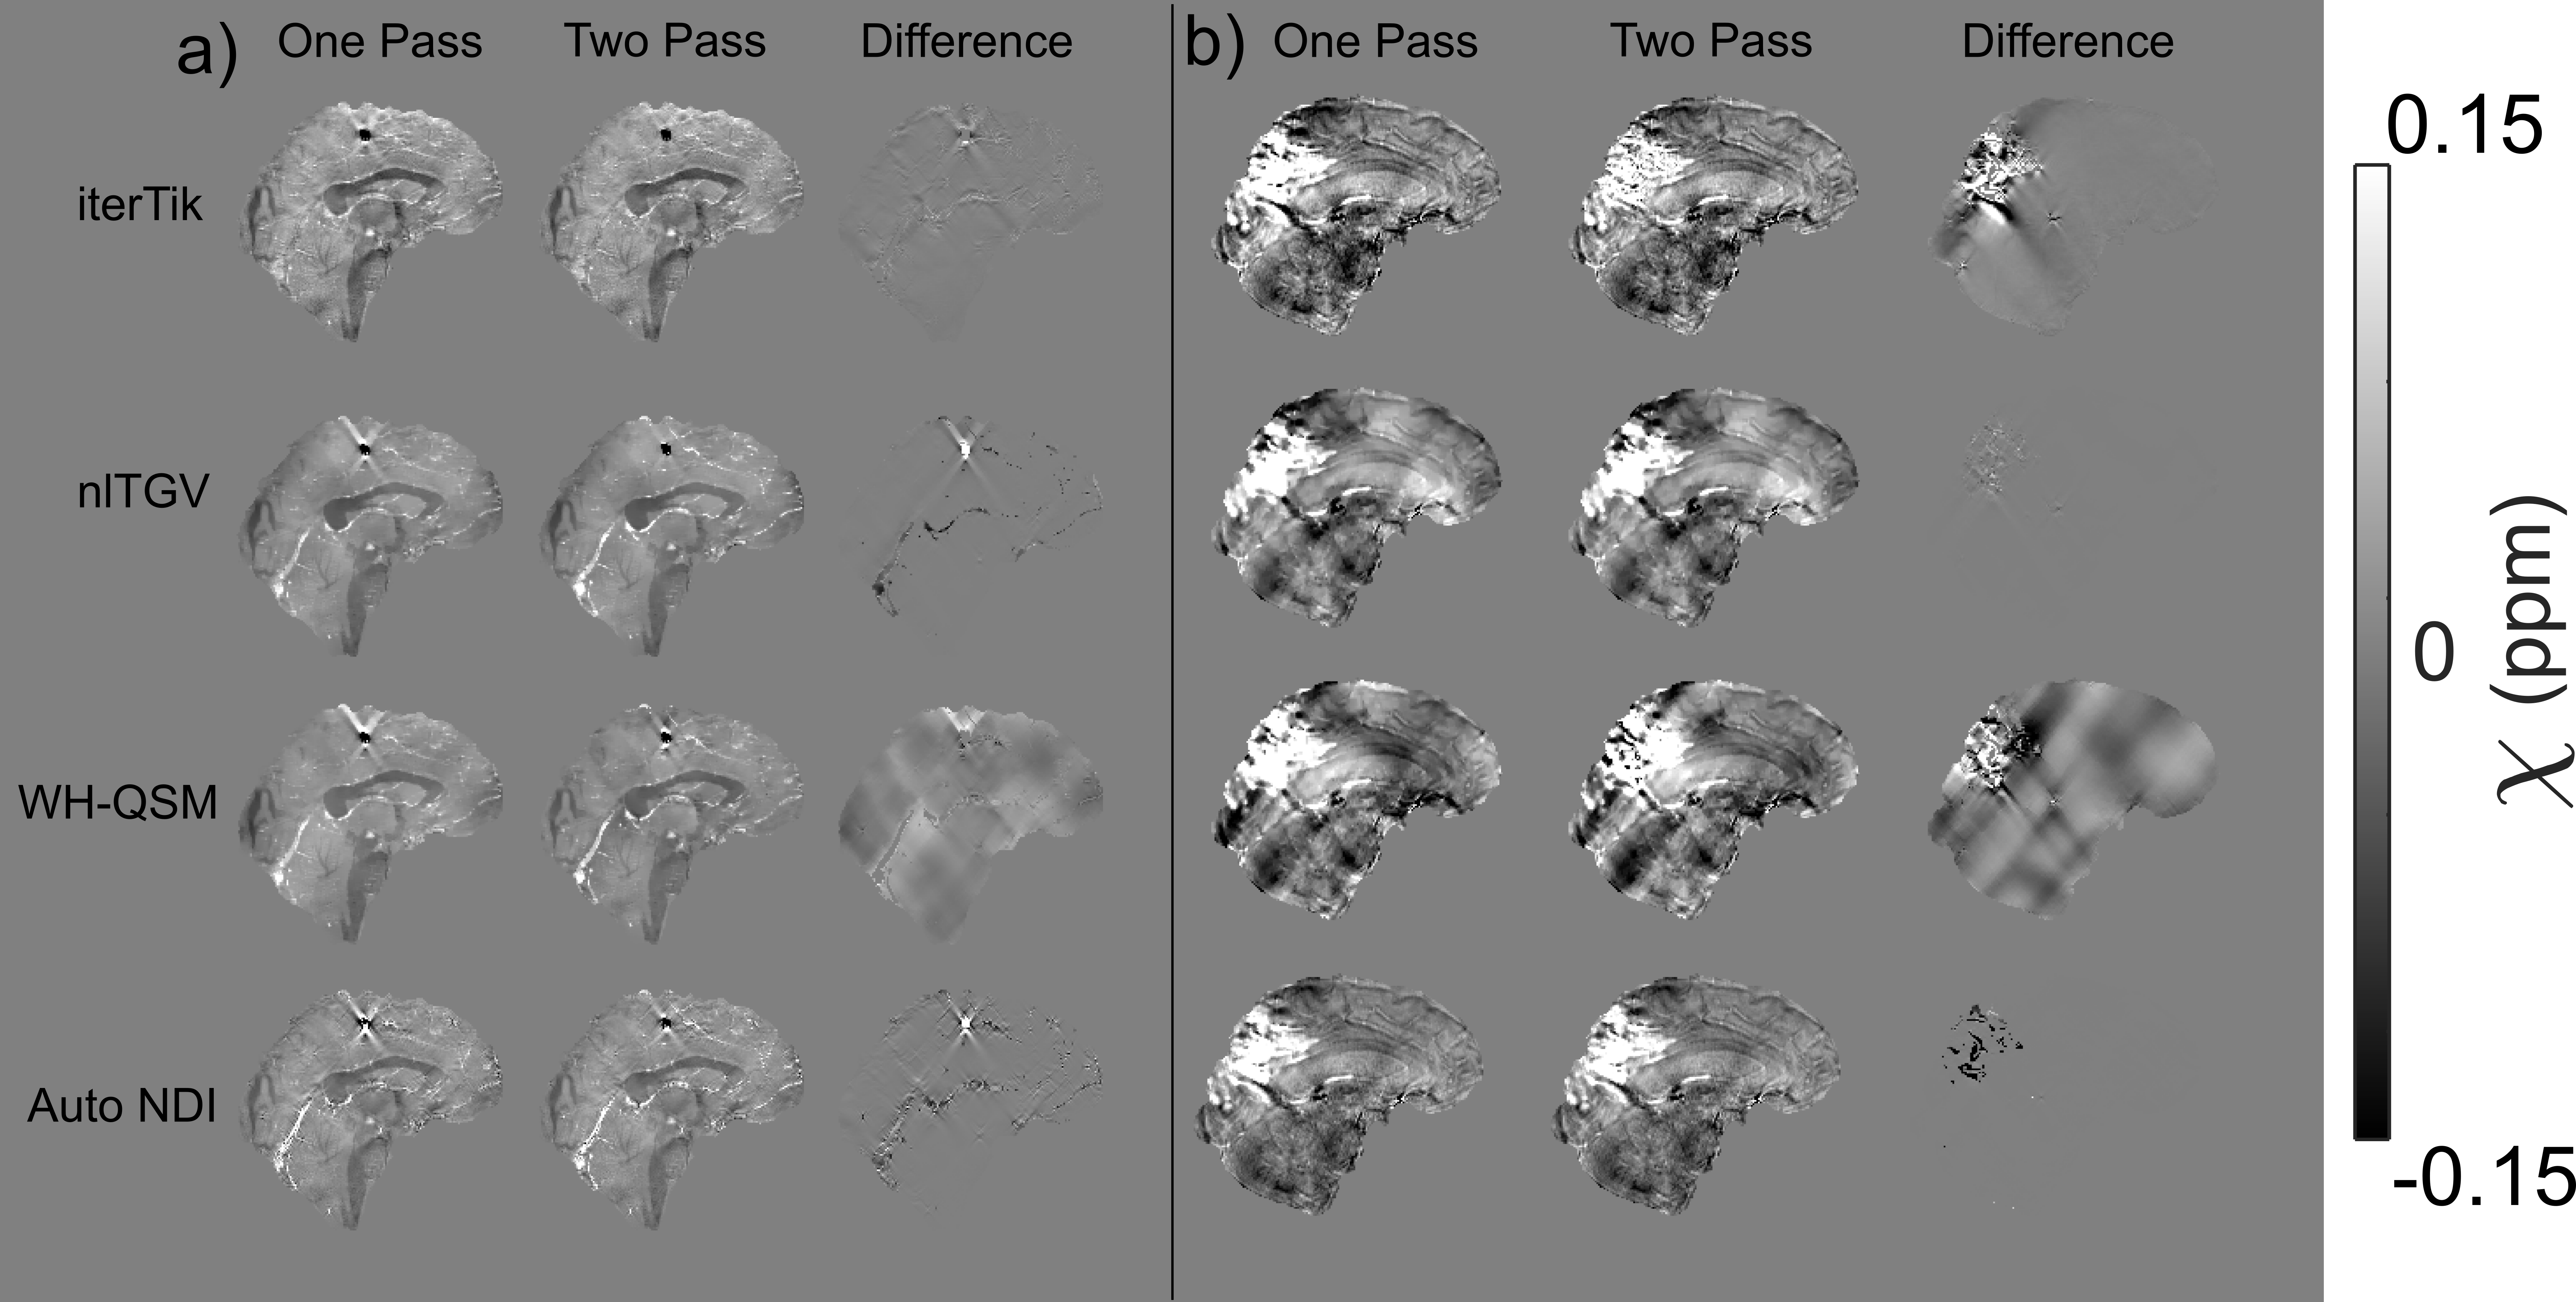
Figure 3: a) One vs.
two-pass masking for all χ calculation methods using the optimised ROMEO
+ LBV pipeline in the numerical phantom. b) One vs. two-pass masking
with the same pipeline for an example patient in vivo with paramagnetic
pathology in the occipital lobe. All methods are improved by two-pass masking.
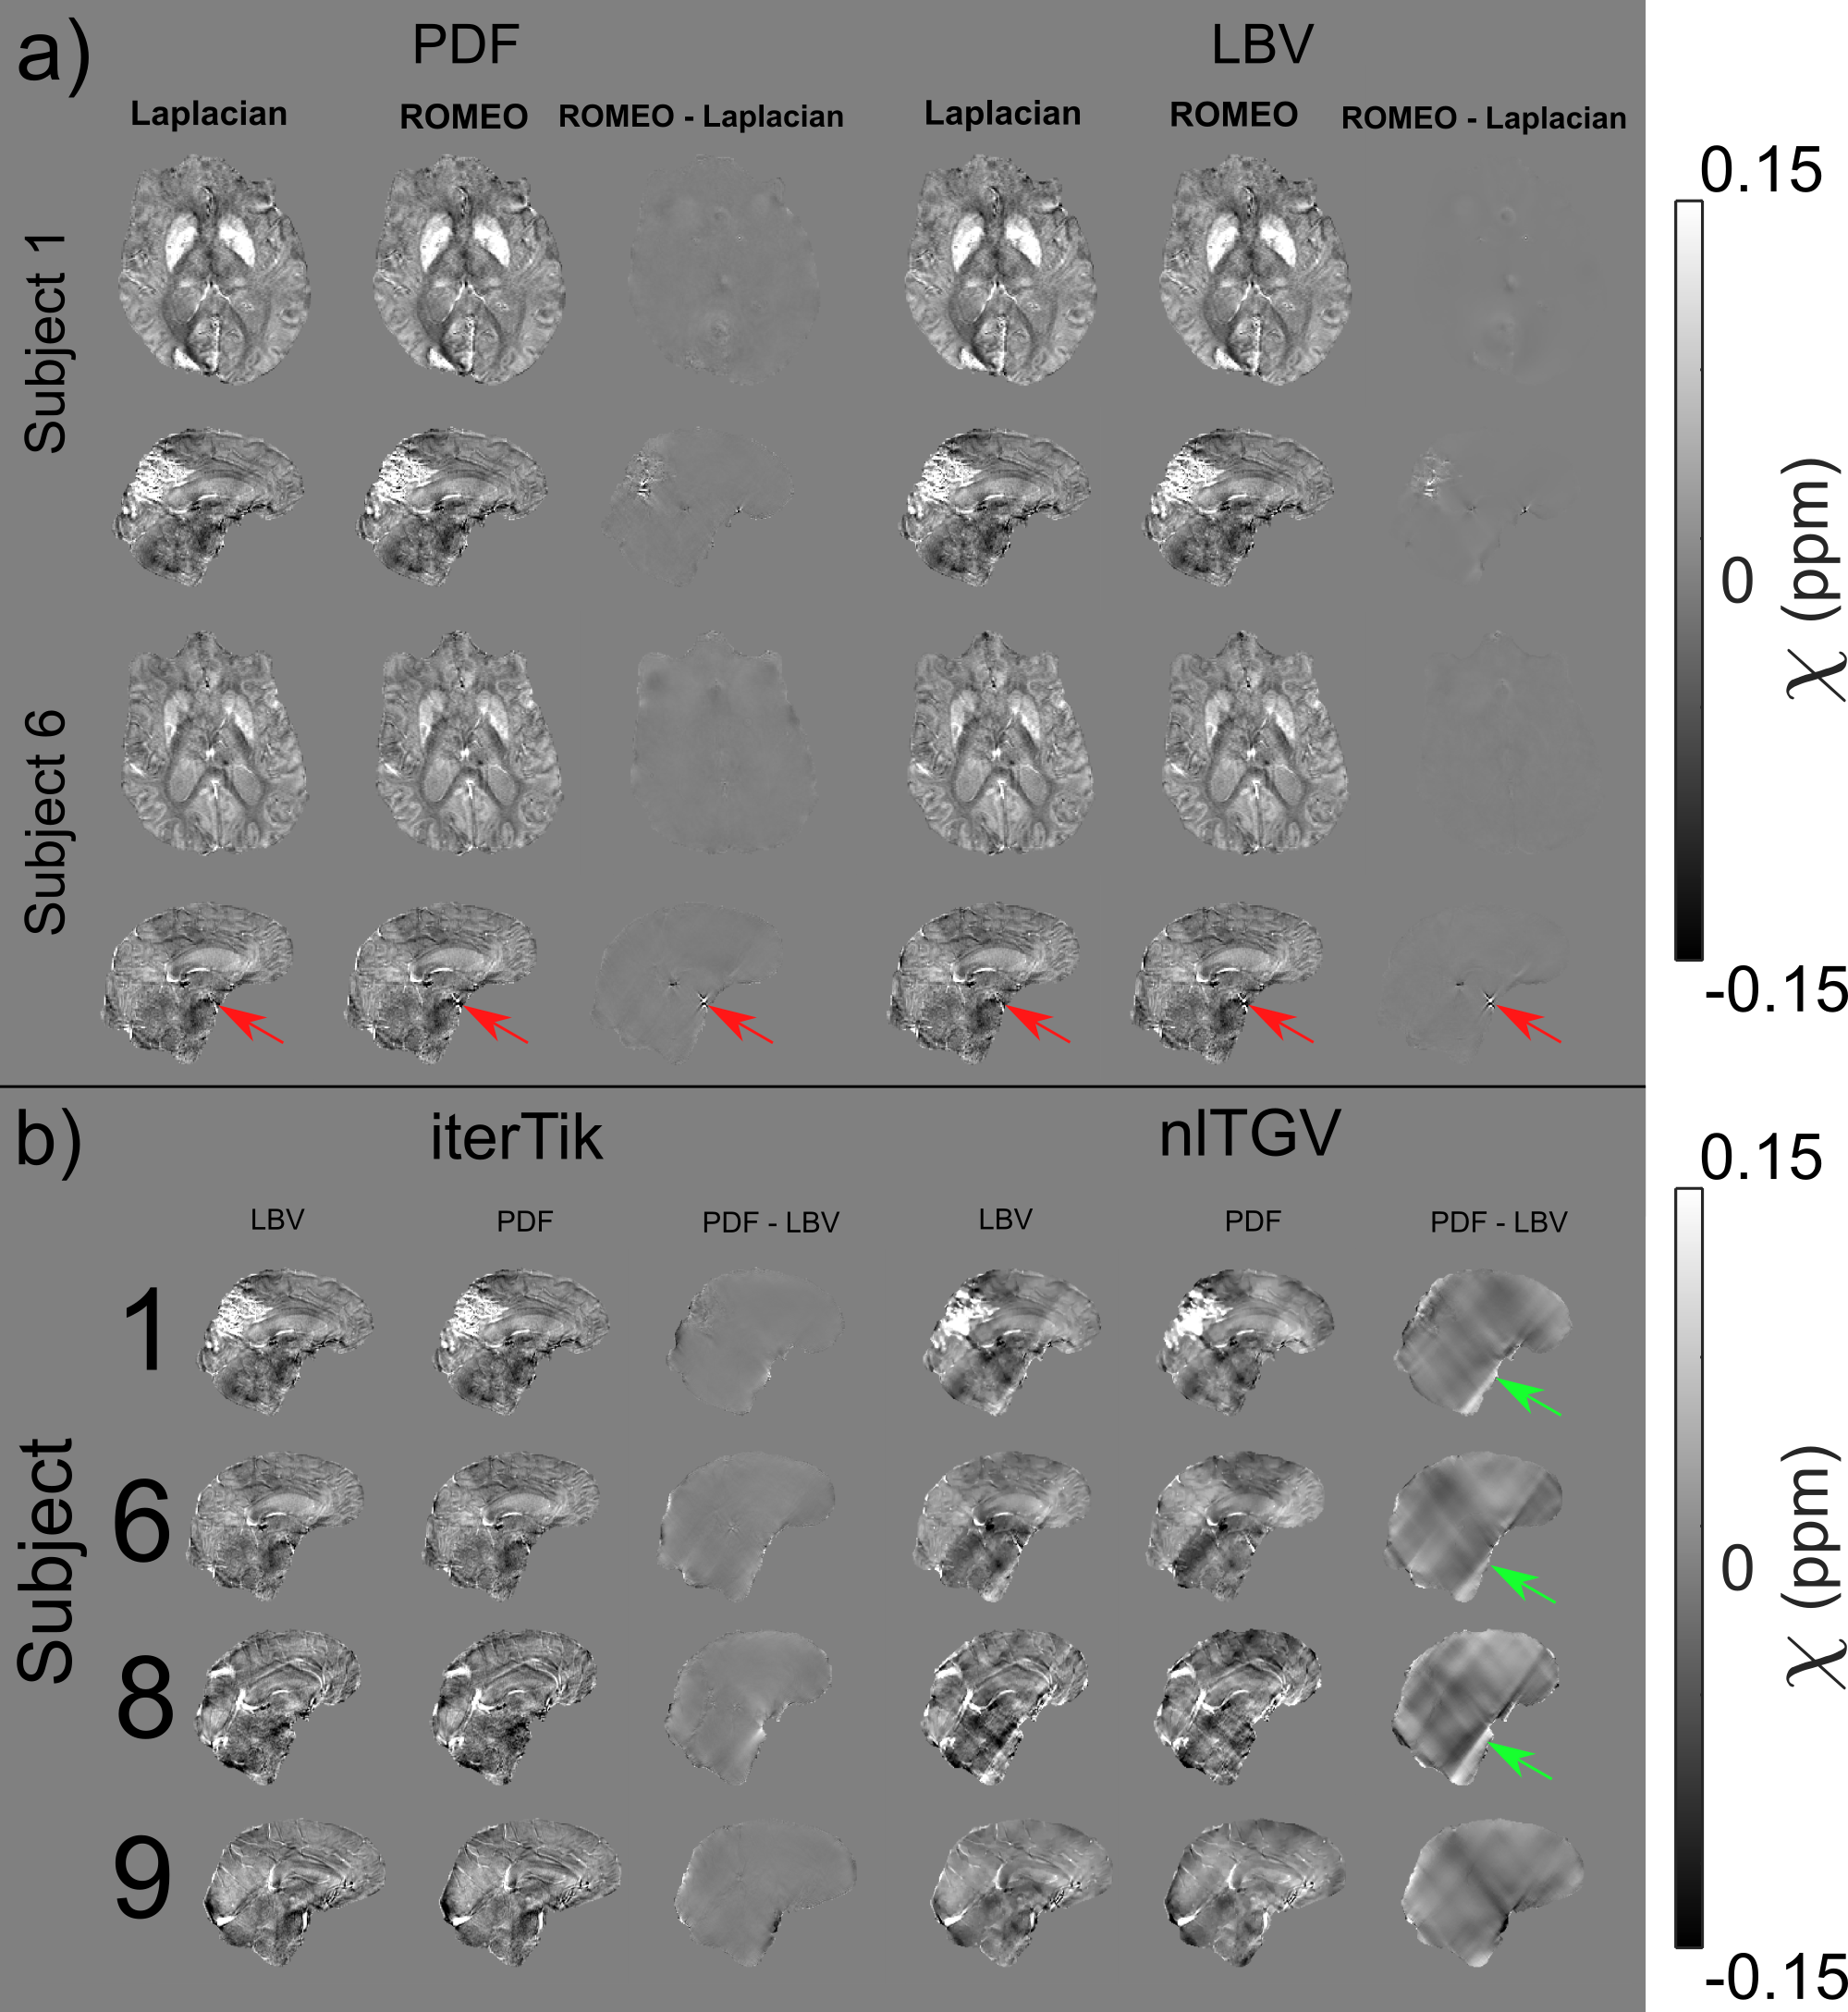
Figure 4: a) Laplacian and
ROMEO compared for PDF and LBV with iterative Tikhonov χ calculation. For both PDF and LBV, ROMEO
resulted in streaking artefacts in some subjects, e.g. subject 6. Results were
the same for nlTGV, WH-QSM and Automatic NDI. b) LBV and PDF background
field removal compared with Laplacian unwrapping and both iterative Tikhonov
and nlTGV χ calculation. LBV resulted in more artefacts
than PDF, especially with nlTGV and WH-QSM (not shown).
DOI: https://doi.org/10.58530/2023/4173