4172
Subject-specific χ-separation method: the effect of introducing a personalised relaxometric constant Dr1Department of Brain and Behavioral Sciences, University of Pavia, Pavia, Italy, 2NMR Research Unit, Department of Neuroinflammation, Queen Square Multiple Sclerosis Centre, UCL Queen Square Institute of Neurology, University College London (UCL), London, United Kingdom, 3Brain Connectivity Centre Research Unit, IRCCS Mondino Foundation, Pavia, Italy
Synopsis
Keywords: Susceptibility, Modelling, Brain
χ-separation is a recently proposed biophysical model to separate the χ-positive and χ-negative contribution of magnetic susceptibility sources in the brain. Such a model relies on assuming a certain relaxometric constant (Dr) calculated as the mean of a group of healthy subjects. Here we demonstrate that Dr is subject-specific and if used in place of the average value, it affects the χ-positive and χ-negative maps in a structured way, while their sum remains similar.
INTRODUCTION
Quantitative susceptibility mapping (QSM) is an established magnetic resonance imaging technique used to estimate the distribution of local magnetic susceptibility (χ) of tissue1. Tissue magnetic susceptibility is directly related to its chemical composition; in the brain, it has been shown that magnetic susceptibility originates primarily from two sources, which are iron and myelin2. Iron and myelin have opposite magnetic susceptibility characteristics: iron is paramagnetic (χpos: positive susceptibility) and myelin is diamagnetic (χneg: negative susceptibility). Both have been suggested as biomarkers for neurological disorders3-5, however traditional QSM is unable to differentiate between the two. Different models6 have been developed to separate these contributions by making different assumptions. One of these methods is called χ-separation method7 and estimates the individual concentration of the two sources starting from a local field map and a R2' = 1/T2' map. The relaxometric constant Dr is given by the ratio between R2' and QSM. The model is R2' (r) = Dr,pos(r) |χpos(r)| + Dr,neg(r) |χneg(r)| with the following main assumptions: i) Dr,pos can be extracted from regions characterised by high iron concentration and low myelination, e.g. deep grey matter (DGM) nuclei, and ii) Dr,pos = Dr,neg. In the original article, Dr,pos was then calculated in 5 healthy subjects and set to 137Hz/ppm for all following applications. The main aims of this work were to investigate whether (i) Dr was subject-specific, and (ii) how the χ-separation maps varied if using a subject-specific Dr value. In order to do so, Dr was calculated in DGM nuclei on a retrospective cohort of healthy controls and the subject-specific Dr was fed into the model.METHODS
Subjects & AcquisitionThe analysis was performed on a retrospective cohort of 17 healthy subjects (6 females; 38±9y).
MRI data were acquired with a 3T Philips Ingenia CX scanner. The protocol included: 1) multi-echo 3D tilted sagittal spoiled gradient-echo (SPGR) (8 echoes, TE1/ΔTE=2.3/3.3ms, TR=28.5ms, flip angle=24°, 1x1x1mm3) for QSM and T2* calculations; 2) 3D sagittal T1-weighted (3DT1) MPRAGE (TE=3.2ms, TR=6.9ms, flip angle=8°, 1x1x1mm3) for tissue segmentation. No dedicated quantitative T2 sequence was available; quantitative T2 was therefore obtained from two images with different TE and same readout: i) T2-weighted S0 image from the fit of a multi-slice single shot inversion recovery (TR/TE=6885/59 ms, 2x2x2 mm3, 12 inversion times from 50ms to 1910ms), ii) b0 volume from a diffusion MRI acquisition (TR/TE = 6287/96 ms, 2x2x2 mm3).
Preprocessing
For each subject, QSM were reconstructed from the complex SPGR data using a pipeline8 including phase inconsistency removal, nonlinear complex fitting, Laplacian unwrapping and PDF background field removal form the MEDI toolbox9, with susceptibility calculated using iterative Tikhonov regularization10. T2* map was calculated from the magnitude of SPGR data using the MyRelax toolbox11. Quantitative T2 was calculated by 2-point fitting of T2-weighted S0 and b0 images.
Brain parcellation was performed on the 3DT1 volume using Geodesic Information Flows (GIF)12. Regions of interest such as the putamen, nucleus accumbens, globus pallidus and caudate nucleus were extracted bilaterally to obtain a DGM mask of all nuclei together. T2 map and DGM mask were registered to SPGR space of each subject using NiftyReg13.
χ-separation assumptions analysis
A R2' map was calculated from the T2 and T2* maps. A Dr voxelwise map was calculated for every subject by dividing R2' by QSM and the mean value within the DGM mask was calculated (Dr,pos )(Figure 1). The average Dr,pos across the entire cohort of subjects was also calculated. χpos, χneg and χtot maps were obtained with the χ-separation Matlab toolbox7 (Figure 2) using as input either the subject-specific Dr,pos or the average Dr,pos across the cohort. Maps of χpos, χneg and χtot differences were calculated by subtracting the maps obtained with the two methods. Histograms of maps calculated with the standard or subject-specific method and of their difference were also produced.
RESULTS
The distribution of mean Dr,pos values for our cohort of subjects is shown in Figure 3, were the green line represents the average Dr,pos across the cohort equal to (138.5±38) Hz/ppm.χ maps calculated with average Dr,pos showed structure-dependent differences from the ones calculated with subject-specific Dr,pos (Figure 4): histograms of the difference show that subject-specific maps have higher χpos and χneg values respect to those obtained with the cohort average Dr,pos.
DISCUSSION & CONCLUSIONS
Here we demonstrated that the relaxometric constant Dr in the χ-separation method is subject-specific and the cohort mean value may differ from the suggested 137 Hz/ppm7. Moreover, χpos and χneg maps showed a structure-dependent difference between the two methods while χtot was similar between the two methods. This brings to two considerations: the average Dr of a cohort may be different than the proposed one, so χ-separation should be run after calculating the cohort mean Dr,pos or, when available, the subject-specific value. The impact of calculating subject-specific χpos and χneg maps in pathological cases warrants further investigations.Acknowledgements
EG receives funding from TDC Technology Dedicated to Care. ED and FP receive funding from H2020 Research and Innovation Action Grants Human Brain Project (#785907, SGA2 and #945539, SGA3). ED receives funding from the MNL Project “Local Neuronal Microcircuits” of the Centro Fermi (Rome, Italy). CGWK receives funding from Horizon2020 (Human Brain Project SGA3, Specific Grant Agreement No. 945539 ), BRC (#BRC704/CAP/CGW), MRC (#MR/S026088/1), Ataxia UK, MS Society (#77), Wings for Life (#169111). CGWK is a shareholder in Queen Square Analytics Ltd.References
[1] Wang Y, Liu T. Quantitative susceptibility mapping (QSM): decoding MRI data for a tissue magnetic biomarker. Magn Reson Med 2015;73(1):82–101.[2] Duyn, J.H., Schenck, J., 2017. Contributions to magnetic susceptibility of brain tissue. NMR Biomed. 30, e3546. doi:10.1002/nbm.3546.
[3] Stephenson, E., Nathoo, N., Mahjoub, Y., Dunn, J.F., Yong, V.W., 2014. Iron in multiple sclerosis: roles in neurodegeneration and repair. Nat. Rev. Neurol. 10, 459–468. doi:10.1038/nrneurol.2014.118.
[4] Compston, A., Coles, A., 2008. Multiple sclerosis. Lancet 372, 1502–1517. doi:10.1016/s0140-6736(08)61620-7.
[5] Nave, K.-A., 2010. Myelination and support of axonal integrity by glia. Nature 468, 244– 252. doi:10.1038/nature09614.
[6] Schweser, F., Deistung, A., Lehr, B. W., Sommer, K., & Reichenbach, J. R. (2011, May). SEMI-TWInS: simultaneous extraction of myelin and iron using a T2*-weighted imaging sequence. In Proceedings of the 19th Meeting of the International Society for Magnetic Resonance in Medicine (p. 120).
[7] Shin,H.G, Lee, J. et al., χ-separation: Magnetic susceptibility source separation toward iron and myelin mapping in the brain, NeuroImage, Volume 240, 2021, 118371, ISSN 1053-8119, https://doi.org/10.1016/j.neuroimage.2021.118371.
[8] Ricciardi, A., Karsa, A., et al., " The effect of echo train length and TE range on multi-echo quantitative susceptibility mapping" ISMRM 2022.
[9] Karsa, A., Punwani, S., "An optimized and highly repeatable MRI acquisition and processing pipeline for quantitative susceptibility mapping in the head-and-neck region" https://doi.org/10.1002/mrm.28377
[10] Liu T, Liu J, de Rochefort L, et al., Morphology enabled dipole inversion (MEDI) from a single angle acquisition: comparison with COSMOS in human brain imaging. Magn Reson Med. 2011 Apr 4. doi: 10.1002/mrm.22816
[11] Grussu, F., Battiston, M., et al., "Multi-parametric quantitative in vivo spinal cord MRI with unified signal readout and image denoising", NeuroImage, Volume 217, 2020, 116884, ISSN 1053-8119,https://doi.org/10.1016/j.neuroimage.2020.116884.
[12] Cardoso MJ, Modat M, et al., Geodesic Information Flows: Spatially-Variant Graphs and Their Application to Segmentation and Fusion. IEEE Trans Med Imaging. 2015 Sep;34(9):1976-88. doi: 10.1109/TMI.2015.2418298. Epub 2015 Apr 14. PMID: 25879909.
[13] Ferran Prados, M. Jorge Cardoso, Ninon Burgos, Claudia AM Wheeler-Kingshott, Sebastien Ourselin. NiftyWeb: web based platform for image processing on the cloud. International Society for Magnetic Resonance in Medicine (ISMRM) 24th Scientific Meeting and Exhibition - Singapore 2016
Figures
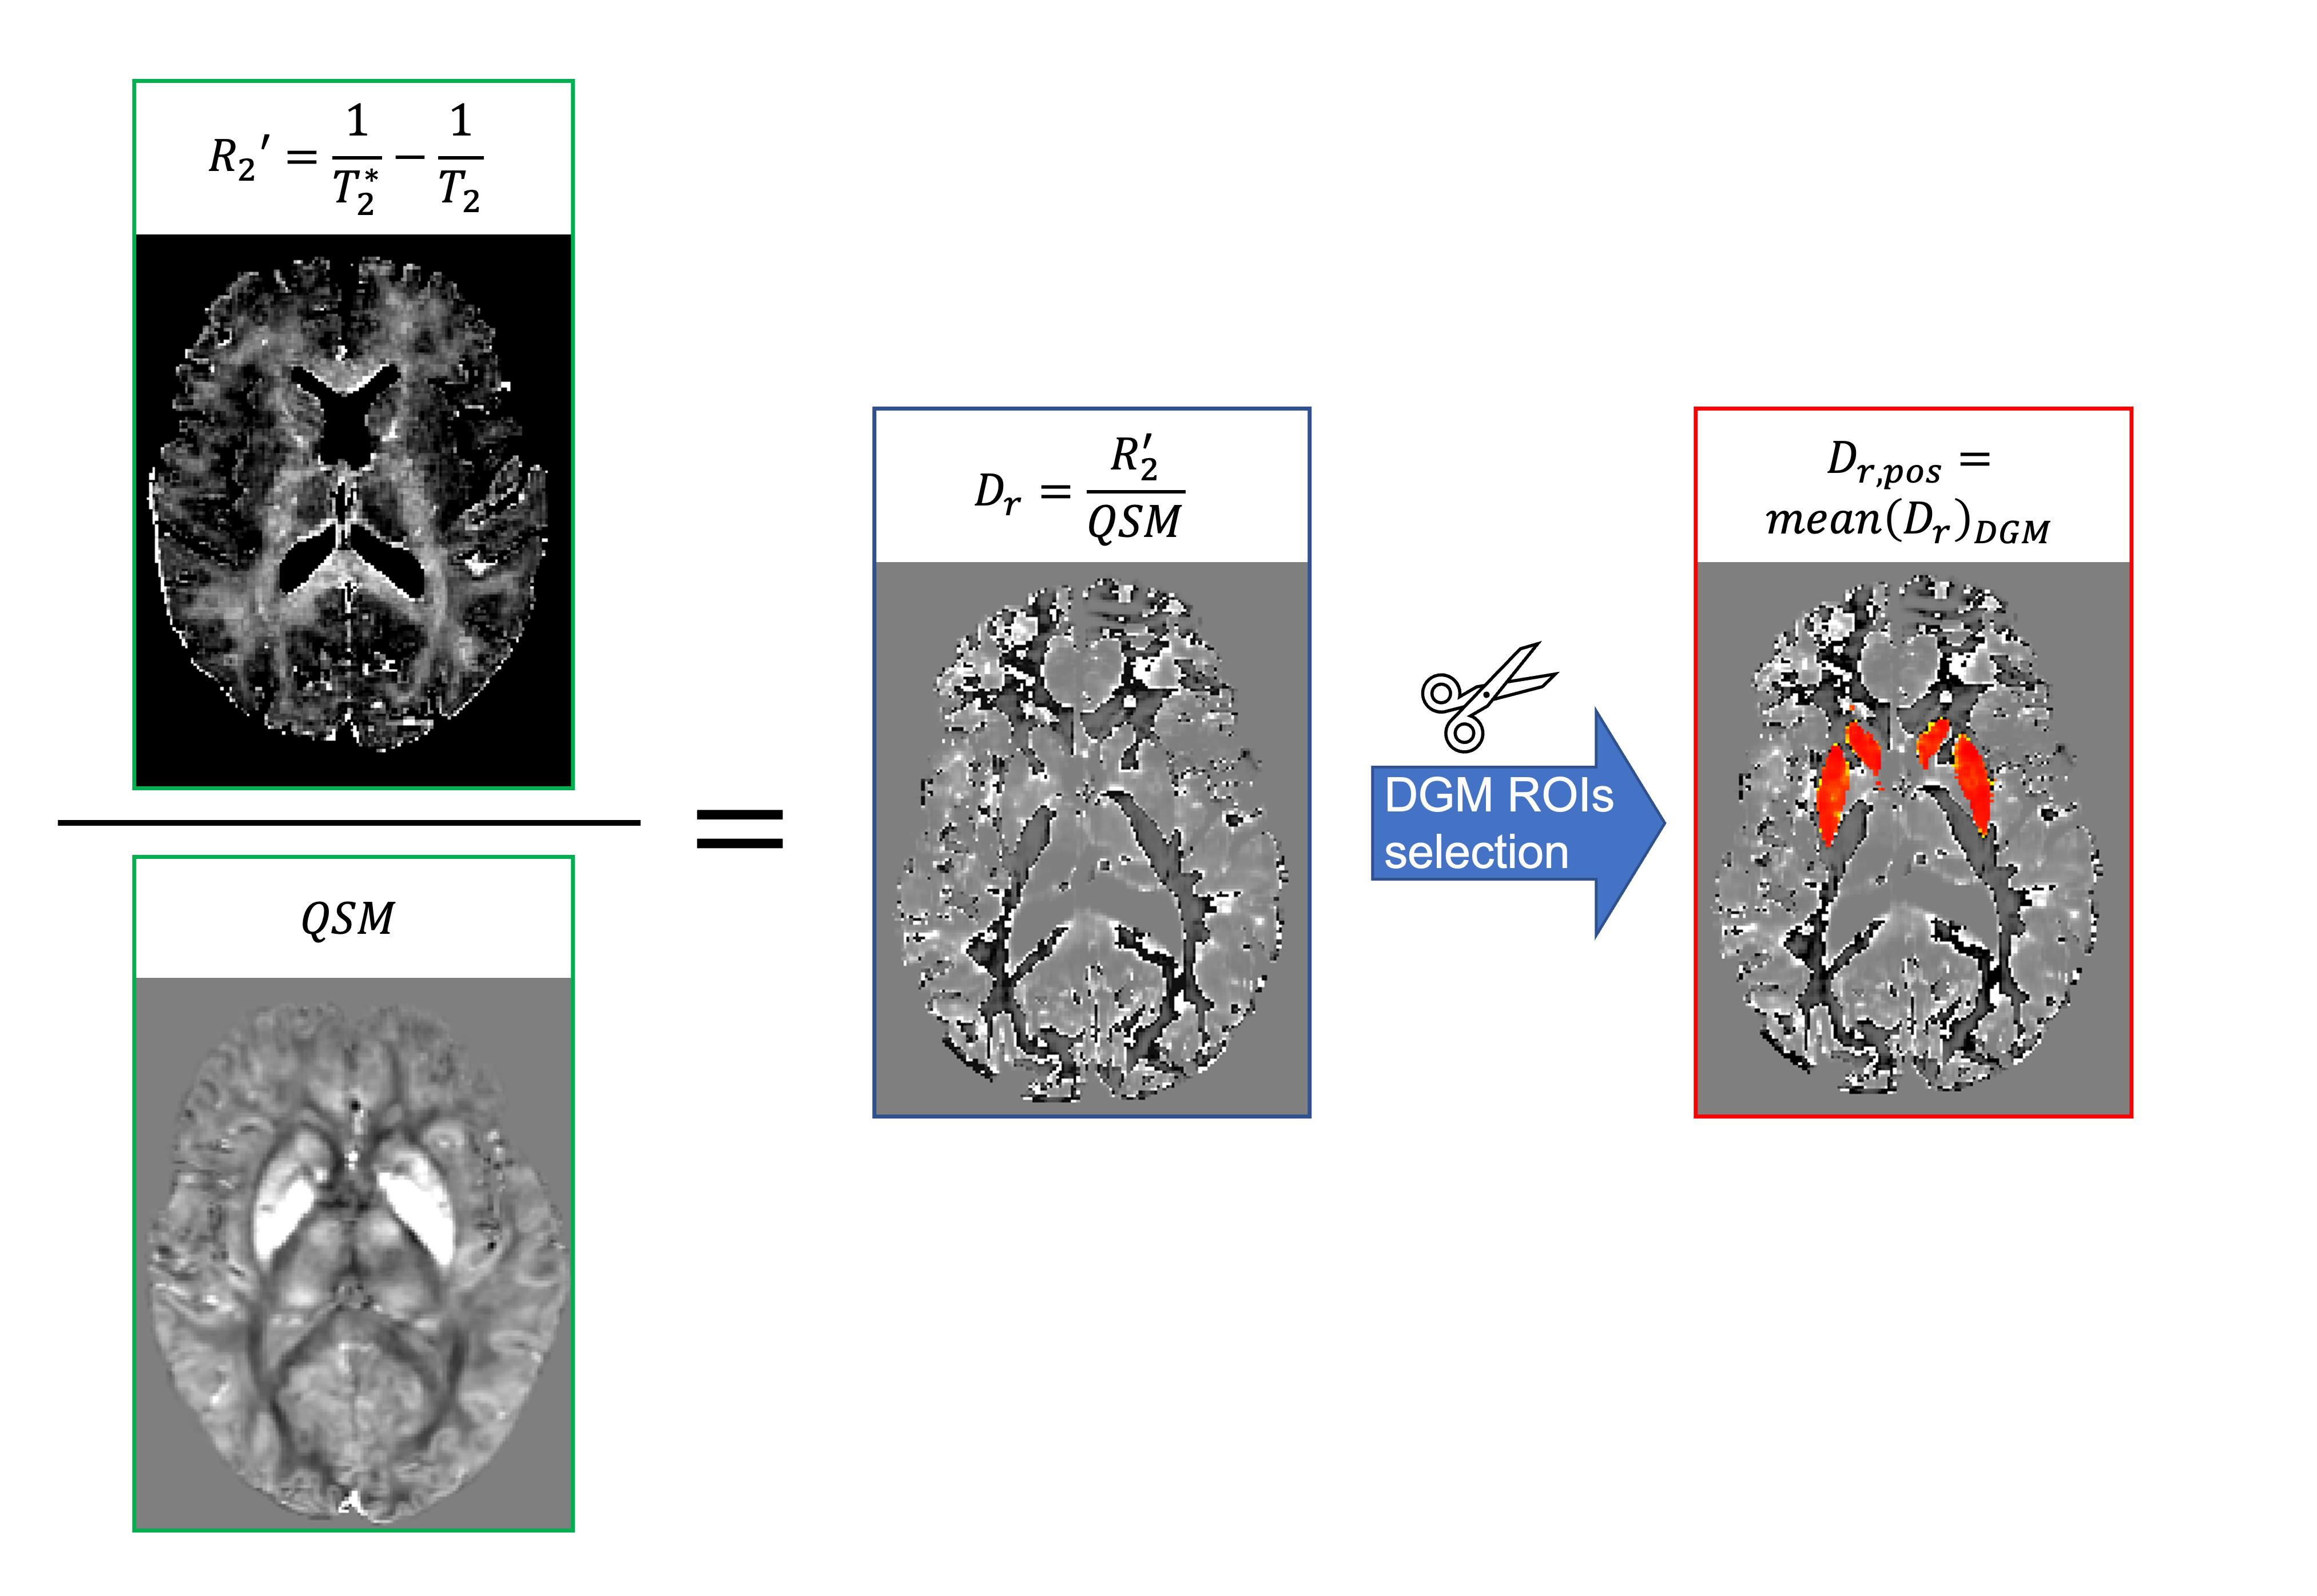
Figure 1 | Pipeline to obtain the relaxometric constant Dr,pos. Left: For every subject, the numerator corresponds to R2' map, which was calculated by using T2* and T2 maps, and the denominator corresponds to quantitative susceptibility map (QSM). Centre: voxelwise Dr map calculated by dividing R2' by QSM values. Right: a subject-specific Dr,pos value was calculated as the mean of voxelwise Dr within the DGM mask.
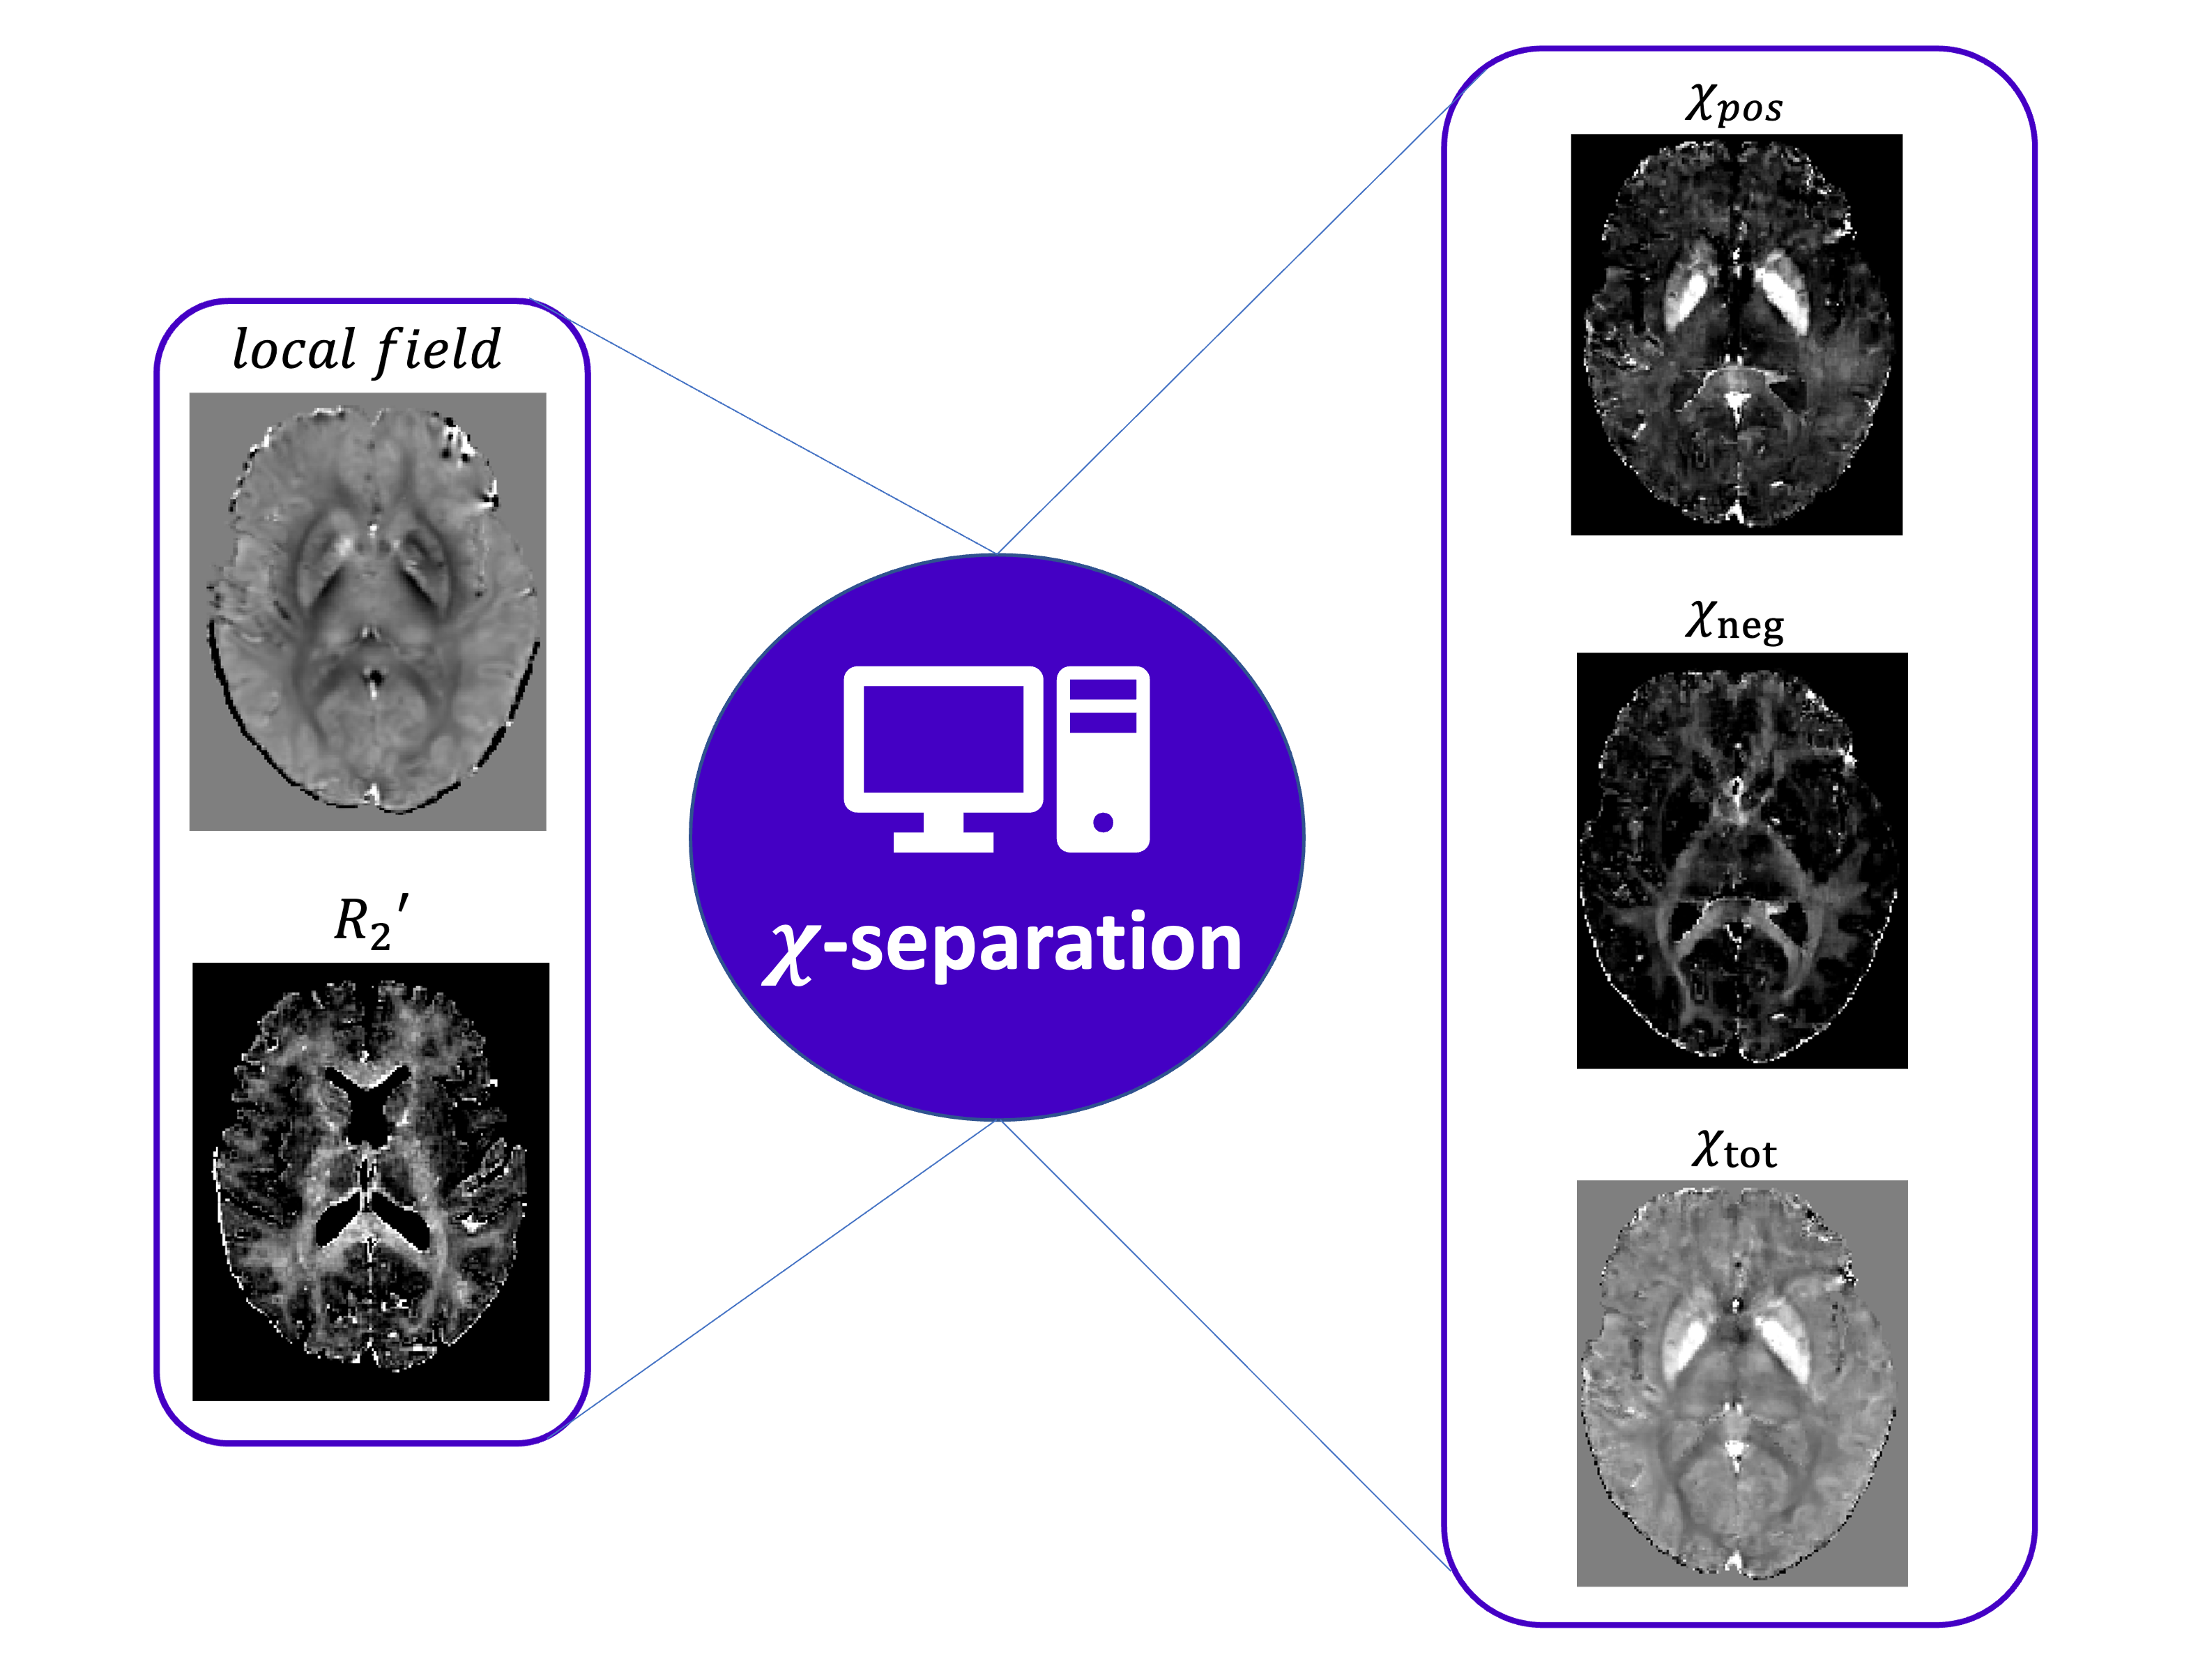
Figure 2 | Susceptibility mapping pipeline. On the left: A local field map and a R2' maps are needed to run the χ-separation Matlab toolbox. On the right: The three outputs of the χ-separation model are a χpos map, a χneg map and a total susceptibility map χtot.
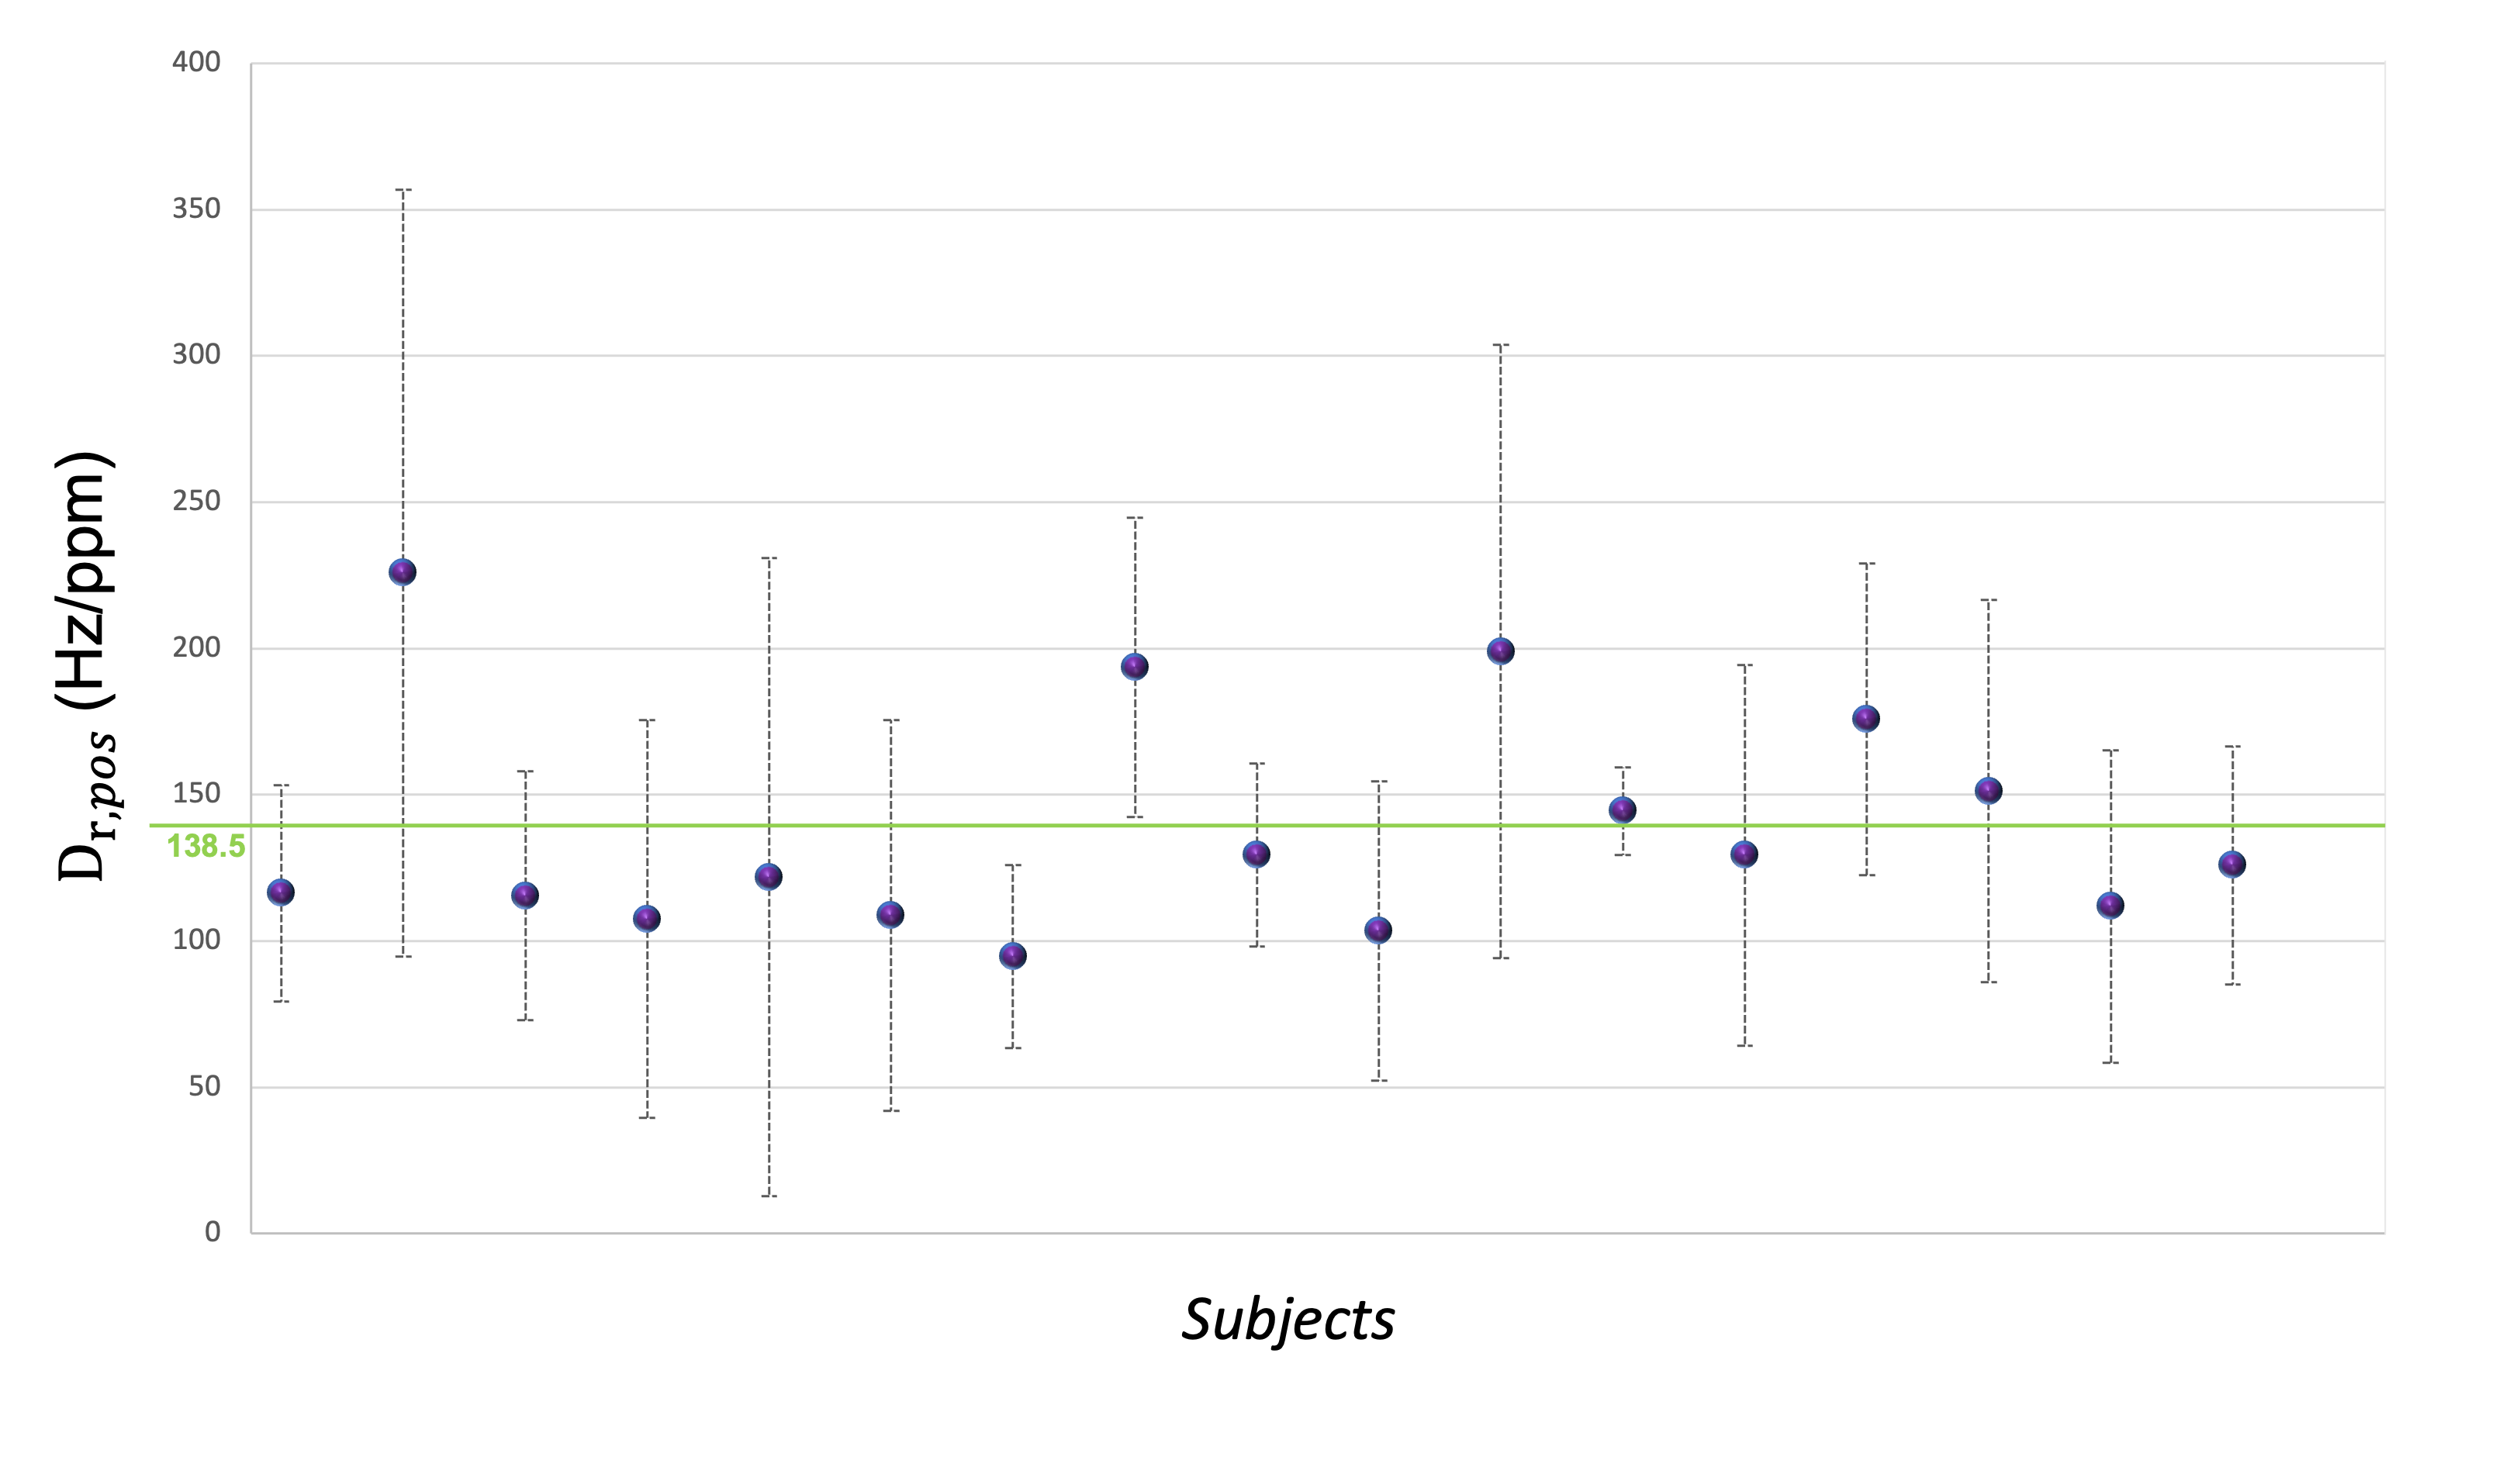
Figure 3 | Distribution of subject-specific positive relaxometric constant (Dr,pos). Mean (purple dots) Dr,pos (calculated in deep grey matter regions) and relative standard deviation values for each subject of the cohort with respect to the mean of the entire cohort (green line at 138.5 Hz/ppm).
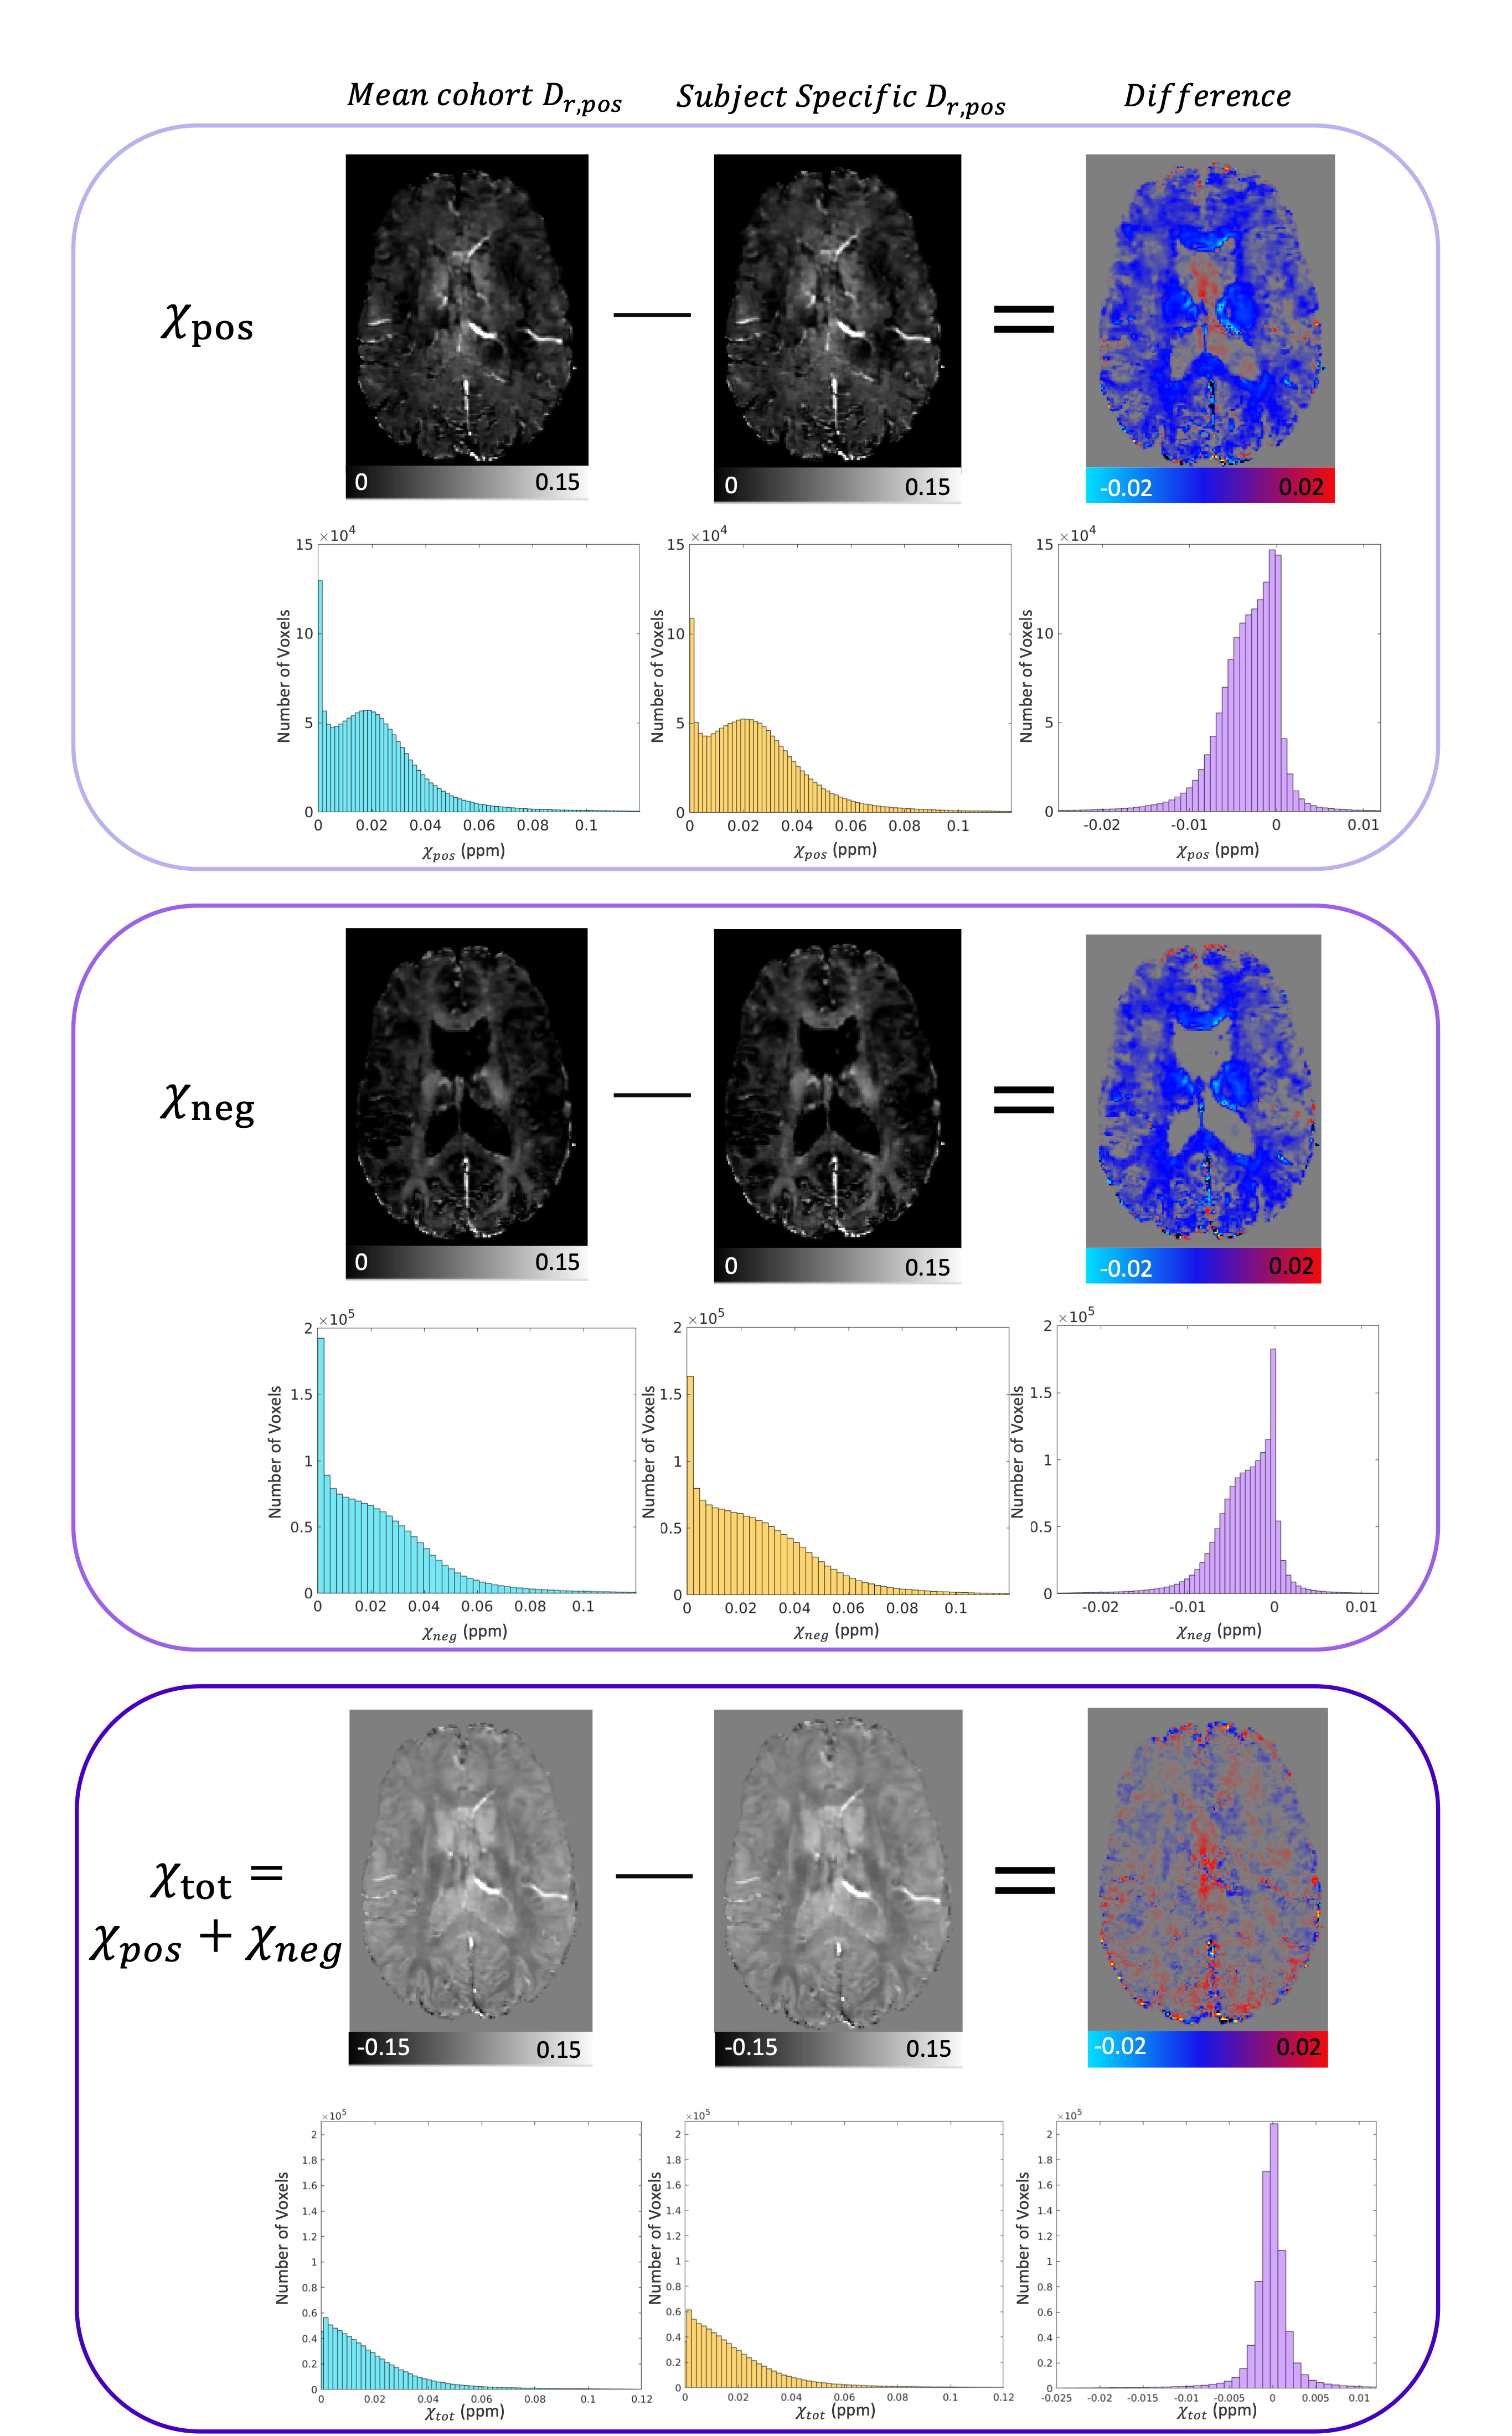
Figure 4 | Differences between the maps obtained with modified χ-separation assumptions.
χ-separation maps and their difference obtained subtracting χpos, χneg and χtot calculated using subject-specific Dr,pos from the one obtained with the mean Dr,pos of the cohort (138.5 Hz/ppm), in a representative subject. On the top row χpos maps are reported with voxelwise histogram for every maps. In the central row χneg maps are shown with voxelwise histogram for every maps. In the bottom row χtot maps are shown with voxelwise histogram for every maps.