4169
Relationship Between Fractional Anisotropy and Negative Susceptibility from Single-orientation Magnetic Susceptibility Separation1Department of Integrated Health Scieneces, Nagoya University Graduate School of Medicine, Nagoya, Japan, 2Russell H. Morgan Department of Radiology and Radiological Science, Johns Hopkins University School of Medicine, Baltimore, MD, United States, 3Department of Rehabilitation Medicine, Nagoya City University Graduate School of Medical Sciences, Nagoya, Japan, 4Department of Radiology, Nagoya City University Hospital, Nagoya, Japan
Synopsis
Keywords: Electromagnetic Tissue Properties, White Matter
The magnetic source separation method can estimate contributions of diamagnetic myelin and paramagnetic iron in the white matter using solely gradient-echo data in white matter. This study determined the relationship between negative susceptibility (χ-) and fractional anisotropy as a myelin-sensitive biomarker and compared with the conventional susceptibility (χ) in young healthy volunteers. There was a significant negative correlation between the χ- and FA. In contrast, the conventional χ has a weaker correlation to the FA than the χ- result. However, the χ- in white matter represented the non-monotonic fiber orientation dependence on the B0 field.Introduction
Magnetic source separation method was recently developed using solely gradient-echo data to estimate the positive (χ+) and negative (χ-) magnetic susceptibility sources as an advanced quantitative susceptibility mapping (QSM) algorithm1, 2. We compared the relationships between fractional anisotropy (FA) evaluated by diffusion tensor imaging (DTI) and χ+, χ-, and conventional χ from single-orientation acquisition, and investigated the fiber orientation dependences in R2* and χ- with respect to the B0 field due to the susceptibility anisotropy effect in the white matter in healthy volunteers.Materials and methods
1. Closed-form solution of magnetic source separationThe R2* signal decay rate represents the summation of R2 and R2’ signal decay rates. The R2* can be approximated by χ+, χ-, and relaxomatric constant α assuming spatial invariant from gradient echo data alone using a first-order approximation expressed by the below equation3.
$$R_2^*(r)=R_2^,(r)+R_{2}(r)\approx\alpha(\chi^{+}(r)-\chi^{-}(r)) $$
The minimization problem can estimate the χ+ and χ- maps using the above approximation of R2* and the relationship between the tissue local field and the two susceptibility maps.
$$argmin_{\chi^{+},\chi^{-}}\parallel R_2^*-\alpha(\chi^{+}-\chi^{-})\parallel_2^2+\parallel f_{local}-D(\chi^{+}+\chi^{-})\parallel _2^2+\lambda\parallel WG\chi^{+}\parallel_1+\lambda\parallel WG\chi^{-}\parallel_1$$
where α is 1.98 × 137 Hz/ppm, f is tissue local field, λ is L1-regularization parameter, G are gradient operators in x, y, and z directions, W is data-weighting mask generated from second deviation of local field, and D is dipole kernel. This minimization problem adopted the alternative direction method of multipliers formalism and introduced additional variables z1,2 and s1,2.
$$argmin_{\chi^{+},\chi^{-},z_1, z_2}\parallel R_2^*-\alpha(\chi^{+}-\chi^{-})\parallel_2^2+\parallel f_{local}-D(\chi^{+}+\chi^{-})\parallel _2^2+\lambda\parallel Wz_1\parallel_1$$
$$+\lambda\parallel Wz_2\parallel_1+\frac{\mu}{2}\parallel G\chi^{+}-z_1+s_1\parallel_2^2+\frac{\mu}{2}\parallel G\chi^{-}-z_2+s_2\parallel_2^2$$
This extended minimization problem was solved by iterative calculation by splitting into the four subproblems for χ+, χ-, z1, and z2 with updating s1 and s2 to minimize L1-norm via L2-minimization and soft-thresholding with an additional parameter μ = 100λ.
2. MR acquisition and imaging processing
We enrolled 17 healthy volunteers (mean age: 28 ± 5,) on a 3.0 T MRI (Ingenia 3T; Philips Medical Systems International). They were acquired multiple spoiled gradient echo (mSPGR), DTI, and magnetization-prepared rapid acquisition with a gradient echo sequence (MPRAGE) for the spatial normalization. The scan parameters for mSPGR with bipolar readout were as follows: field of view, 192 × 192 × 148 mm3; acquisition voxel size, 1 × 1 × 1 mm3; the number of TE values, 17; TE1, 1.9 ms; ΔTE, 1.9 ms; TR, 35 ms; and flip angle, 15. The multiple-phase images that underwent eddy current correction due to bipolar readout4 were performed Laplacian-based phase unwrapping5 and background field removal by a variable-kernel sophisticated harmonic artifact reduction for the phase-data algorithm6 at each TE. Weighted averaging was performed on the local fields of each TE based on the R2* map estimated from the magnitude images7. Then, the χ+, χ-, and conventional susceptibility and R2* maps were reconstructed. To estimate the FA and main fiber orientation with respect to the B0 field, DTI with the 15-diffusion gradient axis was acquired by the following parameter: field of view, 192 × 192 × 148 mm3; acquisition voxel size, 2 × 2 × 2 mm3; TE, 84 ms; and acceleration factor, 2.0. The spatial distortion and eddy current corrections to the DTI were performed by FUGUE using a field map and eddy_correct function8 on FSL.
3. Imaging analysis
The χ+, χ-, conventional χ, R2*, FA, and fiber orientation maps were performed co-registration and spatial normalization without spatial smoothing using MPRAGE on SPM12. To determine the relationships among FA and χ+, χ-, and conventional susceptibility using bivariate correlation analyses, we measured the mean values in the spatially normalized FA and susceptibility maps in all regions mapped in the JHU-WM atlas9. Moreover, to investigate the main fiber orientation dependences of R2* and χ-, the pixel values in all white matter regions were binned for main fiber orientation with 3° intervals.
Results and Discussion
The χ+ and χ- maps were successfully reconstructed by the closed-form solution of magnetic source separation (Figure1). There was a significant negative correlation between the χ- and FA, while the χ+ was not agreed with the FA (Figure2a and b). Moreover, the conventional χ has a weaker correlation to the FA than the χ- result (Figure2c). The diamagnetic myelin and paramagnetic iron can contribute to the whiter matter susceptibility estimated by conventional χ. The χ- map estimated by the susceptibility separation method might be a more myelin-sensitive biomarker than the conventional χ map. The binned R2* values were increased with increasing fiber orientation in the white matter regions mapped in the JHU-WM atlas. This result was consistent with the linear combination model of cos2θ and cos4θ functions10 (Figure 3b). However, the binned χ- values represented the non-monotonic fiber orientation dependence on the B0 field (Figure 3a). This nonlinearity might be caused by the susceptibility anisotropy effect and echo-time dependence on the tissue local field11, which can affect the estimated susceptibility value. Although the χ- was sensitive to the myelin, similar to the FA, the χ- evaluation in the white matter needs to consider the fiber orientation dependence on the B0 field.Conclusion
The χ- map might be a more myelin-sensitive biomarker than the conventional χ map. The χ- estimated from a single-orientation acquisition in white matter represented the non-monotonic fiber orientation dependence on the B0 field.Acknowledgements
No acknowledgement found.References
1. Dimov AV, Gillen KM, Nguyen TD, et al. Magnetic Susceptibility Source Separation Solely from Gradient Echo Data: Histological Validation. Tomography 2022;8(3):1544-51.
2. Chen J, Gong NJ, Chaim KT, et al. Decompose quantitative susceptibility mapping (QSM) to sub-voxel diamagnetic and paramagnetic components based on gradient-echo MRI data. Neuroimage 2021;242:118477.
3. Dimov AV, Nguyen TD, Gillen KM, et al. Susceptibility source separation from gradient echo data using magnitude decay modeling. J Neuroimaging 2022;32(5):852-59.
4. Li J, Chang S, Liu T, et al. Phase-corrected bipolar gradients in multi-echo gradient-echo sequences for quantitative susceptibility mapping. MAGMA 2014;28(4):347-55.
5. Bagher-Ebadian H, Jiang Q, Ewing JR. A modified Fourier-based phase unwrapping algorithm with an application to MRI venography. J Magn Reson Imaging 2008;27(3):649-52.
6. Özbay PS, Deistung A, Feng X, et al. A comprehensive numerical analysis of background phase correction with V-SHARP. NMR Biomed 2017;30(4):e3550.
7. Wu B, Li W, Avram AV, et al. Fast and tissue-optimized mapping of magnetic susceptibility and T2* with multi-echo and multi-shot spirals. Neuroimage 2012;59(1):297-305.
8. Graham MS, Drobnjak I, Zhang H. Realistic simulation of artefacts in diffusion MRI for validating post-processing correction techniques. Neuroimage 2016;125:1079-94.
9. Mori S, Oishi K, Jiang H, et al. Stereotaxic white matter atlas based on diffusion tensor imaging in an ICBM template. Neuroimage 2008;40(2):570-82.
10. Sibgatulin R, Gullmar D, Deistung A, et al. In vivo assessment of anisotropy of apparent magnetic susceptibility in white matter from a single orientation acquisition. Neuroimage 2021;241:118442.
11. Sood S, Urriola J, Reutens D, et al. Echo time-dependent quantitative susceptibility mapping contains information on tissue properties. Magn Reson in Med 2017;77(5):1946-58.
Figures
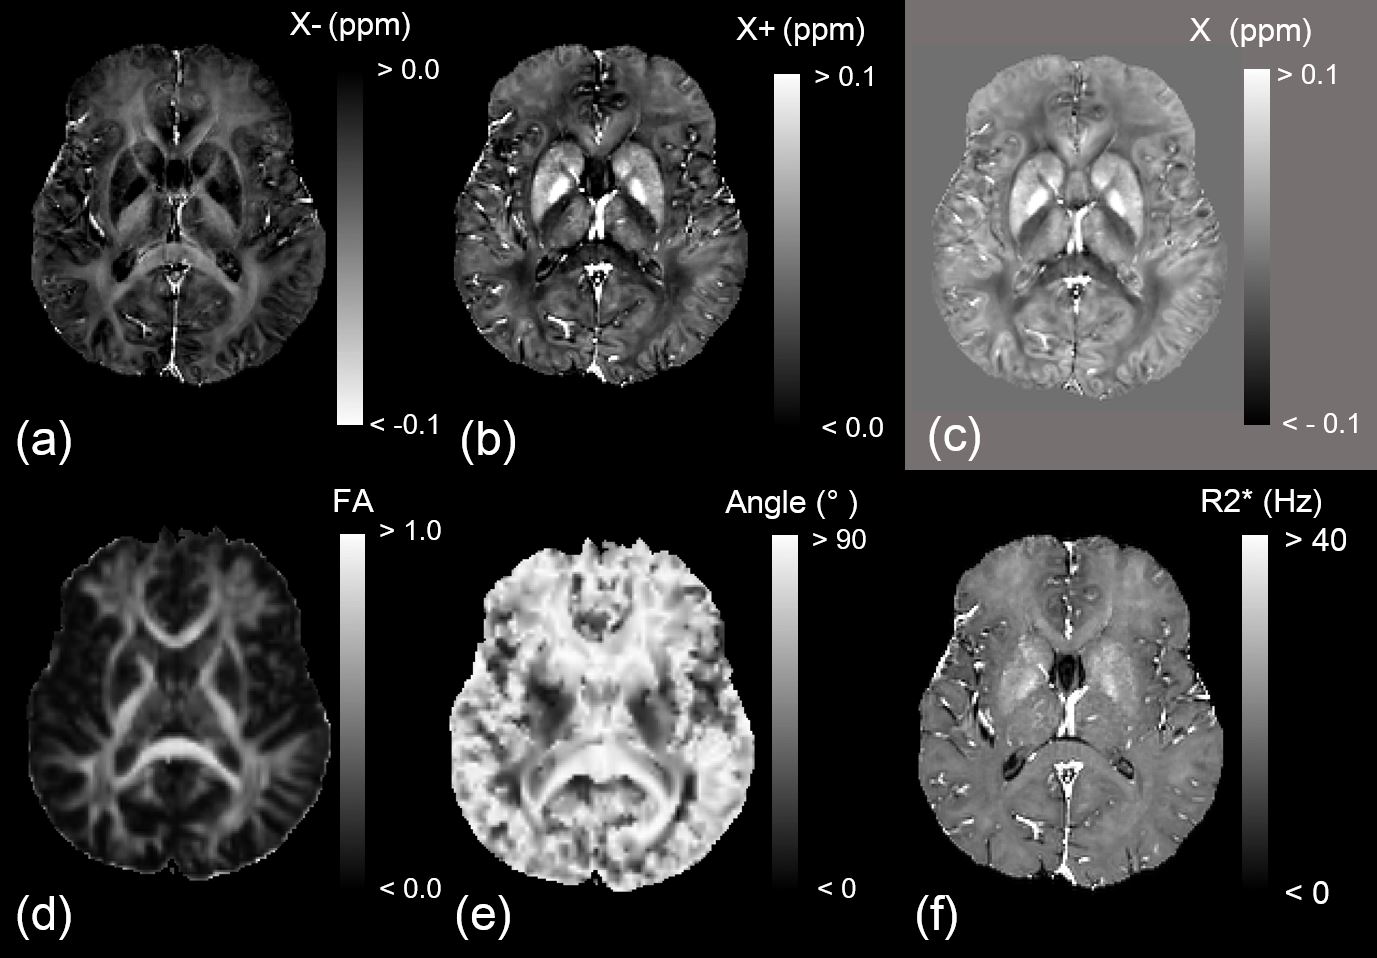
Figure 1
Representative (a) negative susceptibility (χ-), (b) positive susceptibility (χ+), (c) conventional susceptibility (χ), (d) fractional anisotropy (FA), (e) main fiber orientation with respect to B0 field, and (f) R2* images.
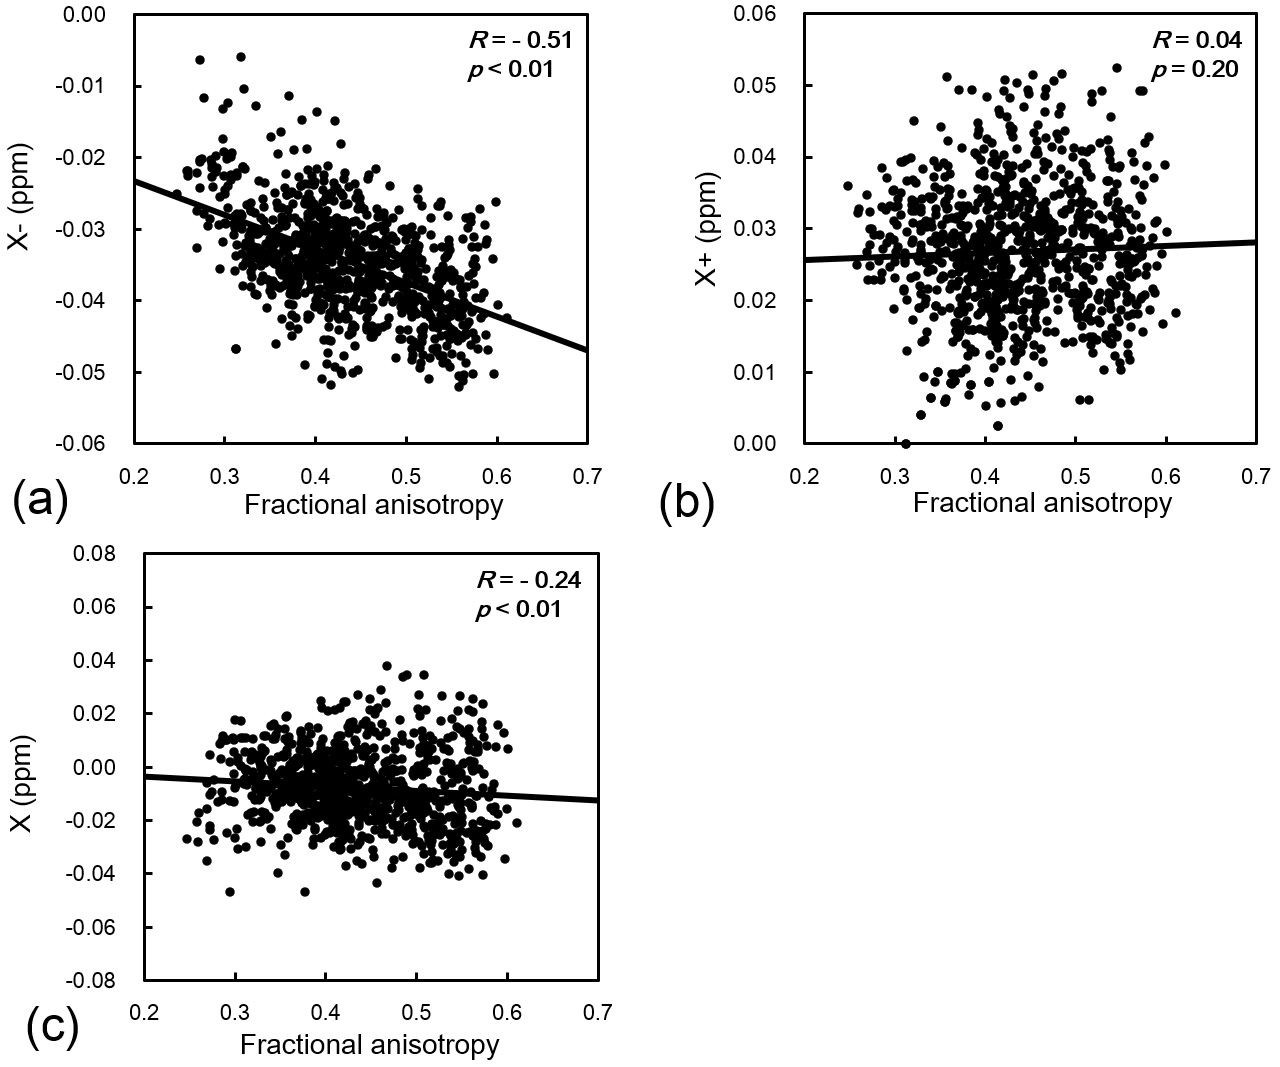
Figure 2
Relationships among fractional anisotropy (FA) and (a) negative susceptibility (χ-), (b) positive susceptibility (χ+), and (c) conventional susceptibility (χ) in the white matter regions mapped in the JHU-WM atlas. There were significant correlations between FA and χ- or χ (R = -0.51, p<0.01 and R = -0.24, p<0.01, respectively). In contrast, the positive susceptibility (χ+) did not agree with FA (R = 0.04, p = 0.20).
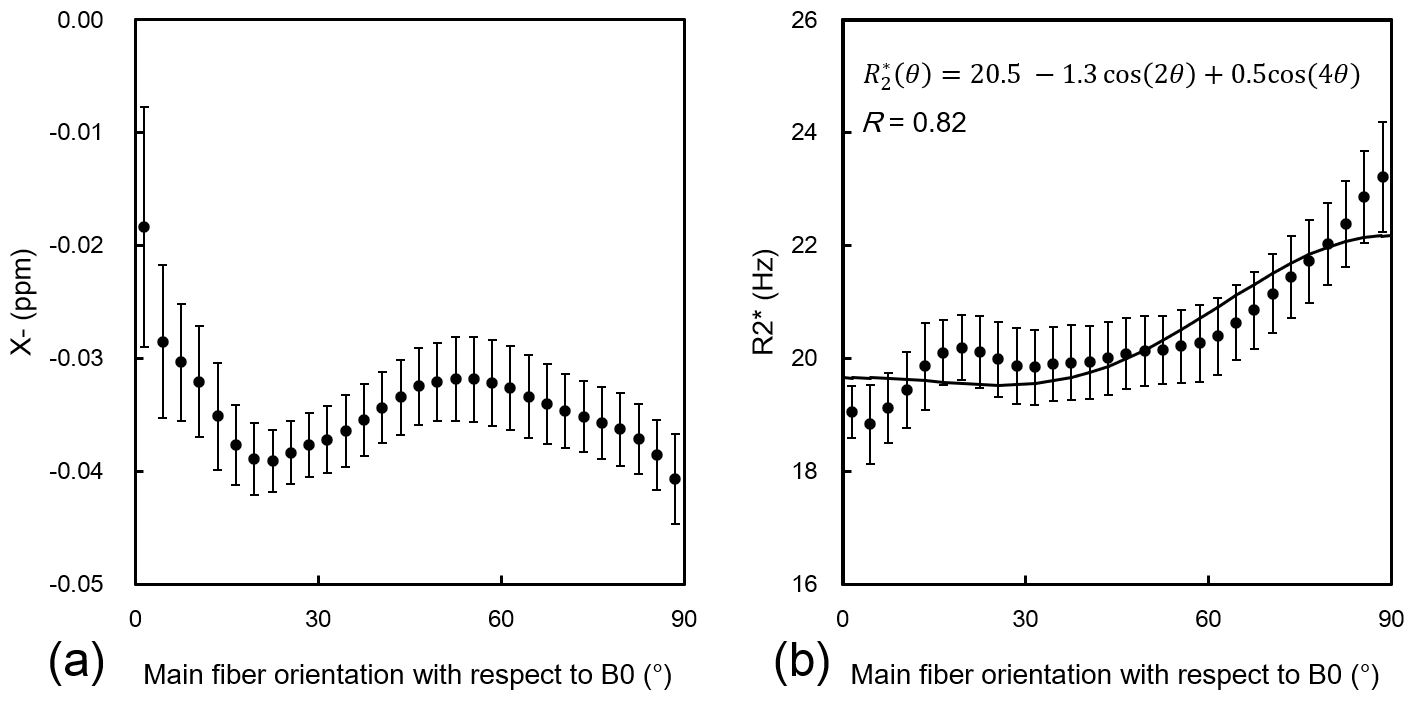
Figure 3
Relationships between main fiber orientation with respect to B0 field and (a) negative susceptibility (χ-) or (b) R2* values binned for main fiber orientation with 3° intervals in the all-white matter regions mapped in the JHU-WM atlas. The χ- values binned with 3° intervals showed non-monotonic orientation dependence on the B0 field. The R2* values binned with 3° intervals represented the empirical model of cos2θ and cos4θ functions reported in the previous study (R = 0.82).