4166
Validation of Intravoxel Incoherent Motion (IVIM) Methods in the Liver using the NIST Diffusion Phantom1Radiological Sciences, University of Texas Health Science Center San Antonio, San Antonio, TX, United States, 2School of Medicine, Indiana University, Indianapolis, IN, United States, 3South Texas Diabetes and Obesity Institute, School of Medicine, University of Texas Rio Grande Valley, Brownsville, TX, United States
Synopsis
Keywords: Phantoms, Diffusion/other diffusion imaging techniques, intravoxel incoherent motion, liver, fibrosis
Intravoxel incoherent motion (IVIM) MRI is used to measure quantitative biomarkers of liver fibrosis, but accuracy and reproducibility of various methods requires validation. Six IVIM methods with different acquisition parameters (motion control techniques, b-values, single shot EPI v. SMS) were assessed using the NIST diffusion phantom. The phantom measurements met conformance standards for percent apparent diffusion coefficient (ADC) bias and ADC linearity using a protocol modified for liver MRI. Given that no standard IVIM liver phantom has been developed, the NIST diffusion phantom is shown to work well for validation of liver IVIM acquisitions.
Introduction
Early diagnosis of hepatic fibrosis is important for preventing progression of the disease through interventions and treatment. The current clinical standard for diagnosis is biopsy, an invasive method with implicit sampling error and risk of patient injury1. Demand exists for non-invasive, accurate, and reproducible biomarkers for quantitative assessment and grading of liver fibrosis. Intravoxel Incoherent Motion (IVIM) is an MRI technique which allows measurements of diffusion and perfusion in tissues2. IVIM can be performed at clinics with high-field MRI with minimal additional cost. However, there is no clear consensus on a standardized IVIM protocol for clinical implementation. The National Institute of Standards and Technology (NIST) have developed an isotropic diffusion phantom for validation of quantitative imaging protocols for MRI (Figure 1). We evaluated the use of the NIST diffusion phantom to assess six IVIM methods for development of quantitative biomarkers of liver stiffness.Methods
The NIST diffusion phantom was filled with ice water and refrigerated overnight to maintain a phantom temperature of 0 +/- 0.2 °C during the duration of the entire scan. Scans were performed on a 3T MRI system (TIM Trio, Siemens Healthcare GmbH, Erlangen, FRG) using an 8-channel surface coil with the phantom in the axial, coronal, and sagittal positions. Six different IVIM methods were assessed for accuracy and variability. Simultaneous multi-slice (SMS) sequences were compared to single shot echo planar imaging (EPI) sequences. Different sets of b-values and motion control techniques were also compared. Details for each acquisition are shown in Table 1. Total scan time was 87 minutes. Phantom temperature before the scan was 0.06 °C and 0.17 °C after. The NIST phantom contains 13 vials of polyvinylpyrolidone (PVP) solution at various concentrations (0-50%) with varying ADC values3. The ADC of each of the vials for each IVIM method was calculated and results compared to the NIST reported ‘true’ ADCs at 0 °C. All images were analyzed using the Mango Multi-image Analysis GUI (http://mangoviewer.com/). Regions-of-interest (ROIs) of 28.65 cm2 were placed in the center of each vial to measure the mean signal intensity. Data were fit to the mono-exponential equation of diffusion (eq.1) using non-linear least squares in R (https://www.r-project.org/).$$S_b = S_0 exp(-b * ADC) \tag{1}$$
Results
Computed ADCs for each of the six IVIM methods in all positions are shown in Figure 2. Data from the phantom scans were compared to the true ADCs using the metrics outlined in the Quantitative Imaging Biomarkers Alliance (QIBA) Profile Conformance Testing Manual4. The percent ADC bias (eq. 2) was calculated to determine the accuracy of the measured ADC for each method. To meet conformance, the ADC bias of the central vial should be less than 4%. Each of the methods were <2% as shown in Table 2.$$\% ADC\;bias = 100\% \frac{(\mu - ADC_{true})}{ADC_{true}} \tag{2}$$
To determine the reproducibility, the within-exam coefficient of variation (wCV) was calculated using eq. 3, where σw is the within-exam standard deviation across each phantom position.
$$wCV = 100\% \frac{\sigma_w}{\mu} \tag{3}$$
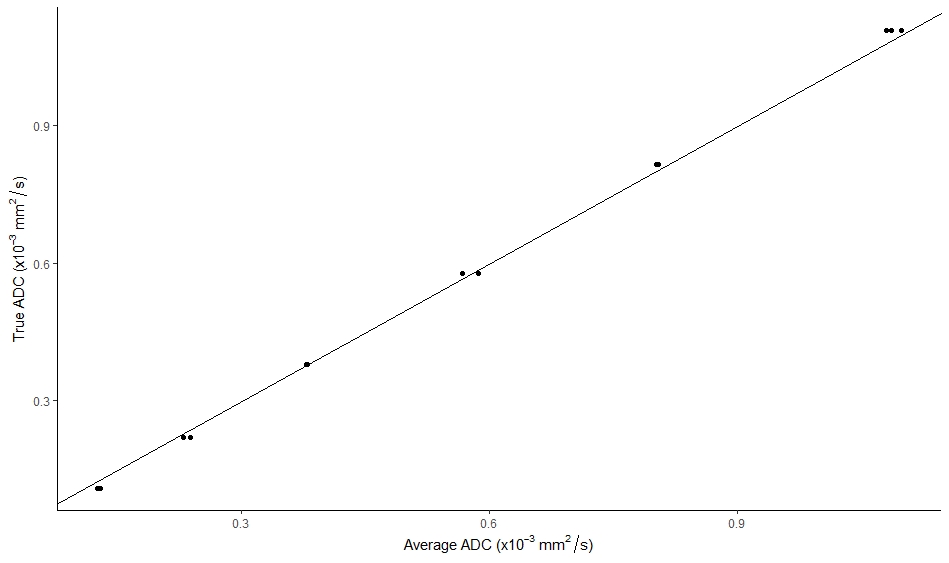
The SNR was calculated for the b0 image using the mean value over the standard deviation of each ROI. The linearity with respect to the true ADC values was tested using linear regression. To meet conformance standards, the R2 of the model should be >0.9 and the 95% confidence interval for the slope should be between 0.95 and 1.05. Results are shown in Figure 3.
Discussion/Conclusion
The NIST phantom was not scanned using the recommended setup and protocol given in the QIBA manual, which uses a head coil for DWI in the brain, as the purpose was to test the accuracy and repeatability of IVIM methods for liver DWI. Therefore, some of the performance metrics and analysis performed differ. The percent ADC bias of the central vial was between 0.1-1.8% for all methods, which are below the conformance standard limit. The wCV should be <0.5% to meet conformance standards. Only the SMS-BH method was below this limit. However, the wCV stated in the manual is measuring the variation between multiple passes of the same scan, whereas the wCV calculated is measuring the variation between different phantom orientations, and therefore the conformance standard should be adjusted. Measured SNR of the center vial was also below the recommended standard of 45 for each of the protocols. This could be because the imaging was performed using an abdominal matrix coil and not a head coil for which the phantom was designed. Also, the IVIM sequence parameters used differ from those in the QIBA manual. There are some limitations to using the NIST diffusion phantom for this application. The ADC of the PVP solution is calculated using a mono-exponential model. However, it has been shown that diffusion in the liver is best modeled using a bi- or tri-exponential fit5. The NIST phantom protocol was also designed for DWI of the brain, and therefore better anatomically resembles a head rather than an abdomen. The phantom still was able to meet many conformance standards and demonstrate reproducibility between the IVIM methods. As no standard abdomen IVIM phantom has yet been developed, the NIST diffusion phantom was found to be acceptable for useful and interpretable validations of various liver IVIM methods.Acknowledgements
No acknowledgement found.References
1. Chow, A. M., Gao, D. S., Fan, S. J., Qiao, Z., Lee, F. Y., Yang, J., Man, K., & Wu, E. X. (2012). Liver fibrosis: An intravoxel incoherent motion (IVIM) study. Journal of Magnetic Resonance Imaging, 36(1), 159–167. https://doi.org/10.1002/jmri.23607
2. Le Bihan, D., Lima, M., Federau, C., & Sigmund, E. E. (2019). Liver Fibrosis. In Intravoxel incoherent motion (IVIM) MRI: Principles and applications. essay, Pan Stanford Publishing.
3. Quantitative MRI. NIST. (2022, April 7). Retrieved November 6, 2022, from https://www.nist.gov/programs-projects/quantitative-mri
4. QIBA Profile Conformance Testing DWI MR Supplement 1. (n.d.). Quantitative Imaging Biomarkers Alliance, Version 20210401.
5. Troelstra, M. A., van Dijk, A.-M., Witjes, J. J., Mak, A. L., Zwirs, D., Runge, J. H., Verheij, J., Beuers, U. H., Nieuwdorp, M., Holleboom, A. G., Nederveen, A. J., & Gurney-Champion, O. J. (2022). Self-supervised neural network improves tri-exponential intravoxel incoherent motion model fitting in non-alcoholic fatty liver disease. https://doi.org/10.1101/2022.04.04.22273378
6.Stephen E. Russek (2021), NIST/NIBIB Medical Imaging Phantom Lending Library, National Institute of Standards and Technology, https://doi.org/10.18434/mds2-2366 (Accessed 2022-11-05)
Figures
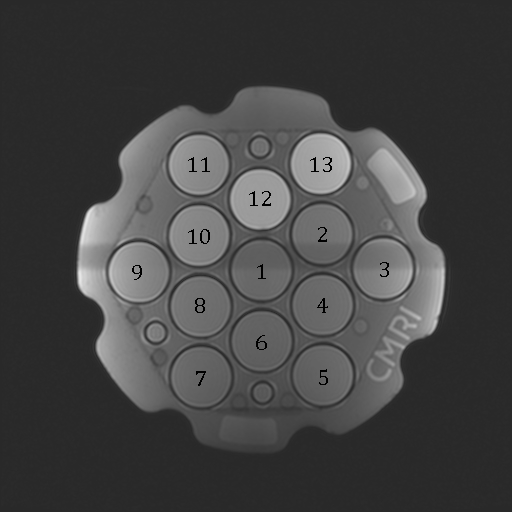
Figure 1. T1-weighted MR image of NIST phantom showing the 13 tubes, each of which has a specified, calibrated diffusion coefficient6
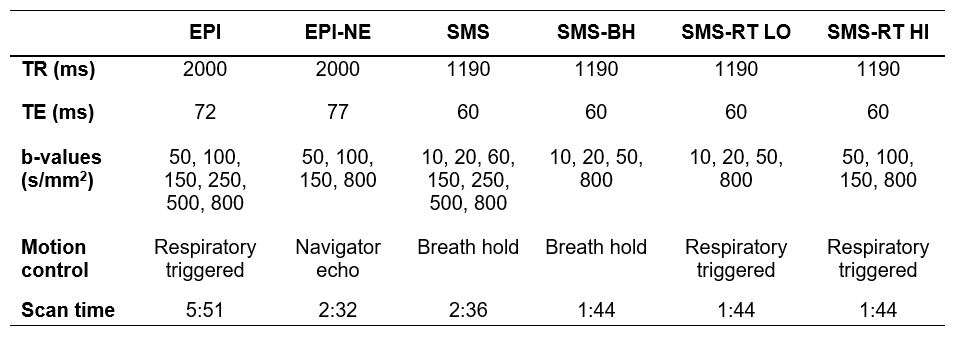
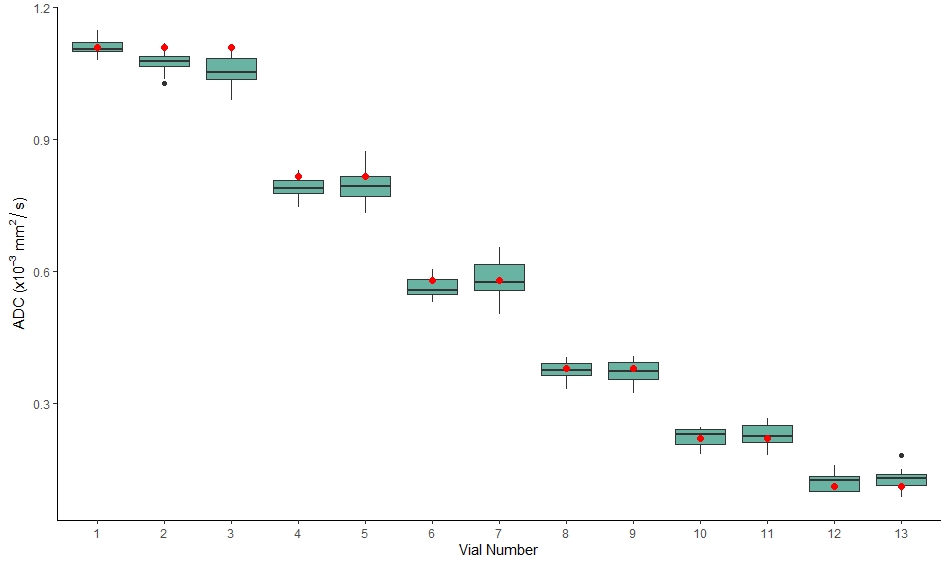
Figure 2: Measured ADCs for each method (EPI, EPI-NE, SMS, SMS-BH, SMS-RT LO, SMS-RT HI) in the three phantom positions (axial, coronal, sagittal). The red markers indicate the true ADC values.
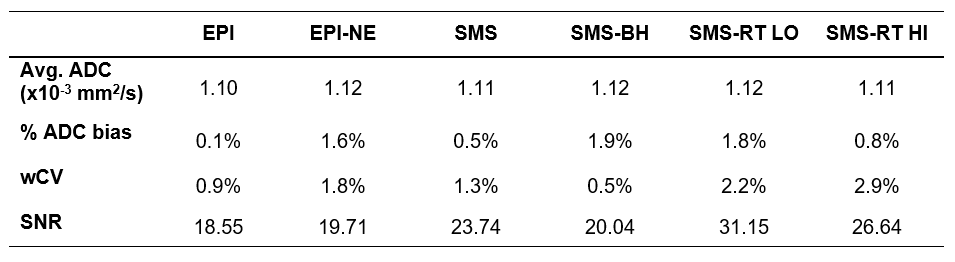
Table 2: Results for the ADC of the central vial averaged across all three phantom positions. The percent ADC bias, within-exam coefficient of variation (wCV), and signal-to-noise ratio (SNR) are also shown.