4162
Comparison of Intra-Hippocampal Fiber Tracks and Connectomes between Alzheimer’s Patients and Age-Matched Healthy Controls1Duke-UNC Brain Imaging & Analysis Center, Duke University, Durham, NC, United States, 2Duke Medical Physics Graduate Program, Duke University, Durham, NC, United States, 3Athinoula A. Martinos Center for Biomedical Imaging, Massachusetts General Hospital, Harvard Medical School, Boston, MA, United States, 4Department of Radiology, Duke University, Durham, NC, United States, 5Department of Psychiatry and Behavioral Sciences, Duke University, Durham, NC, United States
Synopsis
Keywords: Tractography & Fibre Modelling, Alzheimer's Disease, DTI, Hippocampus, Hippocampal Subfield, Connectome
Changes in intra-hippocampal connectivity caused by early neurodegeneration in specific hippocampal subfields could serve as a biomarker for the early diagnosis of Alzheimer’s disease (AD), years before the onset of symptoms, when the neurodegeneration may still be reversed by treatments. Here, we use high-resolution DTI to compare intra-hippocampal fiber tracks and connectomes across different hippocampal subfields in AD patients and age-matched healthy controls. A significant (p < 0.01) decrease in number of streamlines was found in the AD group compared to the control group for four pairs of subfields, independently of a reduced hippocampal volume affecting nearly all subfields.Introduction
Alzheimer’s disease (AD) is a neurodegenerative disorder leading to dementia that impacts ~6.5 million individuals in the United States1 and many more worldwide. Neurodegeneration is not uniformly distributed across different brain regions2 and can occur decades before symptom onset and clinical diagnosis3, by which time it is too late to reverse4. Current biomarkers of AD (e.g., beta-amyloid and tau protein levels or brain atrophy measures derived from structural MRI) lack the specificity to detect early microstructural changes in specific brain regions. It is therefore critical to develop biomarkers that can noninvasively probe the microstructure of selectively vulnerable neuronal populations to enable the early diagnosis of AD, years before the onset of symptoms, when the neurodegeneration may still be reversed by treatments.The hippocampus is affected by early neurodegeneration in AD5 and changes in intra-hippocampal connectivity could potentially provide such a biomarker. Diffusion MRI has been used to investigate the whole-brain connectome in AD and associated conditions6–9 and the intra-hippocampal connectivity in ex vivo brain samples10,11. However, it has been challenging to achieve a sufficiently high spatial resolution within a clinically feasible scan time to investigate the intra-hippocampal connectivity in vivo. A recent study used high-resolution diffusion tensor imaging (DTI) to generate intra-hippocampal fiber tracks and connectomes across different hippocampal subfields of young healthy subjects12. Here, we apply this methodology to compare intra-hippocampal fiber tracks and connectomes in AD patients and age-matched healthy controls, with the long-term goal of developing a biomarker for the early diagnosis of AD in pre-symptomatic high-risk individuals.
Methods
Six healthy controls (4 females, 2 males, 67±7.4 years old) and six AD patients (4 females, 2 males, 70±7.7 years old) were scanned on a 3T GE Premier UHP scanner (100 mT/m gradients). Whole-brain DTI data were acquired with a 2-band, 4-shot EPI sequence (axial, TR/TE 7346/61 ms, 1 mm isotropic, 2 b0 + 25 b 800 s/mm2, 14 min), reconstructed with multi-band multiplexed sensitivity encoding (MB-MUSE)13,14, preprocessed with skull stripping, denoising, Gibbs artifact removal, susceptibility- and eddy current-induced distortion correction, and bias field correction in FSL15 and MRtrix316, and linearly interpolated to a 0.33-mm isotropic resolution.Whole-brain T1-weighted anatomical images (MPRAGE, 1 mm isotropic) were also acquired, registered to the DTI data, and used to generate a hippocampal mask and hippocampal subfields with Freesurfer 7.017. The following pairs of subfields were then manually combined: presubiculum+subiculum, CA4+dentate gyrus (DG), and molecular layer+hippocampal fissure, resulting in 12 subfields per hemisphere (Figure 1).
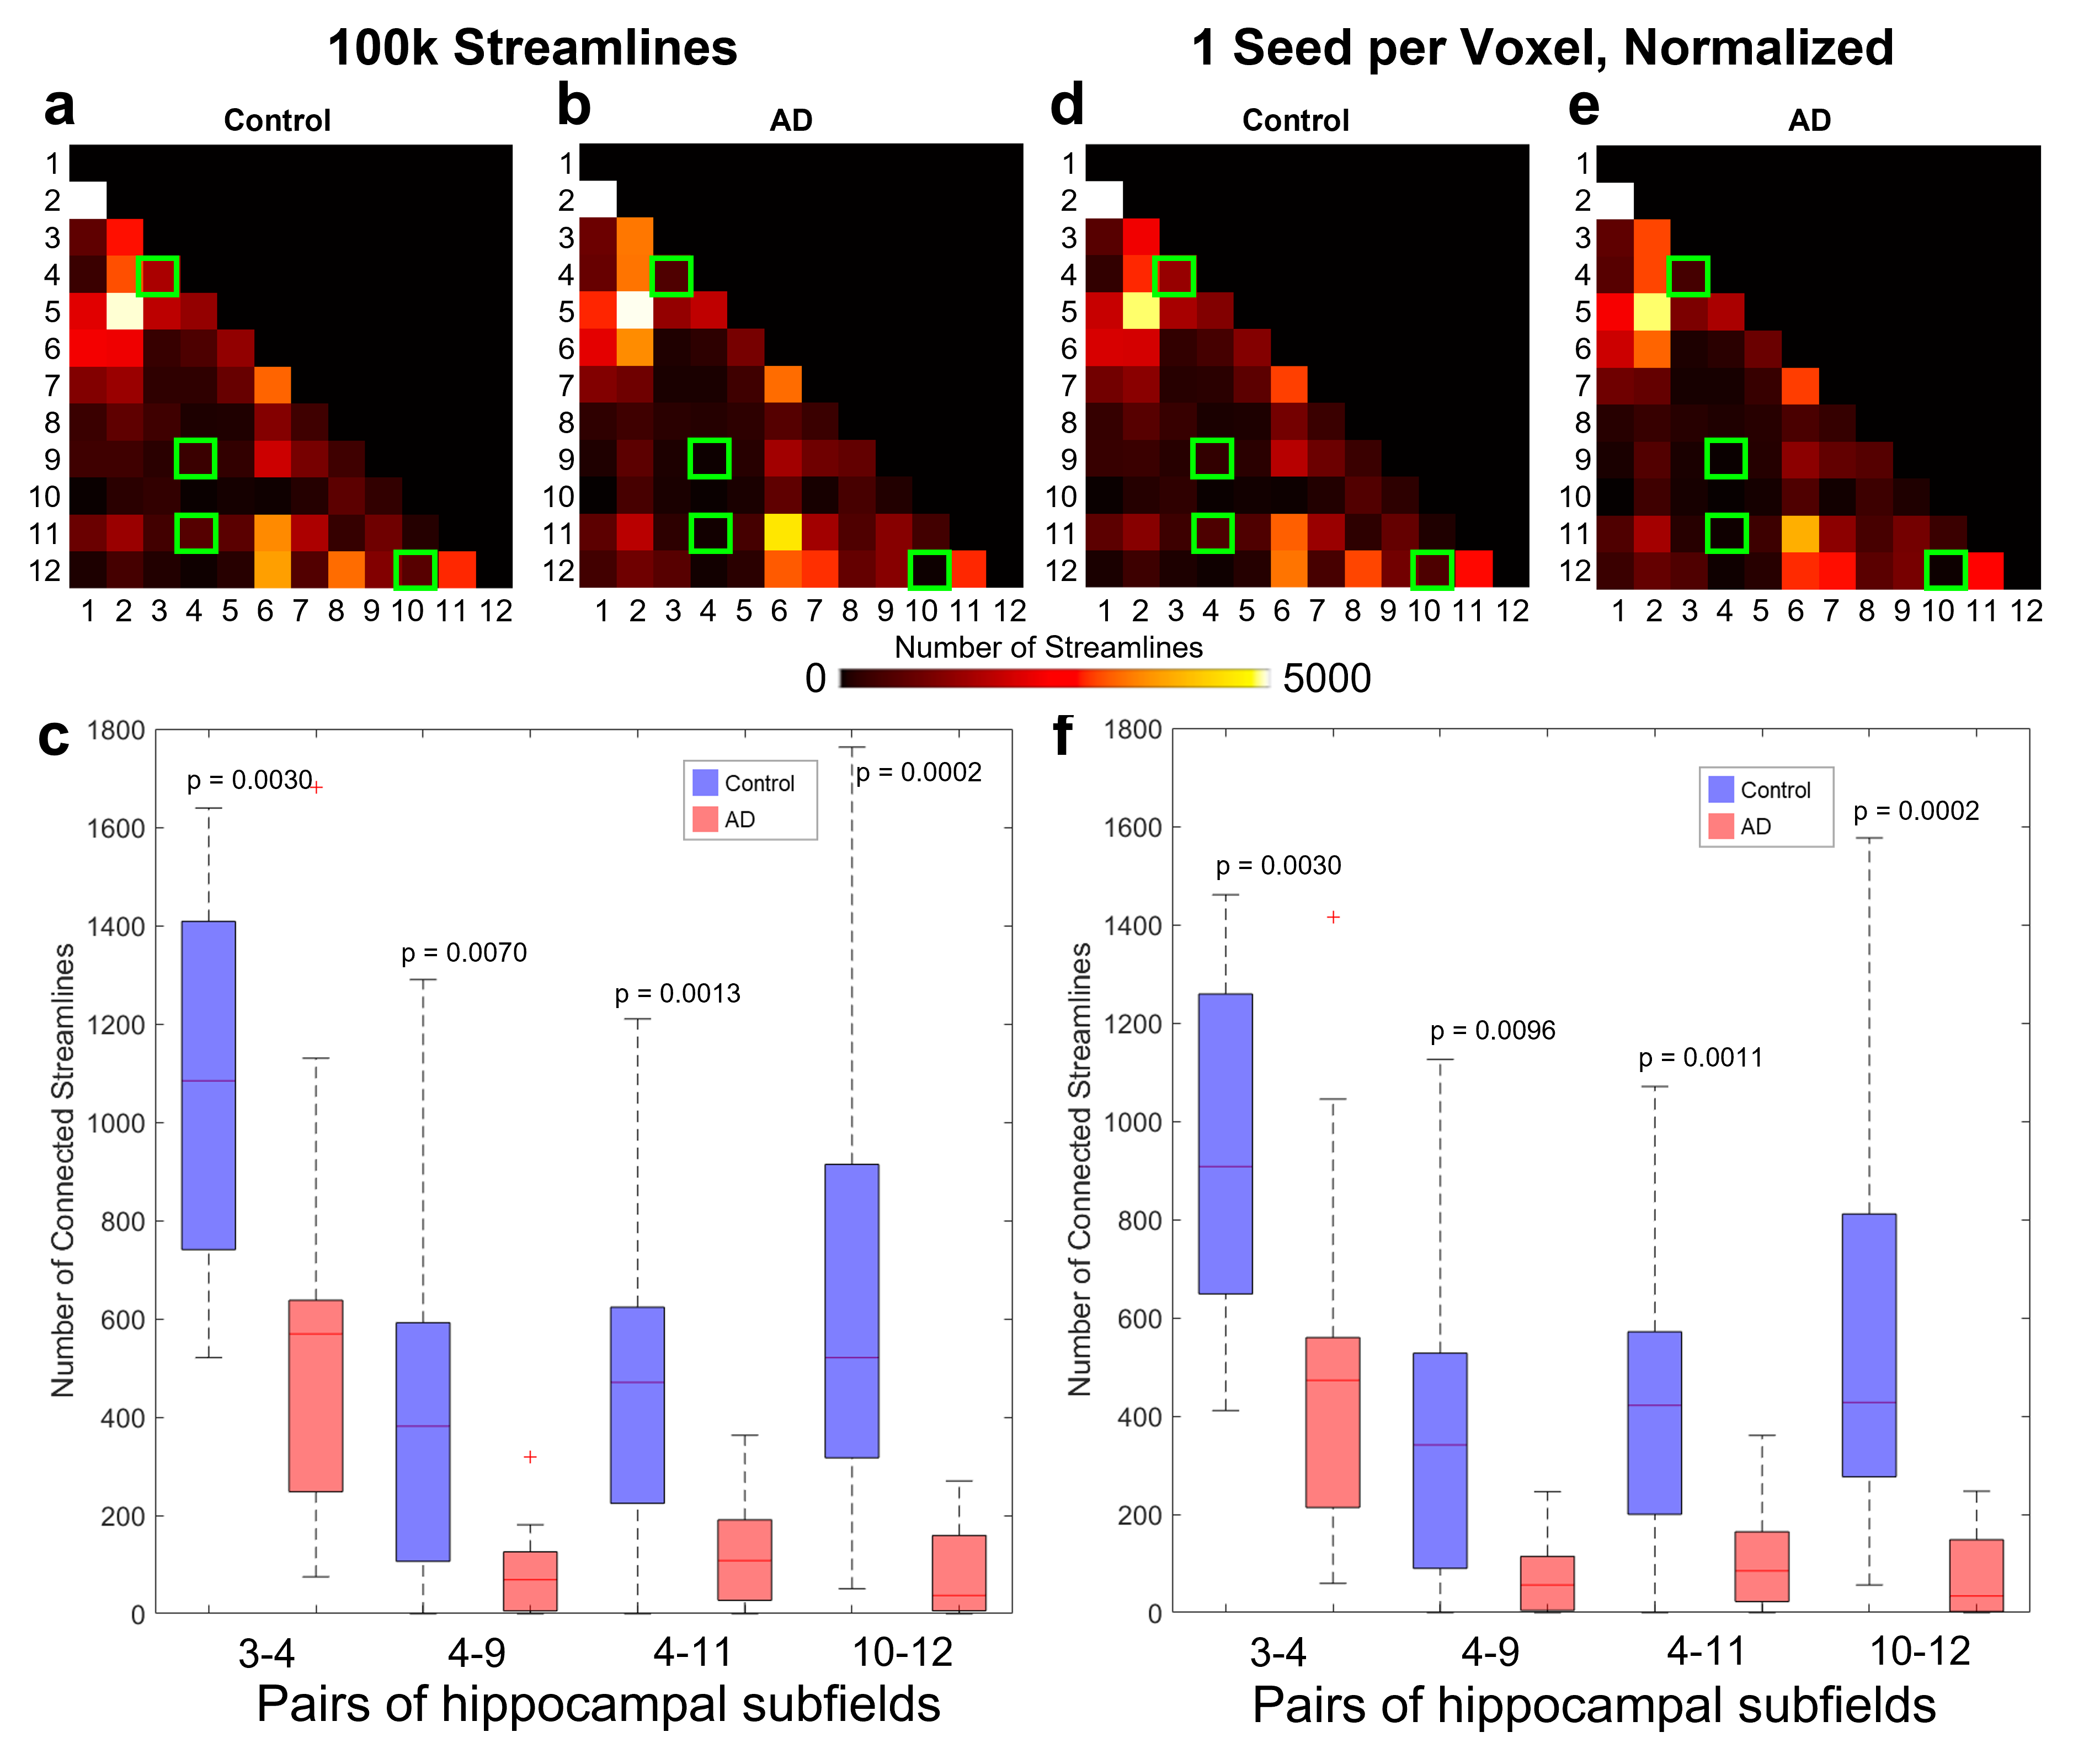
Intra-hippocampal fiber tracking (tensor deterministic with either 100k streamlines or 1 random seed per voxel, maximum angle 60o, minimum/maximum length 1.67/100 mm, FA cutoff 0.05) was performed in each hippocampal mask with MRtrix3. When using 1 seed per voxel, the number of streamlines was normalized by the volume of each hippocampus and scaled by the average volume of all hippocampi. The number of streamlines connecting each pair of subfields was then used to generate a connectome for each hemisphere. Wilcoxon rank sum tests were used to compare the subfield volumes and the numbers of streamlines connecting each pair of subfields in the control vs. AD groups.
Results
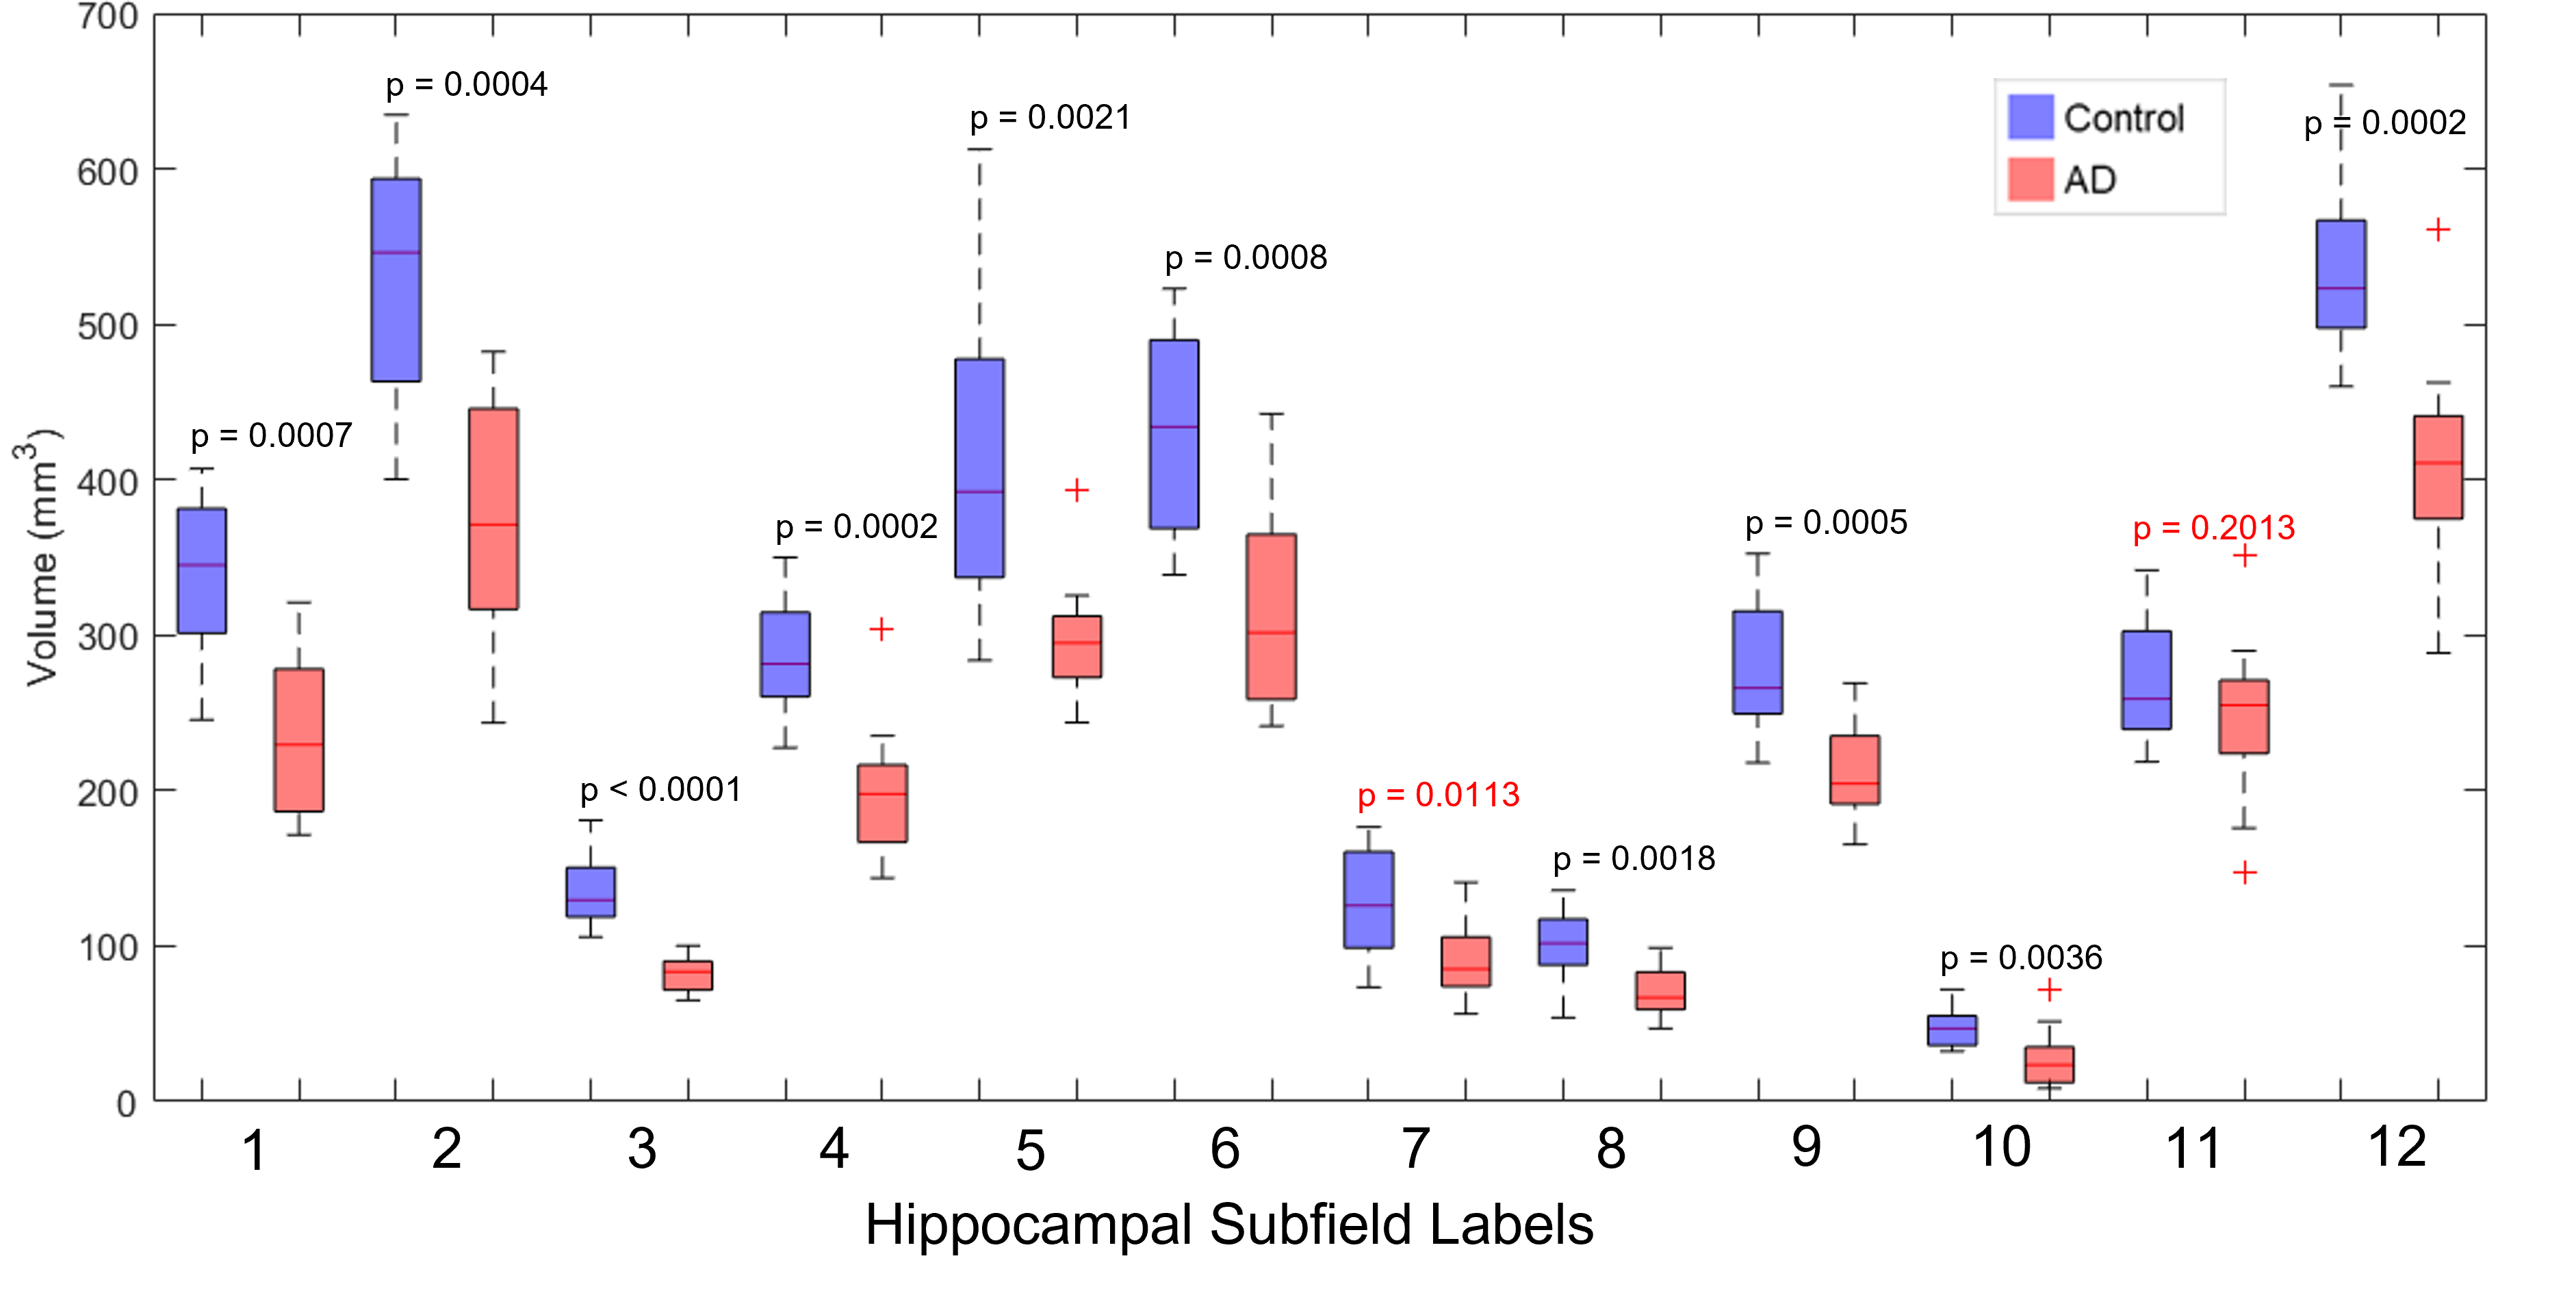
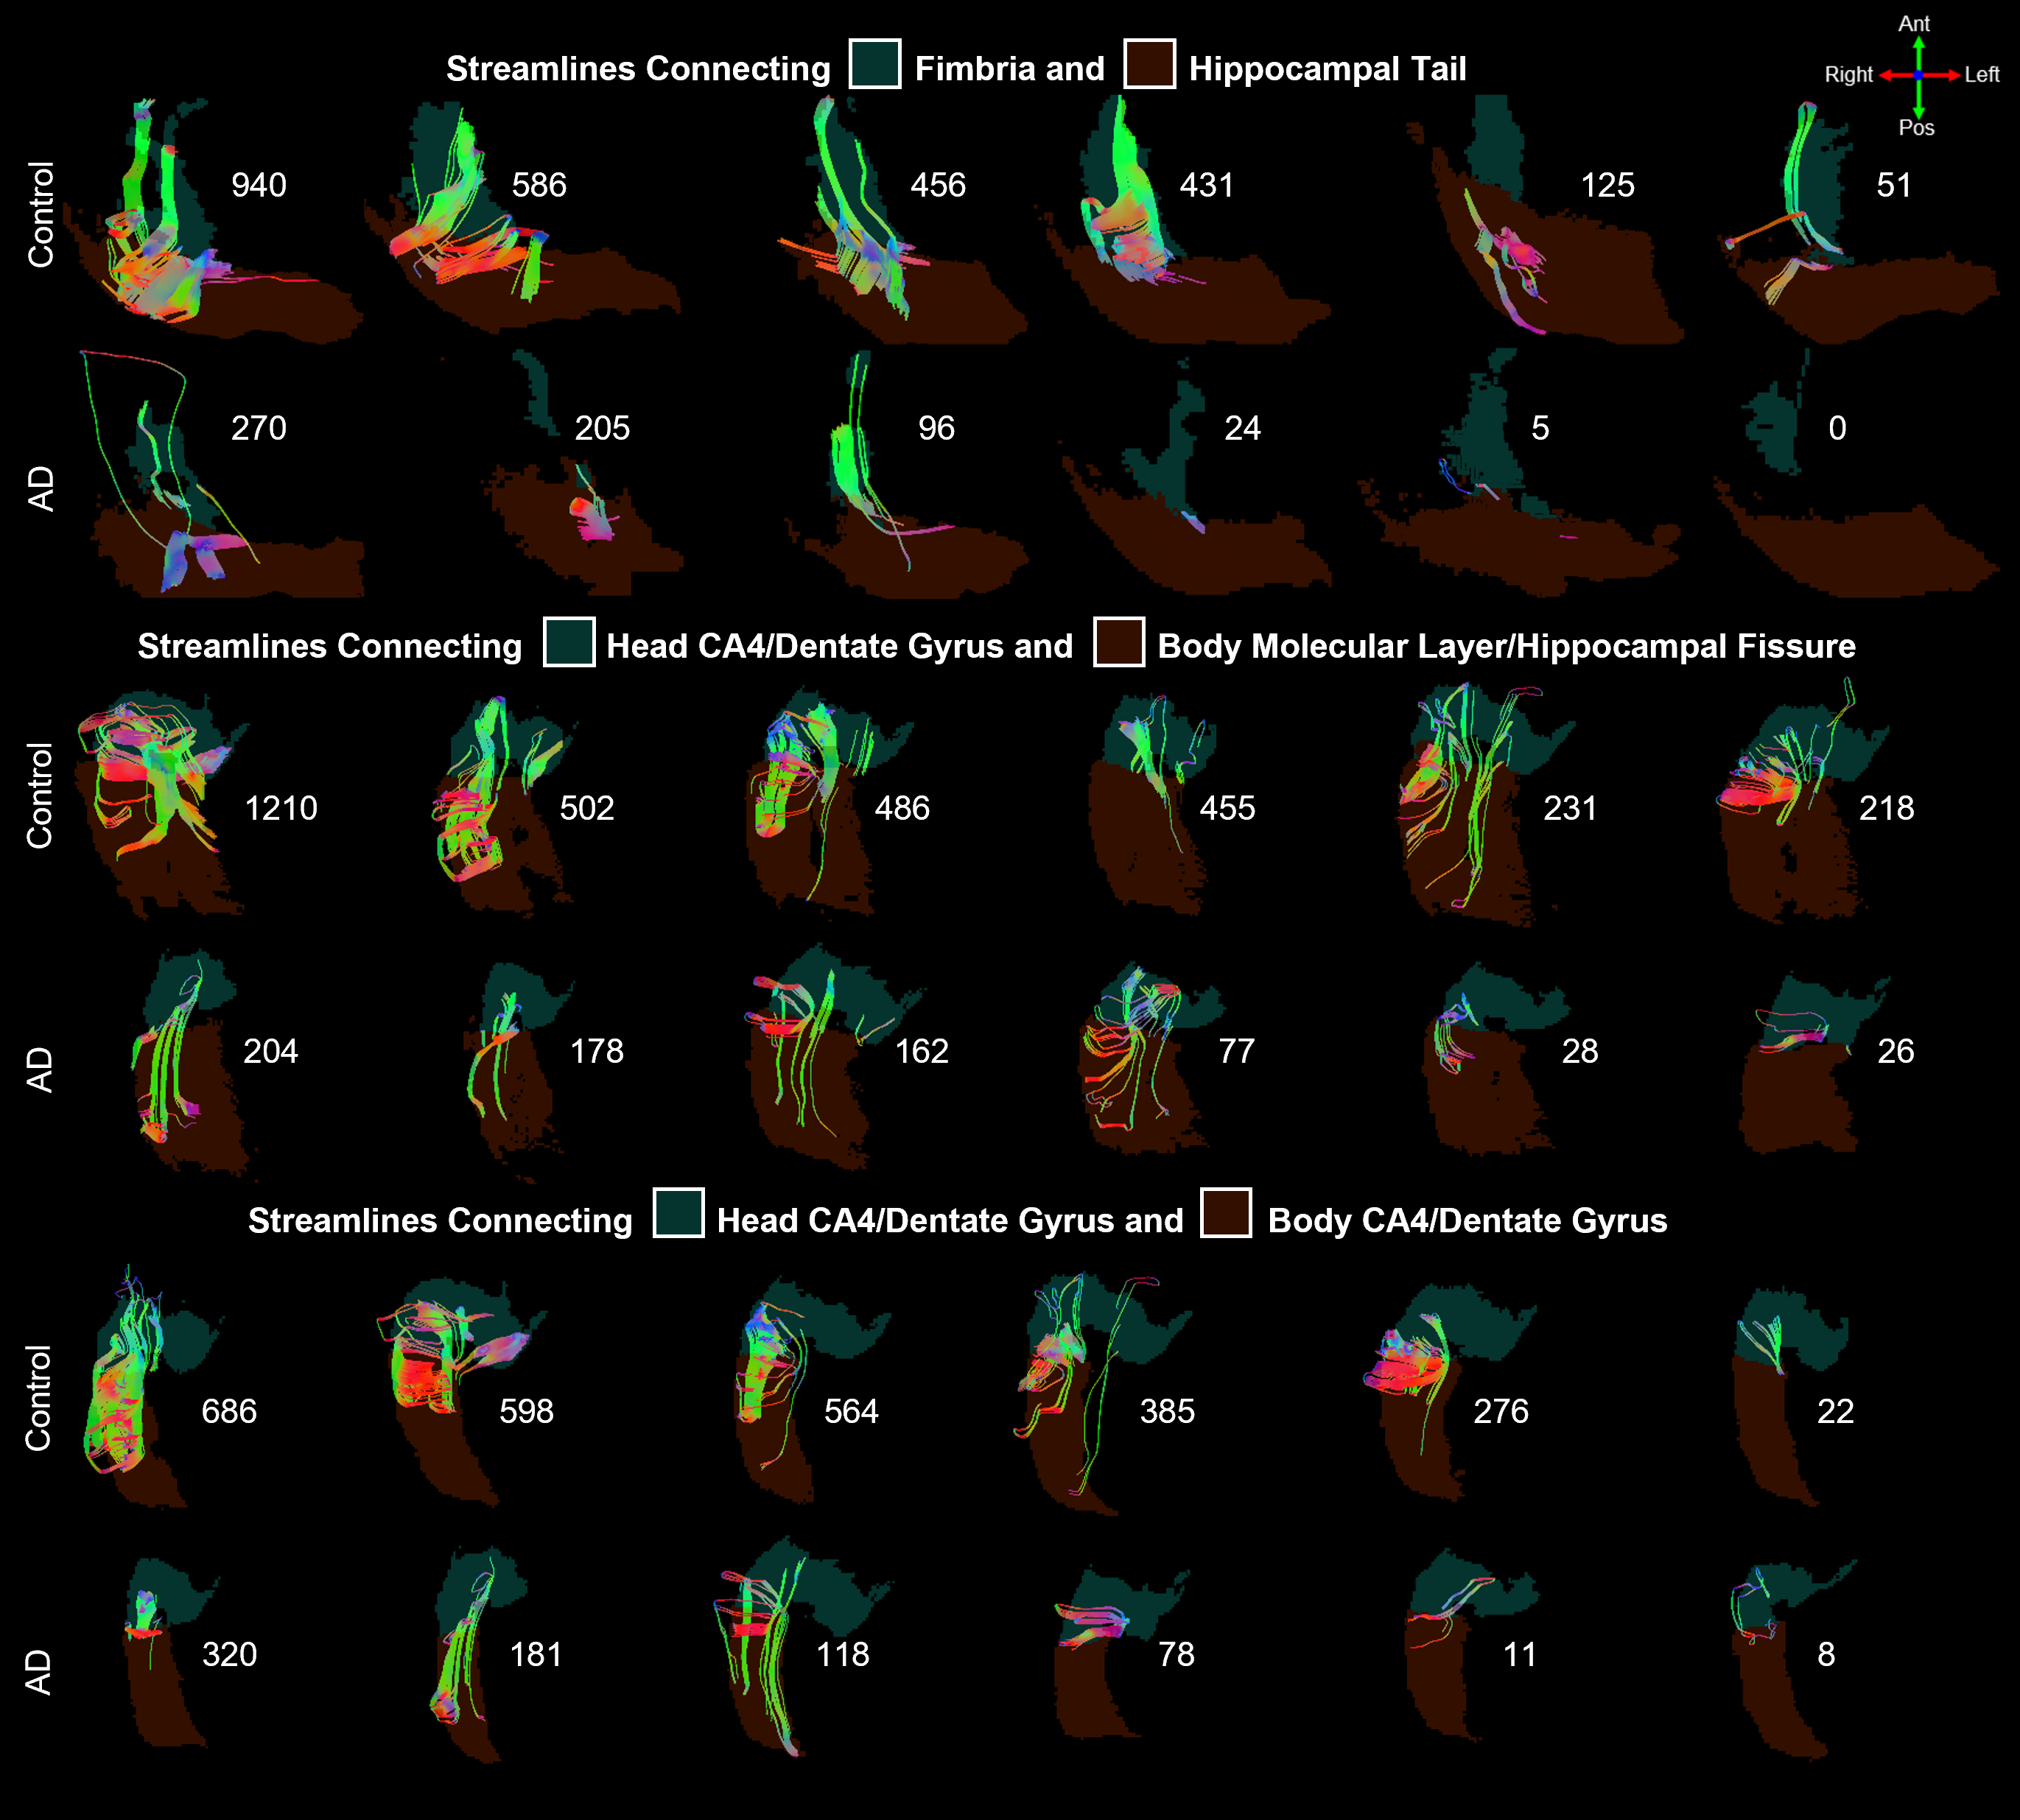
Nearly all hippocampal subfields had a significantly (p < 0.01) smaller volume in the AD group compared to the control group (Figure 2). Overall, the decrease in volume averaged over all subfields was 28.4%, which is consistent with whole-hippocampus volume studies performed with manual18 or automatic19 segmentations.The intra-hippocampal connectomes were similar when averaged over all control subjects or all AD subjects and when using 100k streamlines (Figure 3a,b) or 1 seed per voxel and then normalizing by hippocampal volume (Figure 3d,e). However, the number of streamlines was significantly (p < 0.01) lower in the AD group than in the control group for the same four pairs of hippocampal subfields: head CA2/CA3 and head CA4/DG (3-4), head CA4/DG and body CA4/DG (4-9), head CA4/DG and body molecular layer/hippocampal fissure (4-11), and fimbria and hippocampal tail (10-12) (Figure 3c,f). Despite some variability within each group, the lower number of streamlines between these subfields is also clearly evident in individual control and AD subjects (Figure 4).
Discussion & Conclusion
Independently of the reduced hippocampal volume affecting nearly all subfields, the intra-hippocampal fiber tracking shows a significant decrease in number of streamlines in the AD group compared to the control group for four pairs of subfields (three of which include the head CA4/DG subfield), which may reflect microstructural changes caused by neurodegeneration in AD. However, further work is needed to investigate whether these preliminary results can be replicated not only in a larger cohort, but also in pre-symptomatic high-risk subjects (e.g., with a family history of AD) before any reduction in subfield volume can be detected to demonstrate the potential of this method for the early diagnosis of AD.High-order diffusion MRI models could also be explored to resolve intra-hippocampal crossing fibers, but typically require high b-values and/or multi-shell acquisitions, which is challenging to achieve with a high spatial resolution and whole-brain coverage. However, the latter constraint can be relaxed if only focusing on the hippocampus.
Acknowledgements
This work was in part supported by grants R01 EB028644, R01 NS075017, S10 OD021480, and P30 AG072958 from the National Institutes of Health.References
1. 2022 Alzheimer’s Disease Facts and Figures. 2022. Alzheimers Dement, 2022:18
2. Gómez-Isla, Teresa, et al. "Profound loss of layer II entorhinal cortex neurons occurs in very mild Alzheimer’s disease." Journal of Neuroscience 16.14 (1996): 4491-4500.
3. Jack Jr, C. R., et al. "Alzheimer's Disease Neuroimaging Initiative Serial PIB and MRI in normal, mild cognitive impairment and Alzheimer's disease: implications for sequence of pathological events in Alzheimer's disease." Brain 132.Pt 5 (2009): 1355-1365.
4. Mahaman, Yacoubou Abdoul Razak, et al. "Biomarkers used in Alzheimer’s Disease diagnosis, treatment, and prevention." Ageing Research Reviews (2021): 101544.
5. Thompson, Paul M., et al. "Dynamics of gray matter loss in Alzheimer's disease." Journal of neuroscience 23.3 (2003): 994-1005.
6. Frisoni, Giovanni B., Nick C. Fox, Clifford R. Jack, Philip Scheltens, and Paul M. Thompson "The clinical use of structural MRI in Alzheimer disease." Nature Reviews Neurology 6.2 (2010): 67-77.
7. Yu, Meichen, Olaf Sporns, and Andrew J. Saykin. "The human connectome in Alzheimer disease—relationship to biomarkers and genetics." Nature Reviews Neurology 17.9 (2021): 545-563.
8. Wang, Qi, et al. "The added value of diffusion-weighted MRI-derived structural connectome in evaluating mild cognitive impairment: A multi-cohort validation." Journal of Alzheimer's Disease 64.1 (2018): 149-169.
9. Filippi, Massimo, et al. "Changes in functional and structural brain connectome along the Alzheimer’s disease continuum." Molecular psychiatry 25.1 (2020): 230-239.
10. Beaujoin, Justine, et al. "Post-mortem inference of the human hippocampal connectivity and microstructure using ultra-high field diffusion MRI at 11.7 T." Brain Structure and Function 223.5 (2018): 2157-2179.
11. Ly, Maria, et al. "Mesoscale diffusion magnetic resonance imaging of the ex vivo human hippocampus." Human Brain Mapping 41.15 (2020): 4200-4218.
12. Ma, Yixin, et al. "Intra-hippocampal fiber tracking and connectome from submillimeter DTI of the human hippocampus in vivo and ex vivo." Proc Intl Soc Mag Med 30 (2022): 4759
13. Chen, Nan-kuei, Arnaud Guidon, Hing-Chiu Chang, and Allen W. Song "A robust multi-shot scan strategy for high-resolution diffusion weighted MRI enabled by multiplexed sensitivity-encoding (MUSE)." Neuroimage 72 (2013): 41-47.
14. Bruce, Iain P., et al. "3D-MB-MUSE: A robust 3D multi-slab, multi-band and multi-shot reconstruction approach for ultrahigh resolution diffusion MRI." Neuroimage 159 (2017): 46-56.
15. Smith, Stephen M., et al. "Advances in functional and structural MR image analysis and implementation as FSL." Neuroimage 23 (2004): S208-S219.
16. Tournier, J-Donald, et al. "MRtrix3: A fast, flexible and open software framework for medical image processing and visualisation." Neuroimage 202 (2019): 116137.
17. Iglesias, Juan Eugenio, et al. "A computational atlas of the hippocampal formation using ex vivo, ultra-high resolution MRI: application to adaptive segmentation of in vivo MRI." Neuroimage 115 (2015): 117-137.
18. Scher, Ann I., et al. "Hippocampal shape analysis in Alzheimer’s disease: a population-based study." Neuroimage 36.1 (2007): 8-18.
19. Lehmann, Manja, et al. "Atrophy patterns in Alzheimer's disease and semantic dementia: a comparison of FreeSurfer and manual volumetric measurements." Neuroimage 49.3 (2010): 2264-2274.
Figures