4159
Longitudinal assessment of MD and FA in four whole human brains using the DTI model1Department of Systems Neurosciences, University Medical Center Hamburg-Eppendorf, Hamburg, Germany, 2Institute of Legal Medicine, University Medical Centre Hamburg-Eppendorf, Hamburg, Germany, 3Department of Neurophysics, Max Planck Institute for Human Cognitive and Brain Sciences, Leipzig, Germany
Synopsis
Keywords: Diffusion/other diffusion imaging techniques, Ex-Vivo Applications, fixation, PFA, in-situ MRI, whole human brain
We investigated the longitudinal fixation effect of 4% paraformaldehyde and phosphate-buffered saline on diffusion imaging-derived mean diffusivity (MD) and fractional anisotropy (FA) across deep gray, cortical gray and white matter in human brains using suboptimal and optimal diffusion protocols with varying maximal b-values.We had two main findings: (1) a suboptimal diffusion protocol led to increased bias in the FA and MD up to 36.26% and 38.11%, the same trend was also observed for the across-brain variation; (2) MD changed by a maximum of 26.42% within the first 14 days in fixative and saturated afterward, whereas FA remained almost constant.
Introduction
As of today, there is no study that robustly maps the longitudinal change of fixation effects in diffusion parameters across several human brains. Shatil et al.[1] estimated diffusion parameters for two human brains, but did not adjust their b-value to the lower diffusivity of water in the in-situ and fixed ex-vivo brain. The optimal b-value for fixed ex-vivo tissue has been reported to be around 4000 s/mm2.[2]Assuming a linear dependence of the optimal b-value on the diffusivity of water, we estimated it to be 3500 s/mm2 for the in-situ brain (see Fig. 1).
In this study, we investigate the effect of fixation on diffusion parameters across four human brains using a double-diffusion-shell protocol with a b-value of 4000 s/mm2 optimized for fixed ex-vivo tissue. Additionally, we test the effect on our results when using the same protocol but with a suboptimal b-value of 2000 s/mm2.
Methods
Specimens:Four human brains from recently deceased donors with prior informed consent (WF-74/16) were used. For three of these specimens, a scan was performed before autopsy (in-situ), all four were fixated with 4 % paraformaldehyde (PFA) in a buffered aqueous solution. A replacement of the solution was performed in the first three weeks to ensure a proper fixation of the brain tissue. Later, the brains were hydrated in phosphate-buffered saline (PBS) solution. More information of the specimens are shown in table 1a).
MRI data acquisition:
Measurements were performed on a 3T PRISMA fit MRI (Siemens Healthcare, Erlangen, Germany) on whole brains with a Siemens 32-channel receiver head-coil. For the acquisition of the diffusion data, a echo-planar pulse-gradient spin echo sequence was used. Two diffusion protocols were used with: (1) b-values: 0, 1000 and 2000 s/mm2 (hereafter 1k2k shell) and (2) with b-values: 0, 2000 and 4000 s/mm2 (hereafter 2k4k shell). Details in table 1b). For both diffusion protocols sequence parameters were kept, except for the echo time which was 71 ms for the 1k2k shell and 79 ms for the 2k4k shell.
Analysis:
Each diffusion dataset was pre-processed and analyzed with the diffusion tensor model (DTI) implemented in the ACID toolbox[4] using SPM 12[5] in Matlab R2021b (MATLAB. (R2021b) Update 2. Natick, Massachusetts: The MathWorks Inc.). Then, MD and FA maps were calculated. For pre-processing, eddy current and motion (ECMOCO), and susceptibility-distortion (HySCO) were corrected. Subsequently, the MD and FA maps were longitudinally coregistered per brain and averaged. The averaged maps were used for segmentations to determine deep gray (GM), cortical gray (GM) and white (WM) matter masks, which were applied to all longitudinal data per brain (see figure 2).[6] Two analyses were performed: (1) to show the influence of diffusion protocols (1k2k and 2k4k) on MD and FA parameters, we compared them across different measurments performed in: in-situ, PFA (around 94 days in fixative) and PBS (around 9 to 27 days after changing solution); and (2) to assess the temporal evolution of MD and FA using the 2k4k shell protocol across a total of 175 time points from 0 to 150 days in fixative.
Results
Figure 3 depicts the influence of the two diffusion protocols on the estimated diffusion parameters (MD and FA). Between the two protocols, a noticeable offset in both parameters was observed with a positive bias in MD and FA values for the suboptimal 1k2k protocol. But also, the trend of the FA for different fixation steps (from in-situ to PBS) is different between protocols. The across-brain variation increased for both, FA and MD in the suboptimal 1k2k shell diffusion protocol. On average, the variation in FA between the protocols increased between 10.0% in in-situ and 36.26% in PBS; and in MD between 19.72% in in-situ and 38.11% in PFA.Figure 4 shows the temporal evolution of MD and FA values during fixation (PFA). The MD values decreased rapidly within the first 14 days (plot inset in d)-f)), while no consistent change was observable in FA. For MD, the difference between first PFA measurement and after 14 days in PFA was: 25.64 % for cGM, 26.43% for WM, and 18.71% for dGM.
Discussion & Conclusion
We could demonstrate that using a suboptimal 1k2k diffusion protocol to monitor the effect of fixation and hydration on diffusion parameters, increases the bias between-subject variability of the mean diffusivity (MD) and fractional anisotropy (FA). Using the 2k4k diffusion protocol, that has been reported to be optimal for ex-vivo diffusivity, we found no clear change in FA but a rapid decline of MD values within the first 14 days of fixation. A similar dependence is known for the transverse relaxation rate (R2)[7] and for the effective transverse relaxation rate (R2*).[6] Similar behavior of MD and R2 during fixation could be caused by a differential effect of the fixative on the intra- and extra-compartmental relaxation rates. These fixation-driven changes in compartmental relaxation rates could then directly cause the observed changes in MD, via the known relations between MD and the intra-cellular signal fraction (vic)[8], and between vic and the compartmental relaxation rates.[9] So far there is no suitable model to describe the interaction between diffusivity, fixation and b-shells. Our results can provide the missing information to develop such a model.Acknowledgements
This work was supported by the German Research Foundation (DFG Priority Program 2041 "Computational Connectomics”, [MO 2397/5-1;MO 2397/5-2], by the Emmy Noether Stipend: MO 2397/4-1; MO 2397/4-2) and by the BMBF (01EW1711A and B) in the framework of ERA-NET NEURON and the Forschungszentrums Medizintechnik Hamburg (fmthh; grant 01fmthh2017).References
- Shatil AS, Uddin MN, Matsuda KM and Figley CR (2018) Quantitative Ex Vivo MRI Changes due to Progressive Formalin Fixation in Whole Human Brain Specimens: Longitudinal Characterization of Diffusion, Relaxometry, and Myelin Water Fraction Measurements at 3T. Front. Med. 5:31. doi: 10.3389/fmed.2018.00031
- Dyrby TB, Baaré WF, Alexander DC, Jelsing J, Garde E, Søgaard LV. An ex vivo imaging pipeline for producing high-quality and high-resolution diffusion-weighted imaging datasets. Hum Brain Mapp. 2011;32(4):544-563. doi:10.1002/hbm.21043
- Roebroeck, A, Miller, KL, Aggarwal, M. Ex vivo diffusion MRI of the human brain: Technical challenges and recent advances. NMR in Biomedicine. 2019; 32:e3941. https://doi.org/10.1002/nbm.3941
- Fricke, B. et al. ACID - an open-source, bids compatible softwarefor brain and spinal cord dMRI: preprocessing, DTI/DKI, biophysical modelling, in: Proc. Intl. Soc. Mag. Reson. Med. 30. 2022.
- Friston, K., 2007. CHAPTER 2 - Statistical parametric mapping, in: FRISTON, K., ASHBURNER, J., KIEBEL, S., NICHOLS, T., PENNY, W. (Eds.), Statistical Parametric Mapping. Academic Press, London, pp. 10–31. doi: 10.1016/B978-012372560-8/50002-4
- Streubel, T. et al. Quantification of tissue shrinkage due to formalin fixation of entire post-mortem human brain, in: Proc. Intl. Soc. Mag. Reson. Med. 28. 2019.
- Raman, M.R., Shu, Y., Lesnick, T.G., Jack, C.R., Kantarci, K., 2017. Regional T1 relaxation time constants in Ex vivo human brain: Longitudinal effects of formalin exposure. Magnetic Resonance in Medicine 77, 774–778. https://doi.org/10.1002/mrm.26140
- Edwards LJ, Pine KJ, Ellerbrock I, Weiskopf N and Mohammadi S (2017) NODDI-DTI: Estimating Neurite Orientation and Dispersion Parameters from a Diffusion Tensor in Healthy White Matter. Front. Neurosci. 11:720. doi: 10.3389/fnins.2017.00720
- Gong T, Tong Q, He H, Sun Y, Zhong J, Zhang H. MTE-NODDI: Multi-TE NODDI for disentangling non-T2-weighted signal fractions from compartment-specific T2 relaxation times. Neuroimage. 2020 Aug 15;217:116906. doi: 10.1016/j.neuroimage.2020.116906. Epub 2020 May 7. PMID: 32387626.
Figures
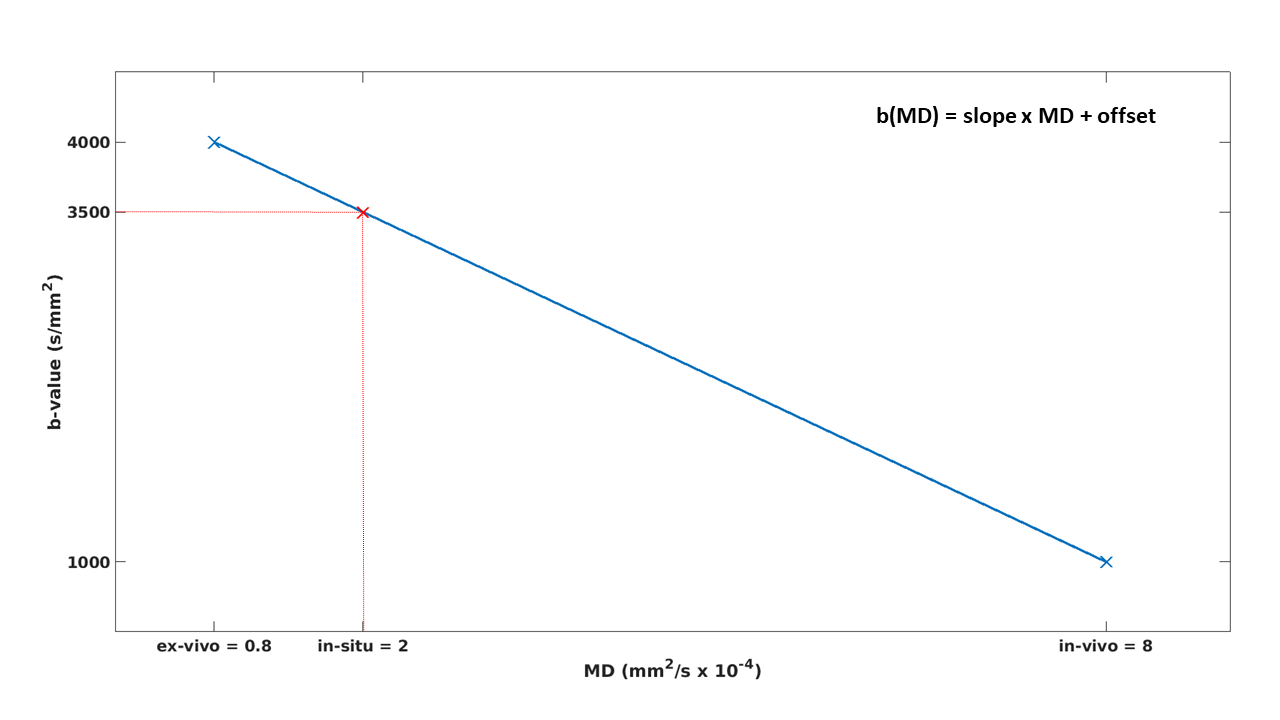
Fig. 1: Optimal b-value as function of mean diffusivity (MD). The in-vivo white matter (WM) MD value is ~ 8 x 10⁻⁴ mm2/s when using a b-value of 1000 s/mm2 [3], while the ex-vivo MD in WM is ~ 0.8 x 10⁻⁴ mm2/s for a b-value of 4000 s/mm2 [2]. Assuming a linear dependence between MD and optimal b-value (blue curve, slope = -41670 & offset = 4333) and using the reported in-situ MD in WM (~ 2 x 10⁻⁴ mm2/s [1]) the optimal b-value for in-situ measurements can be calculated, resulting in ~ 3500 s/mm2 (red cross).
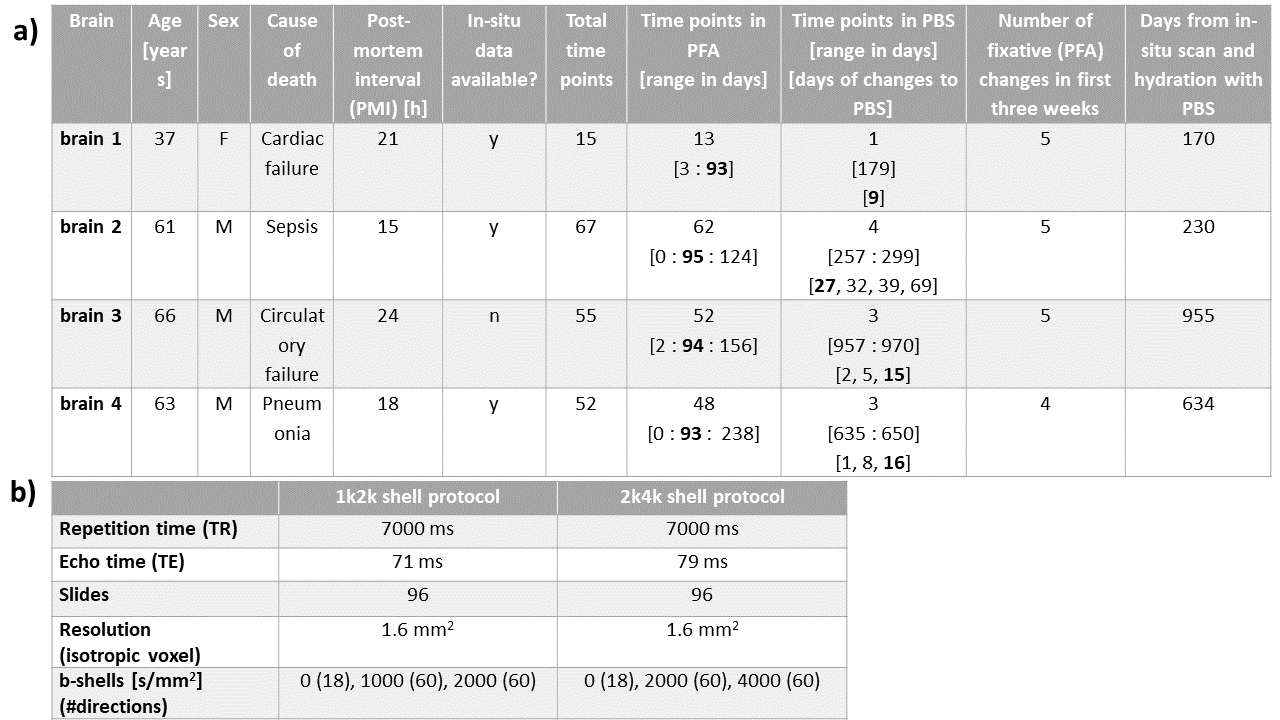
Tab. 1: Detailed information of:
Table a): the four whole human brains, including the number of scans for the different fixation steps (in-situ, PFA and PBS). The later used timepoints for figure 4 are in bold.
Table b): the sequence protocols used for the acquisition of the diffusion data for the 1k2k shell and 2k4k shell protocols.
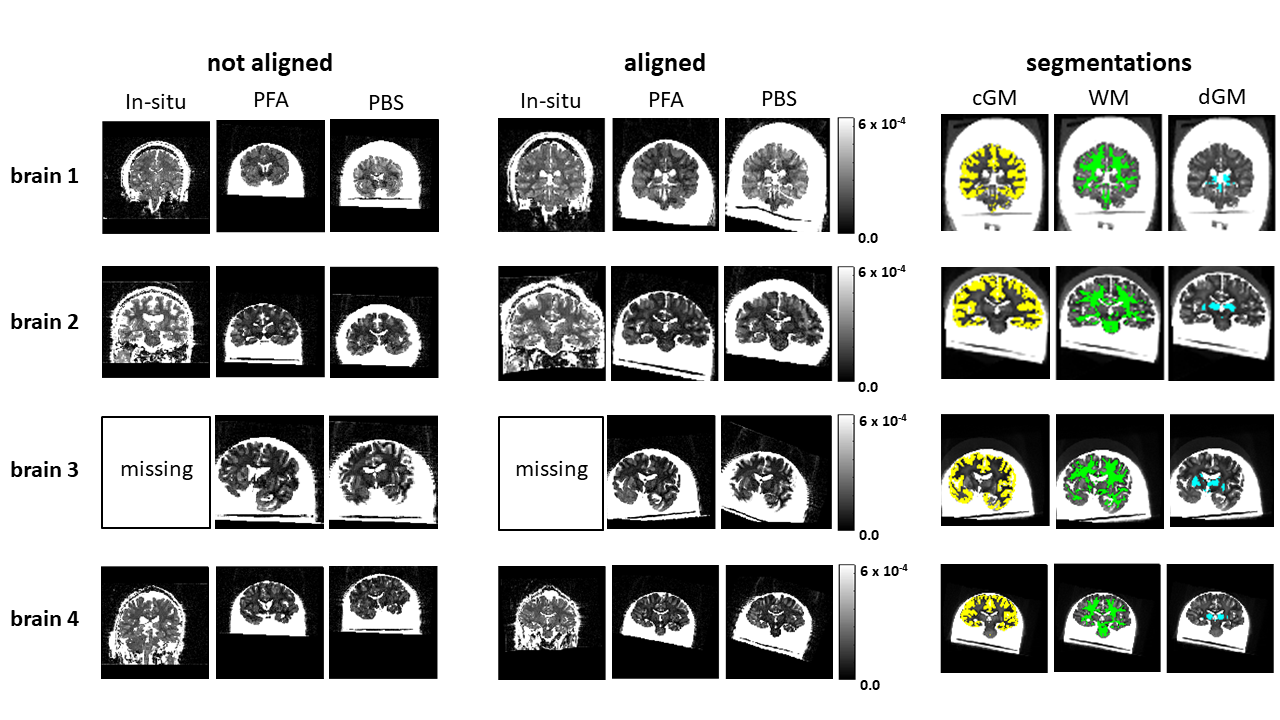
Fig. 2: Illustrative representation of the longitudinal coregistration of the mean diffusivity (MD) maps at different fixation steps for the different brains. The left column shows the not aligned images while the middle column shows the coregistered volumes. The right column shows the three individual segmentation masks
(cGM = yellow, WM = green, dGM = blue) for each brain.
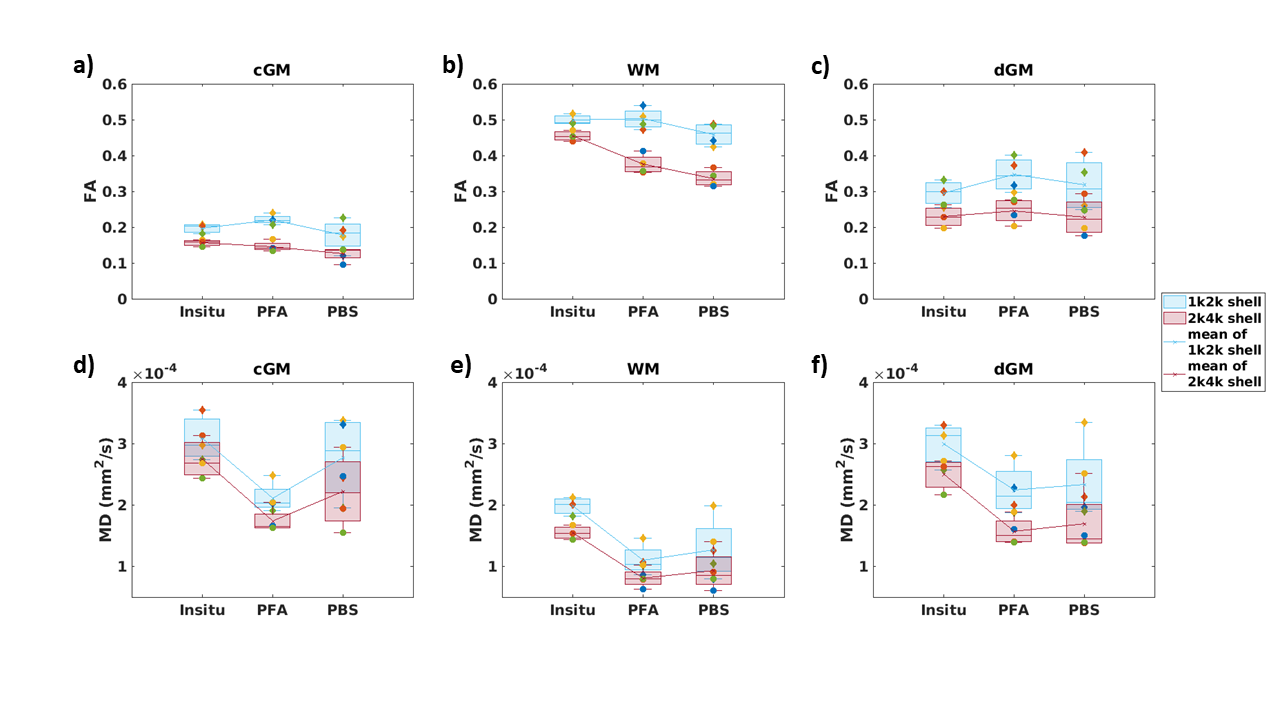
Fig. 3: Median, mean and standard deviation (across brains) of the fractional anisotropy (FA) and mean diffusivity (MD) values per fixation step (in-situ, 94 days fixed, PFA; and between 9-27 days dehydrated, PBS) in cortical gray (cGM: a,d), white (WM: c, e) and deep gray (dGM: c, f) matter from the 1k2k (blue) and 2k4k (red) diffusion protocols. Each brain data point ( yellow = brain 1, red = brain 2, blue = brain 3, green = brain 4) is plotted in circles for the 1k2k measurement and in triangles for the 2k4k measurement.
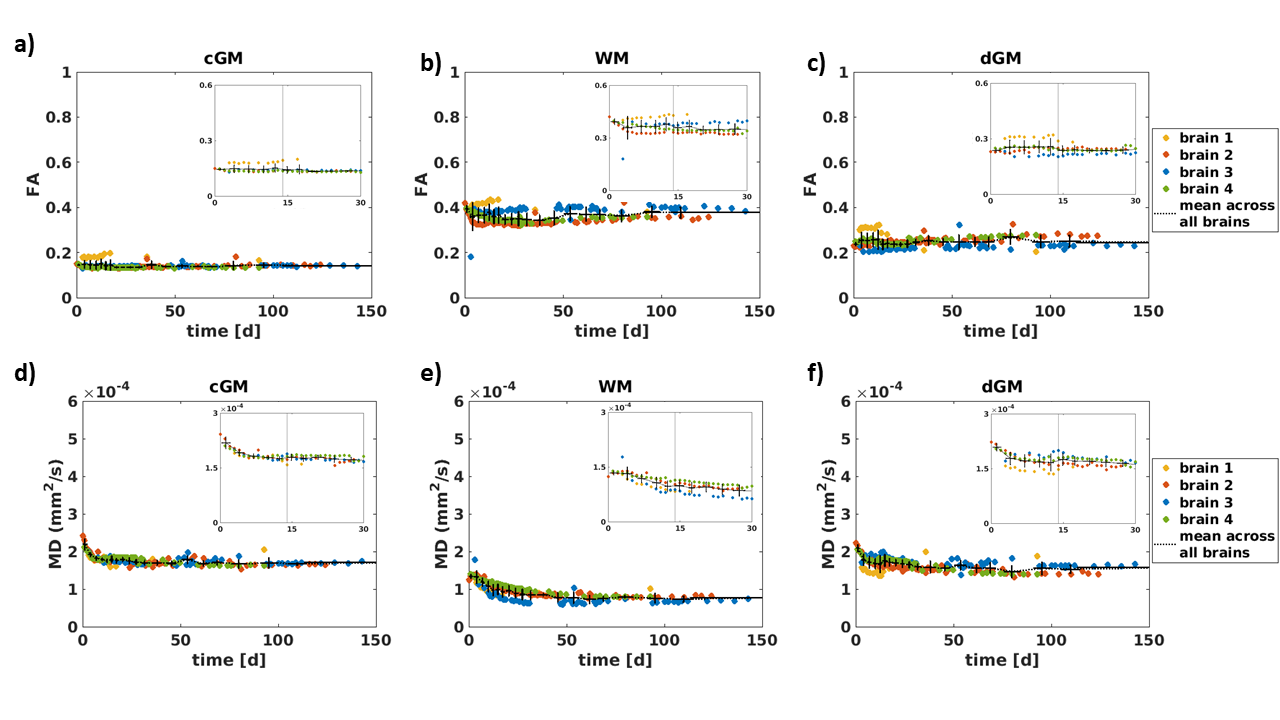
Fig. 4: Longitudinal change of the fractional anisotropy (FA, a-c) and mean diffusivity (MD, d-f) values across all brains (yellow = brain 1, red = brain 2, blue = brain 3, green= brain 4) within three tissue segments: cortical gray (cGM, a, d), white (WM, b, e) and deep gray (dGM, c, f) matter during fixation (PFA). The data points of the individual brains were binned in 20 bins over time and the median value was calculated (black crosses). Magnified insets depict the first 30 days; the dashed line highlights day 14.