4158
Detection of multiple sclerosis by extraction of quantitative parameters of brain tissue microstructure in ex-vivo cerebellum samples1Radiology, Division of MR Research, Beth Israel Deaconess Medical Center, Harvard Medical School, Boston, MA, United States, 2CNRS, CRMBM, Aix-Marseille Univ, Marseille, France
Synopsis
Keywords: Microstructure, Quantitative Imaging
Extraction of quantitative parameters of brain tissue microstructure is possible with DTI, inhomogeneous MT (ihMT), and MWF MRI. We examine the ability of the parameters from these techniques to distinguish ex-vivo specimens of the cerebellum from donors with MS relative to non-MS tissue. Significant differences were found for DTI and MT/ihMT metrics in WM, but only for MT/ihMT in GM. Differences between quantitative MT parameters from fits to ihMT data were not significant.Introduction
Multiple sclerosis (MS) is a neuroinflammatory disorder that is commonly associated with myelin and/or axonal damage. MRI is a key tool for non-invasive diagnosis and monitoring progression in MS1, but clinical sequences are relatively simple with signals and contrasts that are non-specific, increasing the risk of misdiagnosis2. Use of quantitative MRI would provide an objective measure of MS and allow long-term study of MS progression3. In this work we provide an ex-vivo comparison of quantitative parameters extracted from MRI techniques previously applied to assess microstructural changes associated with MS4–6. Novelty lies in use of ex-vivo specimens (for eventual comparison with histology) from donors with and without a diagnosis of MS for comparison. We compare quantitative parameters from: DTI; myelin water fraction (MWF); and inhomogeneous MT (ihMT) MRI. This includes application of a quantitative MT (qMT) approach to the ihMT data, which adds to the novelty of this work.Methods
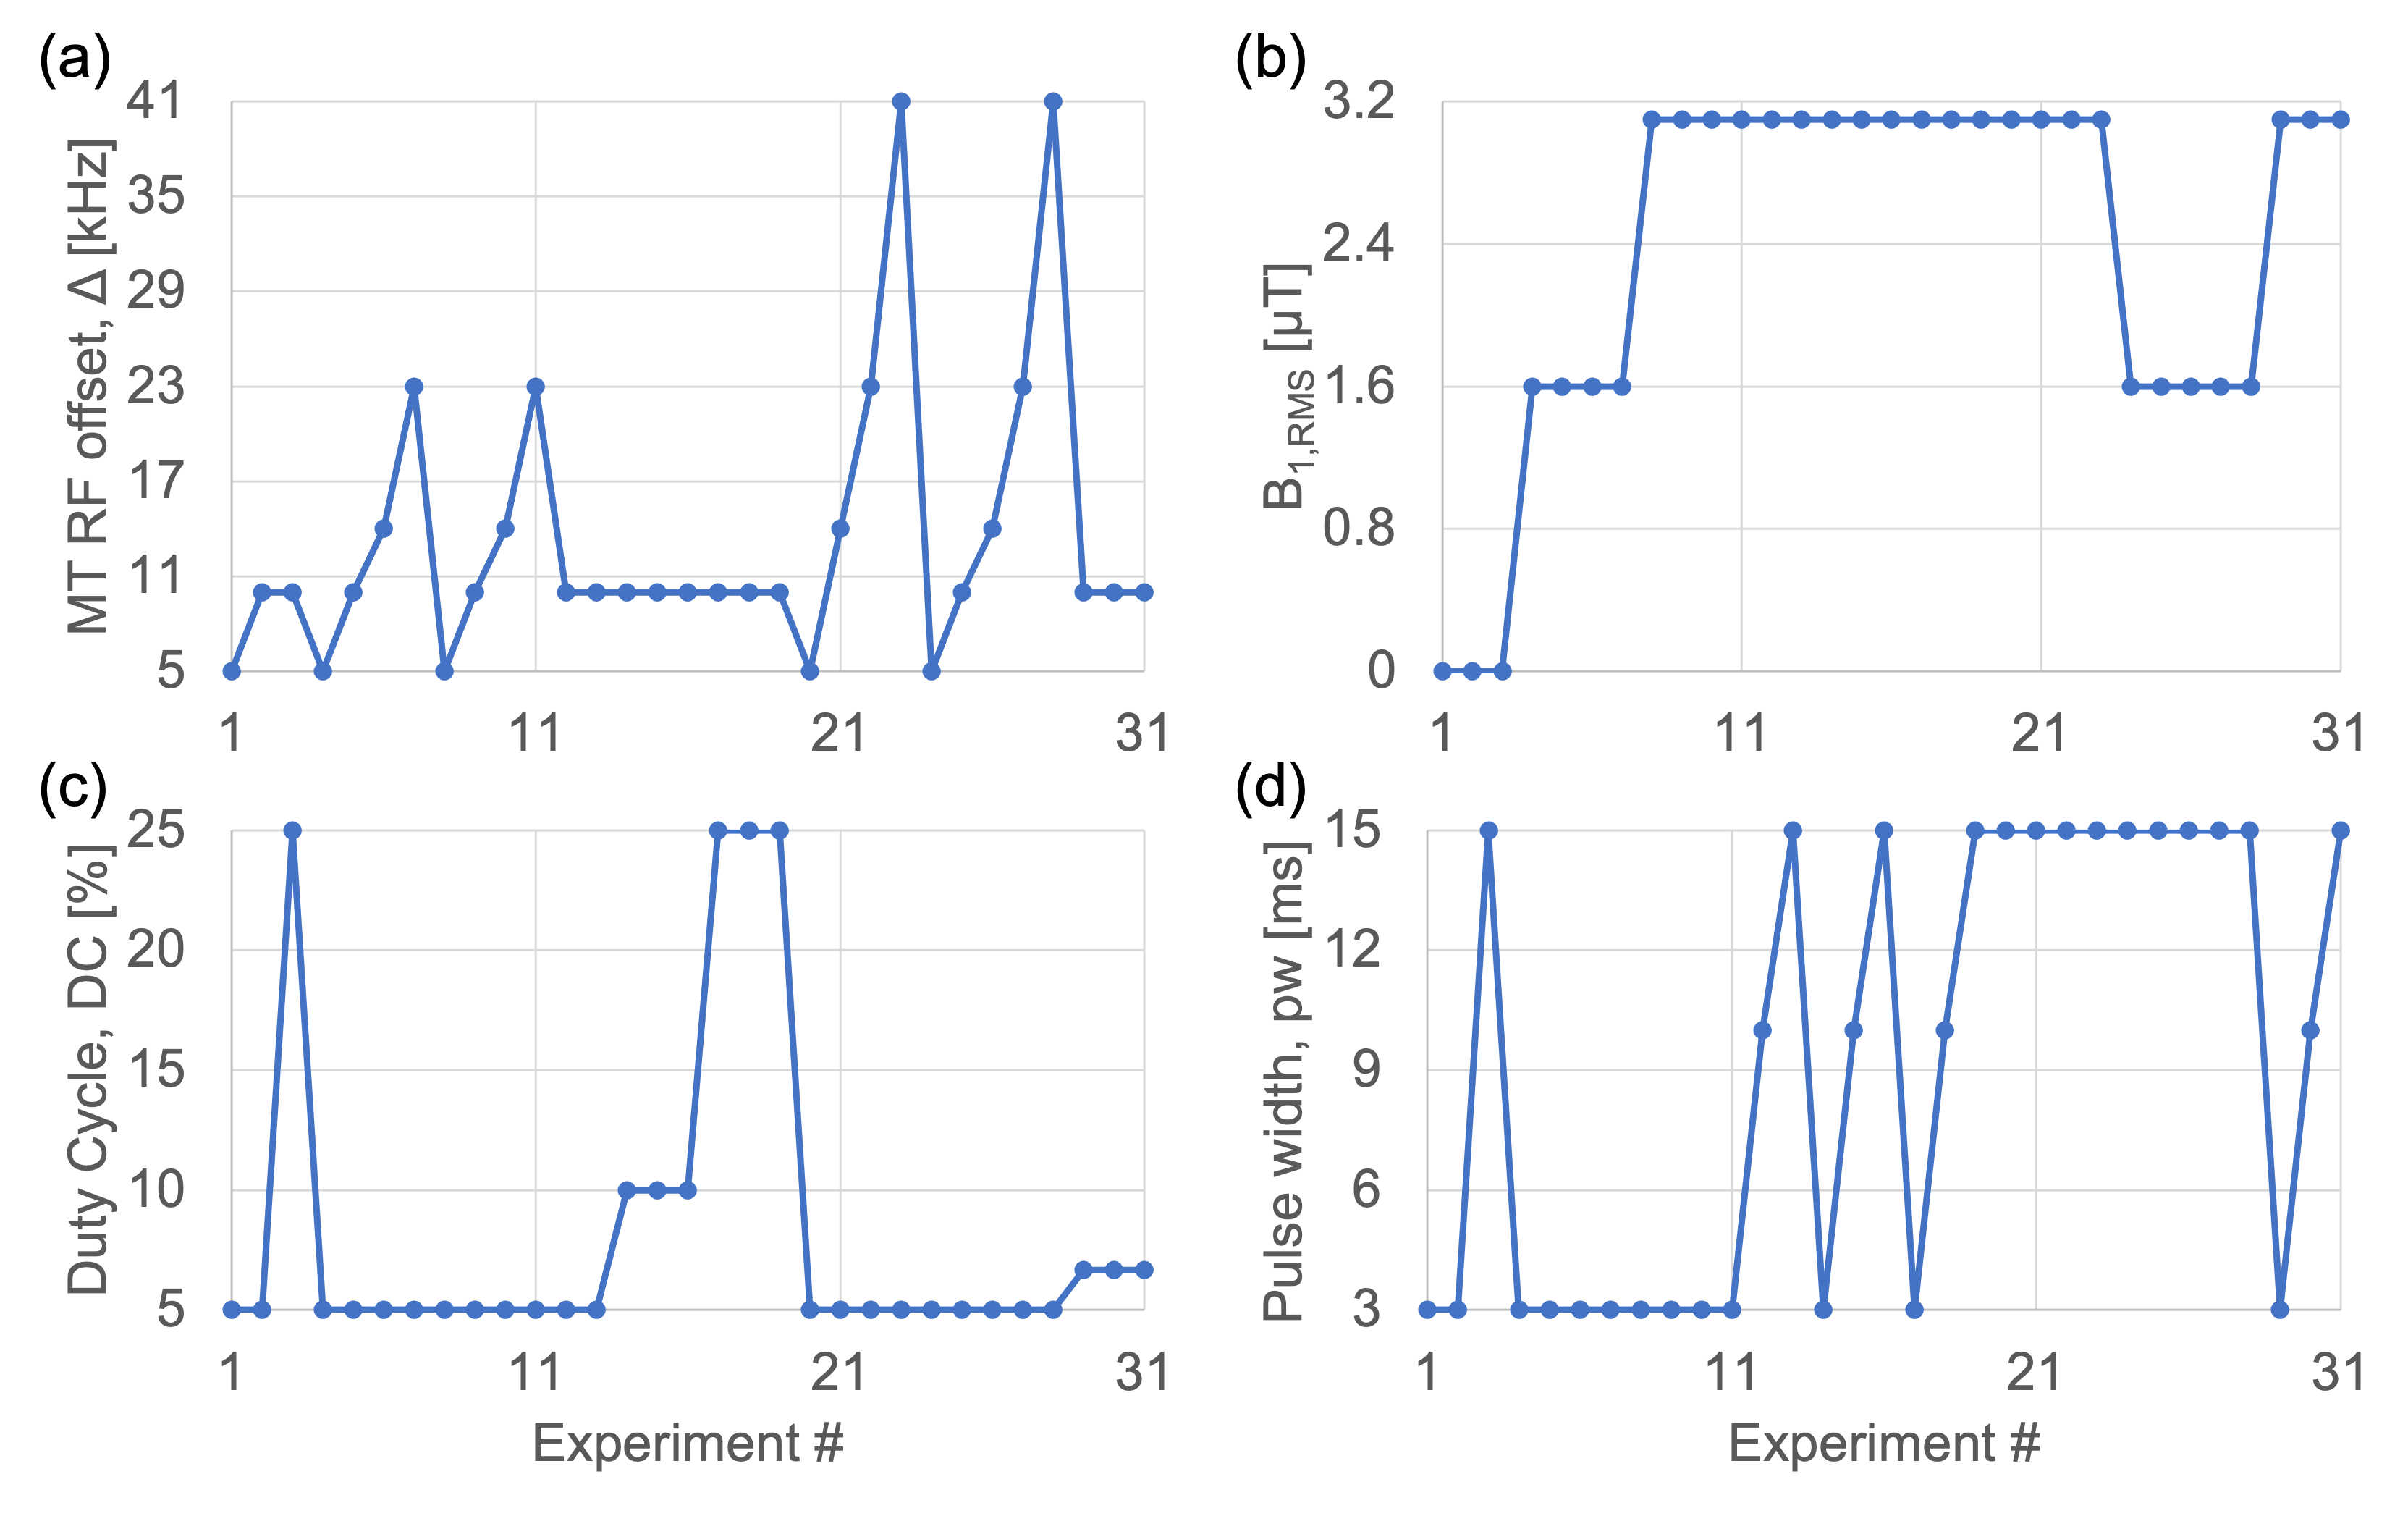
Ex-vivo cerebellum samples (females, 5 MS and 5 non-MS) were obtained following request to a biobank and arrived formalin fixed. Information provided by the biobank was used to closely match post-mortem intervals (PMIs; time between death and processing) and subjects' ages. Samples were washed and immersed in PBS for at least 24 hours prior to MRI with a transmit-receive 40-mm volume coil at 9.4T (Biospec 94/20, Bruker). Data were acquired using an air heater system with fiber optic temperature probe (SA Instruments) to heat the sample to a physiological 37°C, and with the same FOV=51.2x25.6x1.44mm3 and in-/through-plane resolutions=0.4/1.2mm.DTI data were acquired using 3D spin-echo-EPI with: b=4000s/mm2 in 30 directions; 2 b0 images, processed in Paravision (5.1, Bruker) to produce maps of fractional anisotropy (FA), apparent diffusivity (AD), mean diffusivity (MD), and radial diffusivity (RD). MWF data were acquired with a modified 3D multi-echo, spin-echo sequence with composite, non-selective refocusing pulses7 (NA=2; ΔTE/TR=6.8/2000ms). IhMT experiments were acquired using a modified MDEFT sequence with a preparation of repeated MT pulses. Processing of MWF (by non-negative least-squares fits8,9) and ihMT data, and ROI analysis were conducted in Matlab (R2020b, Mathworks), with manually drawn ROIs in white matter (WM) and grey matter (GM), avoiding lesions and matched across techniques. For qMT, 31 sets of ihMT experiments were conducted with changes to frequency offset Δ, B1,RMS, duty cycle of MT pulses, as well as their pulse width (Figure 1). Parameters were extracted by modification of code for matrix-based signal modelling by Malik et al10, and fits to ROI data. Outputs included: fractional size of bound relative to free pool F, fractional size of bound pool with non-zero T1d f11, offset of bound relative to free pool Δb12, R, T1b, T1d, T1f, T2b. MTRinv and ihMTRinv (from 13) were calculated using data from the 8th and the average of the first 3 experiments, which given B1,RMS=0 μT amount to non-saturated (M0) images used for normalization.
Results
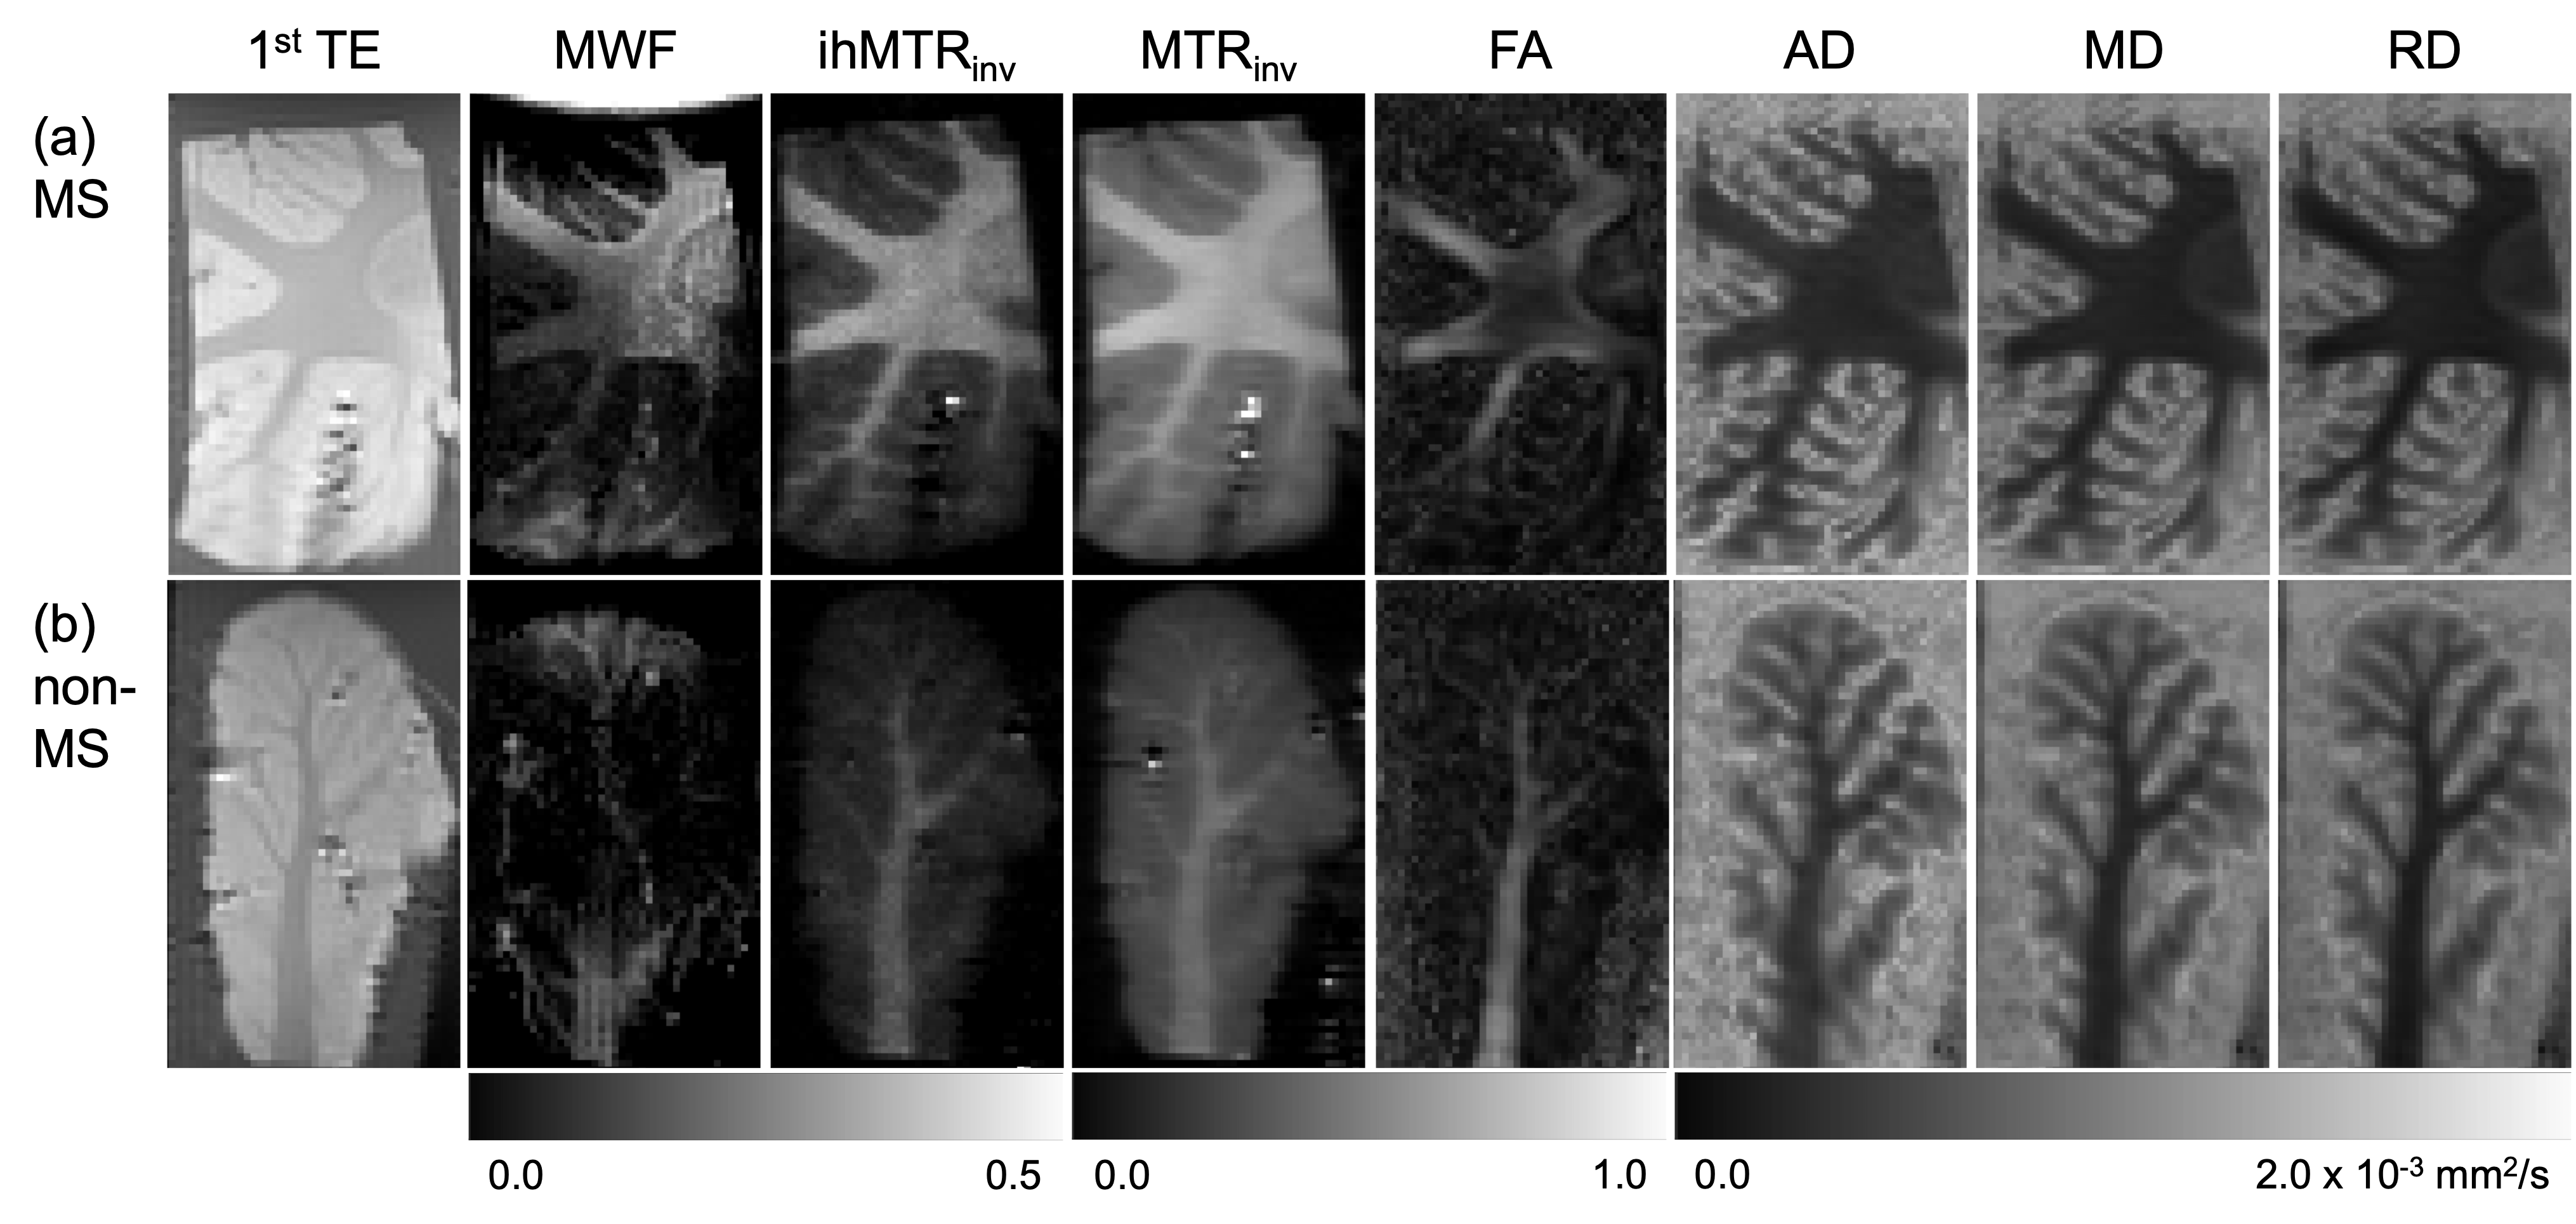
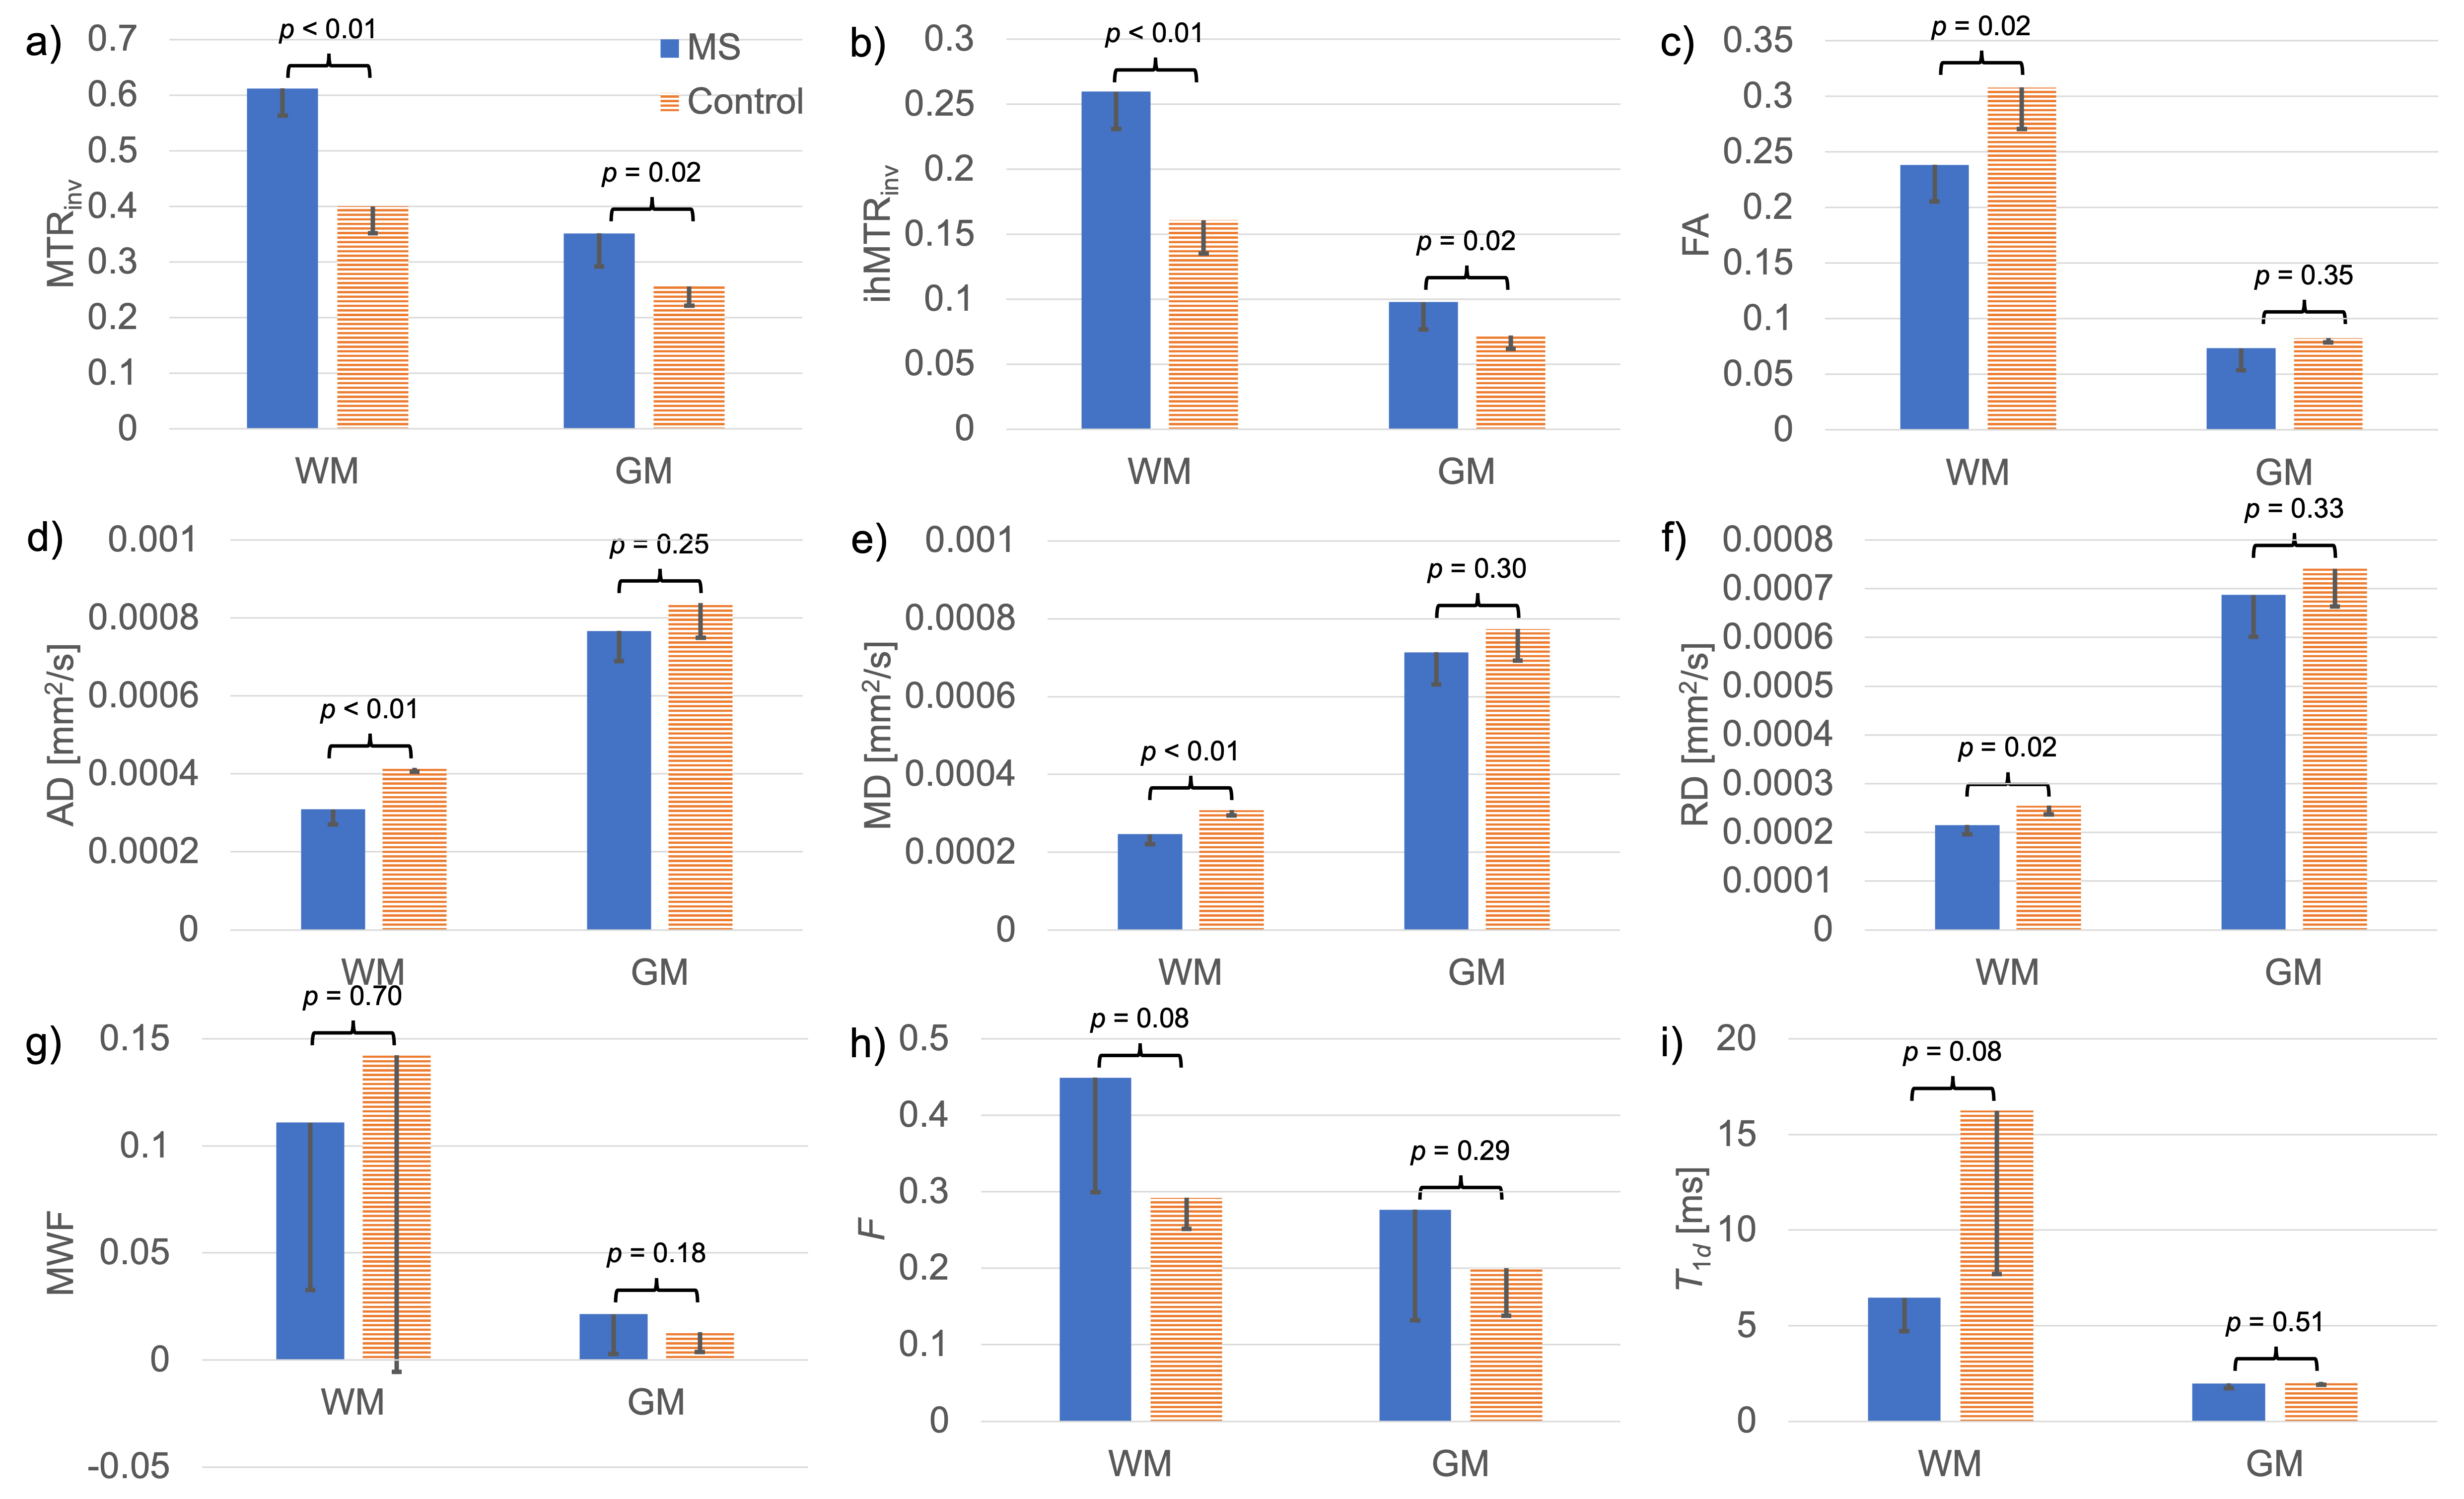
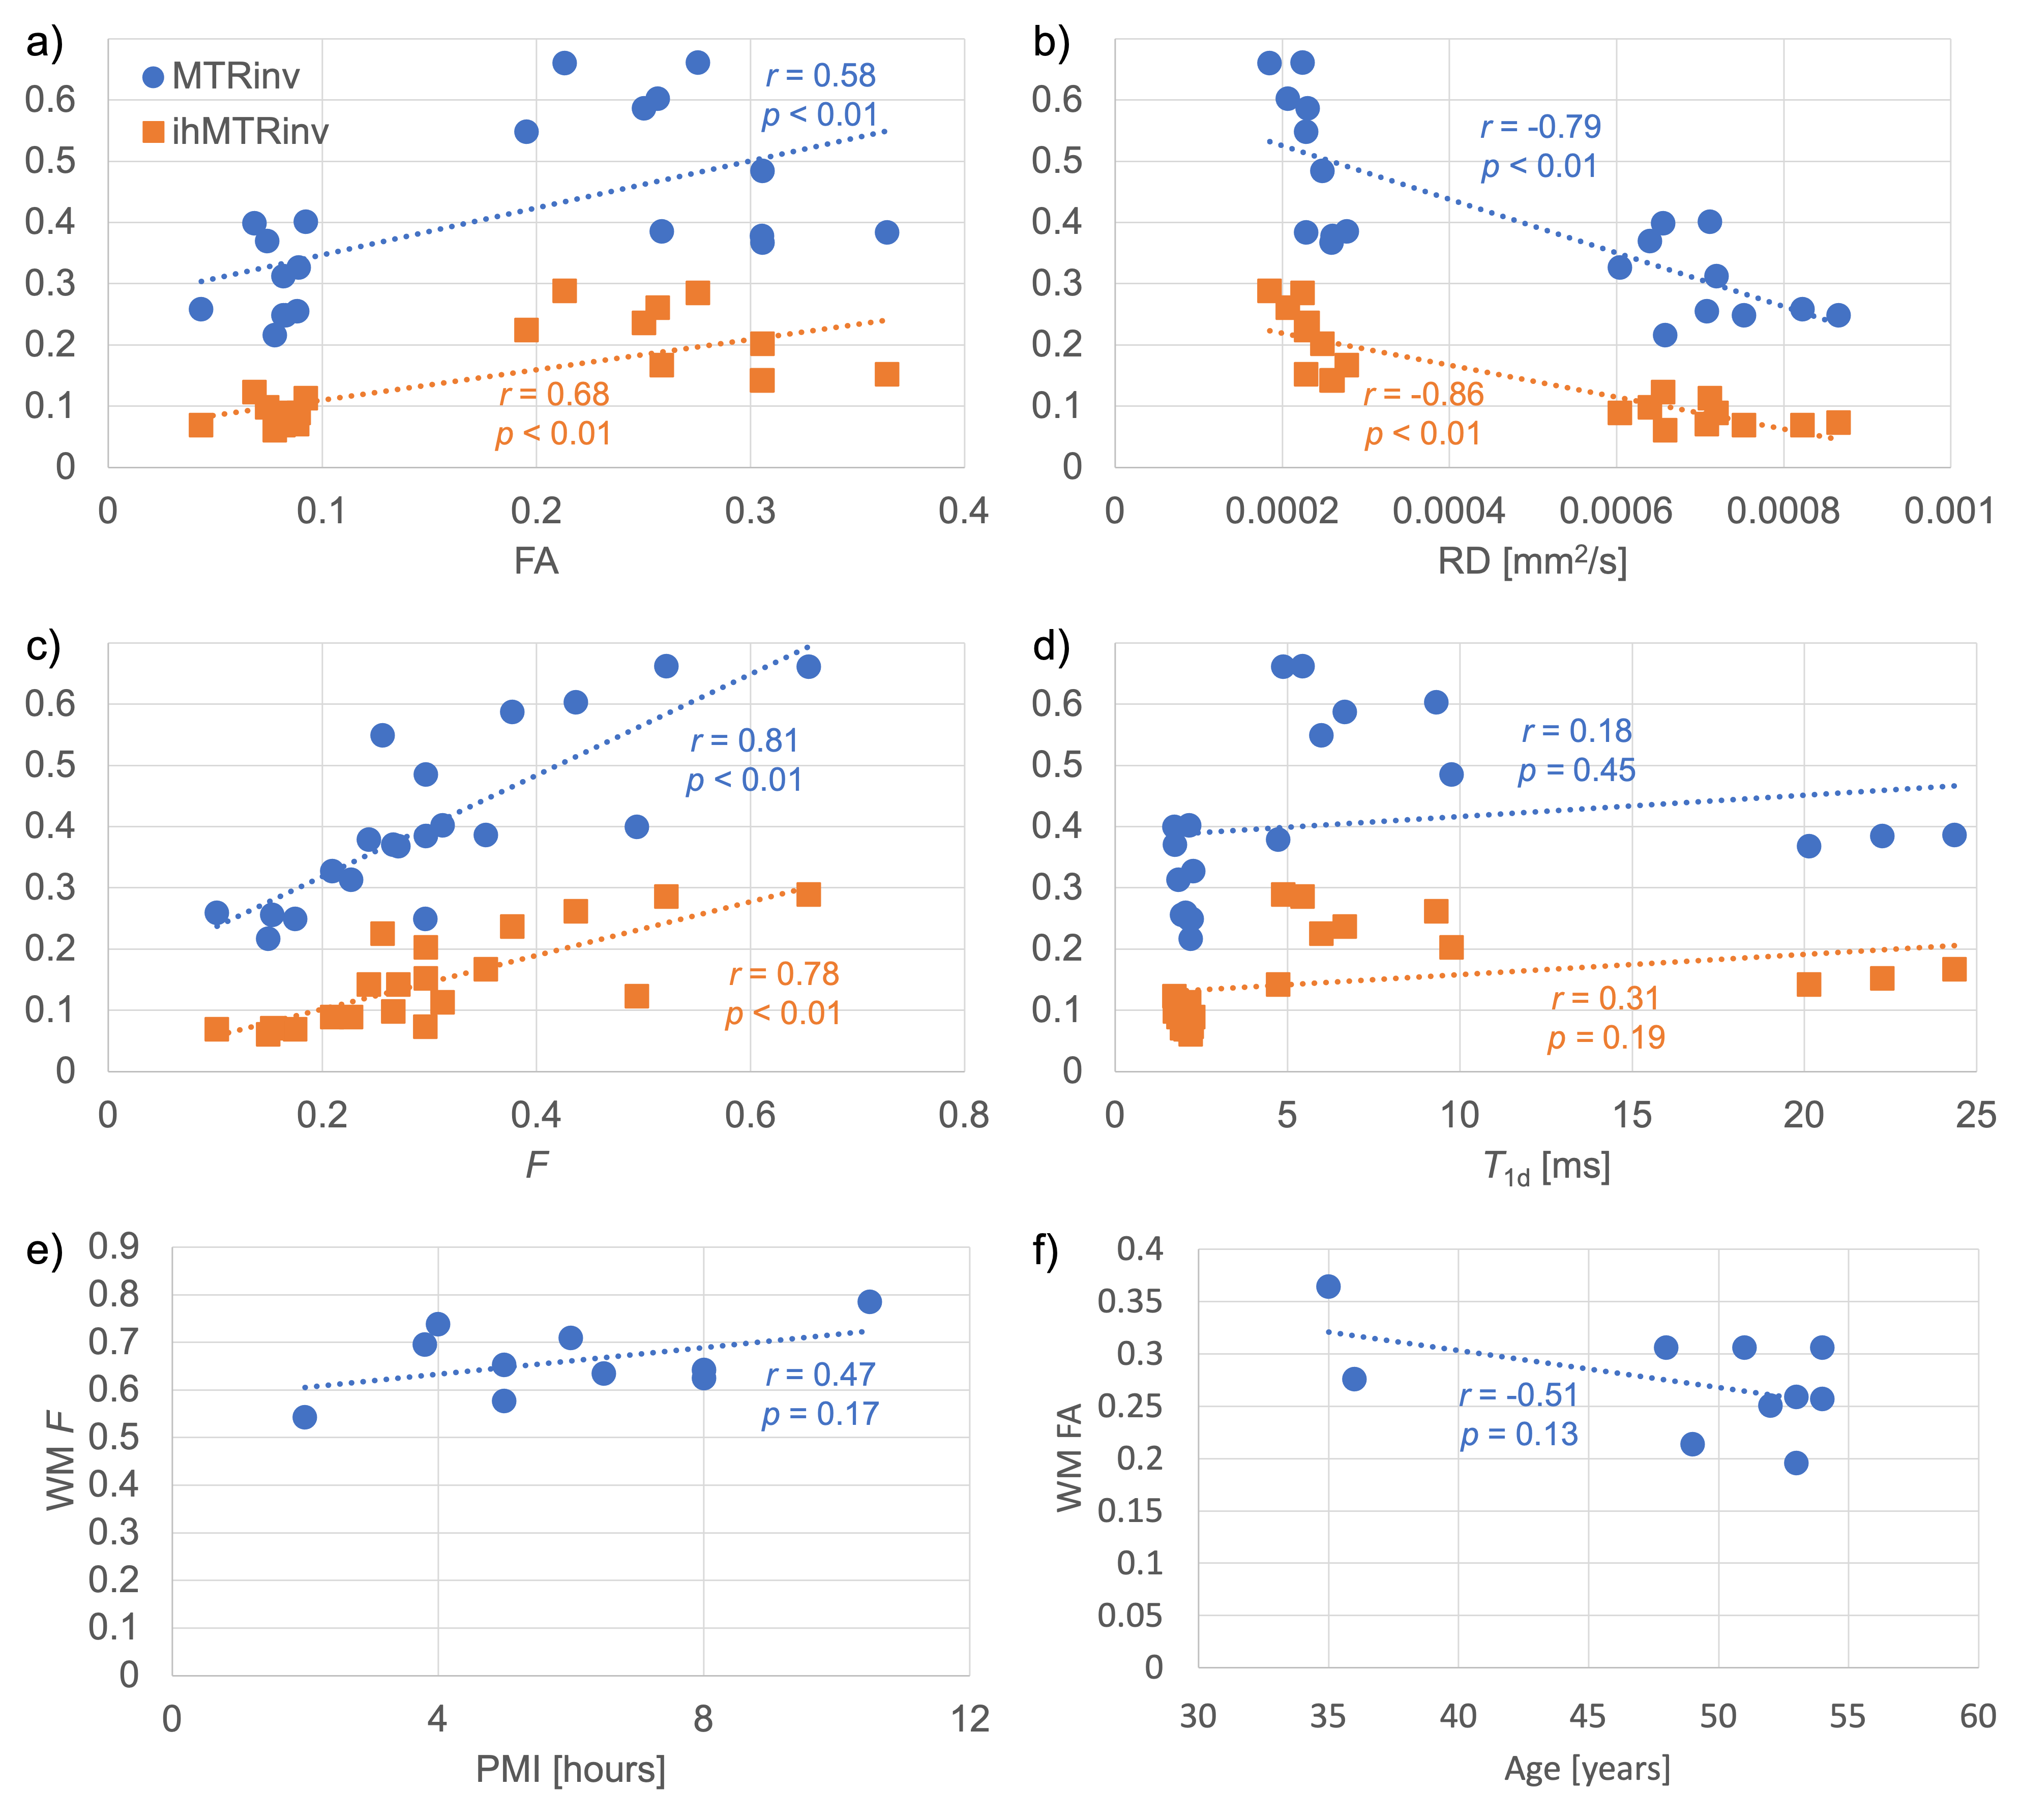
Variation not only in the calculated quantitative maps, but also between the specimens themselves, can be appreciated qualitatively (Figure 2): A decrease in FA from the MS specimen is visible in a WM region where tracts appear to cross; Both ihMTRinv and MTRinv appear greater for the MS specimen, which is supported by significant differences in both WM and GM from ROI analysis (Figures 3a-b). All DTI metrics considered show a significant difference between WM from MS and non-MS specimens (Figures 3c-f). Differences between groups for qMT parameters only came close to significance (p<0.1) for F and T1d in WM (Figures 3h-i) and Δb in GM. Significant correlations were calculated for FA, RD, and F with both MTRinv and ihMTRinv (Figures 4a-d). For those parameters with the smallest p-values between MS and non-MS specimens, the largest absolute correlations with non-MRI metrics were between WM F and PMI, and WM FA and age, but neither were significant (Figures 4e-f).Discussion
Analysis of MWF results was difficult due to the relatively large variation within and between specimens (Figures 2,3g). A similar breakdown in MWF signal and contrast was observed for ex-vivo specimens in formalin at 37°C14. Intriguingly, average RD increased, while MTRinv, ihMTRinv, and F values were decreased for specimens without MS (Figure 3), in contrast to in-vivo literature comparing normal-appearing WM in MS patients with WM in controls6,15,16. This mismatch might be explained by the time specimens remained fixed at the biobank, particularly given the relatively short T1f times output: MS T1f=(254±78)ms; non-MS T1f=(259±34)ms, and T1 decreases with fixation17. Nonetheless, these results suggest that qMT using ihMT data, whilst providing greater insight into the microstructural changes, might not allow for easy differentiation of pathology due to inherent tissue heterogeneity or variability such that no one parameter changes consistently. Alternatively, the qMT parameters considered might have been too numerous or correlated to be determined with sufficient accuracy using this protocol (Figure 1)18. No significant correlation between any MRI parameter and PMI or age adds confidence to any differences reflecting MS pathology.Conclusion
Quantitative metrics from DTI and ihMT experiments successfully differentiated WM in ex-vivo cerebellum tissue specimens from donors with and without MS. Semi-quantitative MTRinv and ihMTRinv had differences of greater significance than parameters from qMT, and both correlated significantly with F but required less data.Acknowledgements
We gratefully acknowledge the National Institutes of Health (NIH) NeuroBioBank as the source of tissue used in this study, and support from the National Institute of Neurological Disorders and Stroke of the NIH under award number R21NS114546.References
1. Ontaneda, D. & Fox, R. J. Imaging as an Outcome Measure in Multiple Sclerosis. Neurotherapeutics 14, 24–34 (2017).
2. Aliaga, E. S. & Barkhof, F. MRI mimics of multiple sclerosis. in Handbook of Clinical Neurology vol. 122 291–316 (Elsevier, 2014).
3. Tofts, P. S. Quantitative MRI of the Brain: Measuring Changes Caused by Disease. (Wiley).
4. Sbardella, E., Tona, F., Petsas, N. & Pantano, P. DTI Measurements in Multiple Sclerosis: Evaluation of Brain Damage and Clinical Implications. Multiple Sclerosis International 2013, 1–11 (2013).
5. Lipp, I. et al. Comparing MRI metrics to quantify white matter microstructural damage in multiple sclerosis. Human Brain Mapping 40, 2917–2932 (2019).
6. Zhang, L. et al. A comparison study of inhomogeneous magnetization transfer (ihMT) and magnetization transfer (MT) in multiple sclerosis based on whole brain acquisition at 3.0 T. Magnetic Resonance Imaging 70, 43–49 (2020).
7. Poon, C. S. & Henkelman, R. M. Practical T2 quantitation for clinical applications. J. Magn. Reson. Imaging 2, 541–553 (1992).
8. Mackay, A. et al. In vivo visualization of myelin water in brain by magnetic resonance. Magn. Reson. Med. 31, 673–677 (1994).
9. Whittall, K. P. & MacKay, A. L. Quantitative interpretation of NMR relaxation data. Journal of Magnetic Resonance (1969) 84, 134–152 (1989).
10. Malik, S. J., Teixeira, R. P. A. G., West, D. J., Wood, T. C. & Hajnal, J. V. Steady-state imaging with inhomogeneous magnetization transfer contrast using multiband radiofrequency pulses. Magnetic Resonance in Medicine 83, 935–949 (2020).
11. Varma, G. et al. Interpretation of magnetization transfer from inhomogeneously broadened lines (ihMT) in tissues as a dipolar order effect within motion restricted molecules. Journal of Magnetic Resonance 260, 67–76 (2015).
12. Prevost, V. H., Girard, O. M., Varma, G., Alsop, D. C. & Duhamel, G. Minimizing the effects of magnetization transfer asymmetry on inhomogeneous magnetization transfer (ihMT) at ultra-high magnetic field (11.75 T). Magn Reson Mater Phy 29, 699–709 (2016).
13. Varma, G. et al. Low duty-cycle pulsed irradiation reduces magnetization transfer and increases the inhomogeneous magnetization transfer effect. Journal of Magnetic Resonance 296, 60–71 (2018).
14. Prevost, V. H. et al. Temperature dependence and histological correlation of inhomogeneous magnetization transfer and myelin water imaging in ex vivo brain. NeuroImage 236, 118046 (2021).
15. Roosendaal, S. et al. Regional DTI differences in multiple sclerosis patients. NeuroImage 44, 1397–1403 (2009).
16. Bagnato, F. et al. Selective Inversion Recovery Quantitative Magnetization Transfer Brain MRI at 7T: Clinical and Postmortem Validation in Multiple Sclerosis. Journal of Neuroimaging 28, 380–388 (2018).
17. Seifert, A. C., Umphlett, M., Hefti, M., Fowkes, M. & Xu, J. Formalin tissue fixation biases myelin-sensitive MRI. Magnetic Resonance in Medicine 82, 1504–1517 (2019).
18. Cercignani, M. & Alexander, D. C. Optimal acquisition schemes for in vivo quantitative magnetization transfer MRI. Magnetic Resonance in Medicine 56, 803–810 (2006).
Figures