4155
Probing gray matter microstructure with diffusion MRI in preclinical Alzheimer’s disease: A comparison of methods1Diagnostic Radiology, Department of Clinical Sciences, Lund University, Lund, Sweden, 2Image and Function, Skåne University Hospital, Lund, Sweden, 3Clinical Memory Research Unit, Department of Clinical Sciences, Lund University, Lund, Sweden, 4Memory Clinic, Skåne University Hospital, Malmö, Sweden
Synopsis
Keywords: Diffusion/other diffusion imaging techniques, Alzheimer's Disease
Gray matter microstructural changes appear prior to macrostructural changes in Alzheimer’s disease, these changes can be probed by diffusion MRI. However, different methods can be used to extract metrics in the thin cortical ribbon. The influence of the choice of method on the results has not been investigated yet. In this work, two different methods of extracting diffusion metrics in the cortex are compared, a surface-based approach and gray matter based spatial statistics (GBSS). We improve upon GBSS and show it now yields comparable results to a surface-based method.Introduction
Diffusion MRI (dMRI) has revealed altered gray matter microstructure prior to structural changes in subjects with preclinical Alzheimer’s disease (AD)1–3. Thus, dMRI may yield biomarkers for early changes related to amyloid and tau accumulation in AD. Different methods have been used to quantify dMRI parameters in the thin cortical ribbon, the influence of these methods on the results has not been investigated yet. A commonly used approach is based on the identification of the cortical surface using a morphological scan to which the diffusion data is coregistered2,3. Another approach is so-called gray-matter based spatial statistics (GBSS)4, which does not require intramodal registration5,6.In this work, we introduce a modified version of GBSS based on multi-tissue constrained spherical deconvolution (MT-CSD) and compare its performance with the standard GBSS method, which is based on neurite orientation dispersion and density imaging (NODDI-GBSS)7,8. The two GBSS versions are also compared with the surface-based approach with the aim to investigate how the method of choice influences the microstructural changes detected in the early stages of the AD pathological cascade.
Methods
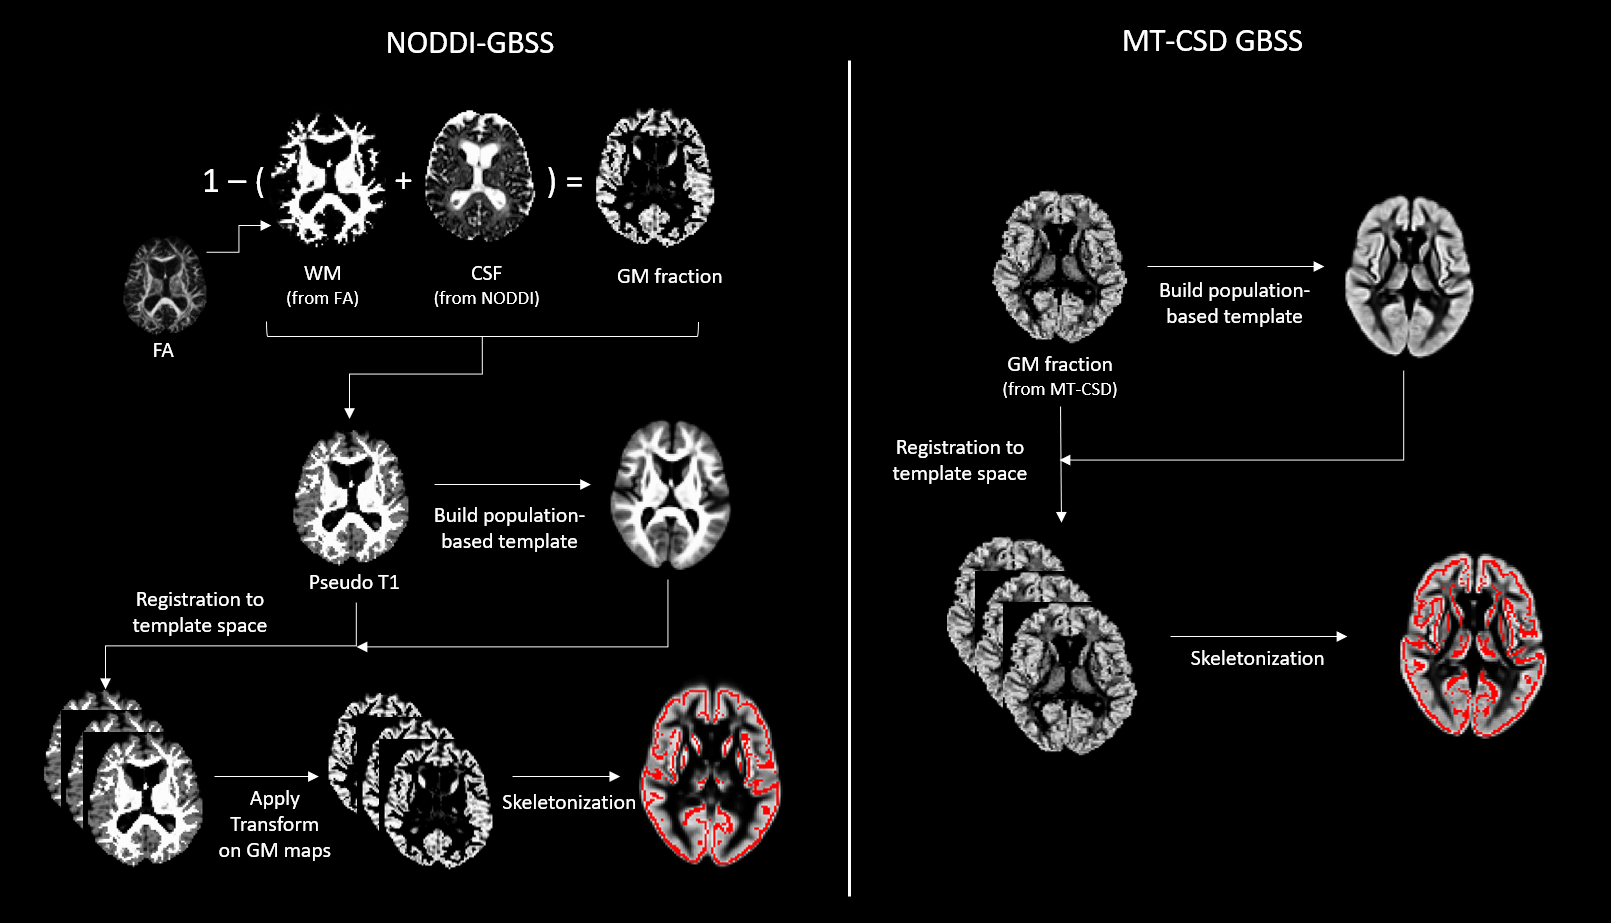
Diffusion-weighted imaging (DWI) was performed in 436 participants using a protocol with 104 DWI volumes (resolution: 2x2x2 mm3; b-values: 0, 100, 1000, and 2500 sec/mm2 in 2, 6, 32, and 64 directions, respectively). The DWI data was preprocessed using denoising9, Gibbs deringing10, susceptibility-induced distortion correction11, motion and eddy-current distortion correction12 and bias field correction13. After this, parameters maps of the mean diffusivity (MD), neurite density index (NDI) and grey matter fraction (fGM) were calculated using DTI, NODDI14 and MT-CSD15 respectively.Metrics in the cortical ribbon were extracted using three different methods, two versions of GBSS and a surface-based approach. In GBSS the cortical ribbon was skeletonized using an adapted TBSS pipeline4. For the skeletonization step, GM maps are utilized to identify the cortex. The standard NODDI-GBSS and the herein introduced MT-CSD GBSS differ in how they define these GM maps (Fig. 1). For the surface-based approach, the dMRI data was instead registered to a T1w volume acquired during the same session. Surface projections of the dMRI maps were obtained using FreeSurfer routines.
Cortical microstructural properties were compared between three groups along the AD spectrum. Participants comprised unimpaired elderly and patients with mild cognitive impairment from the Swedish BioFINDER-2 study. These were stratified into Aβ-negative/tau-negative (N=237), Aβ-positive/tau-negative (N=129), and Aβ-positive/tau-positive (N=70) accordingly to Aβ- and tau-PET uptake16. A region-based comparison was employed by extracting the median values of 34 bilateral cortical regions (defined by the Desikan-Killiany-Tourville atlas). Statistical significance was set at the False Discovery Rate (FDR) threshold of 0.05, employing the Benjamini-Hochberg procedure.
Results & Discussion
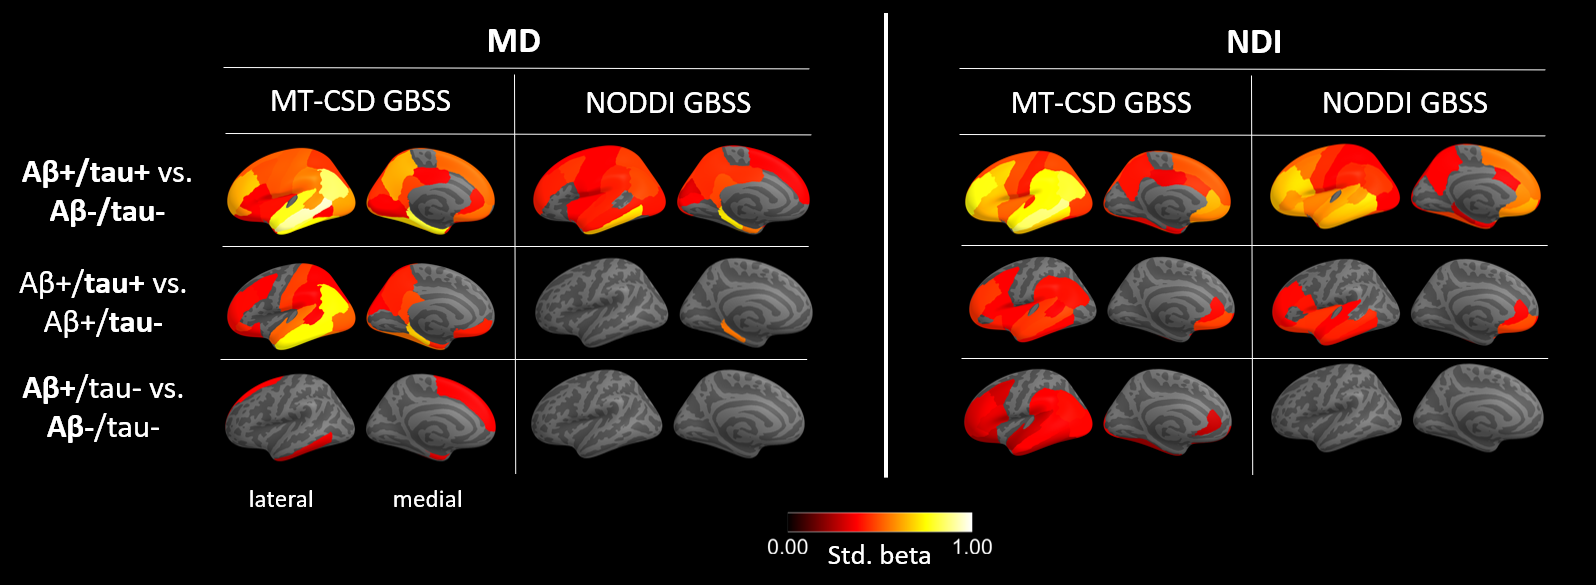
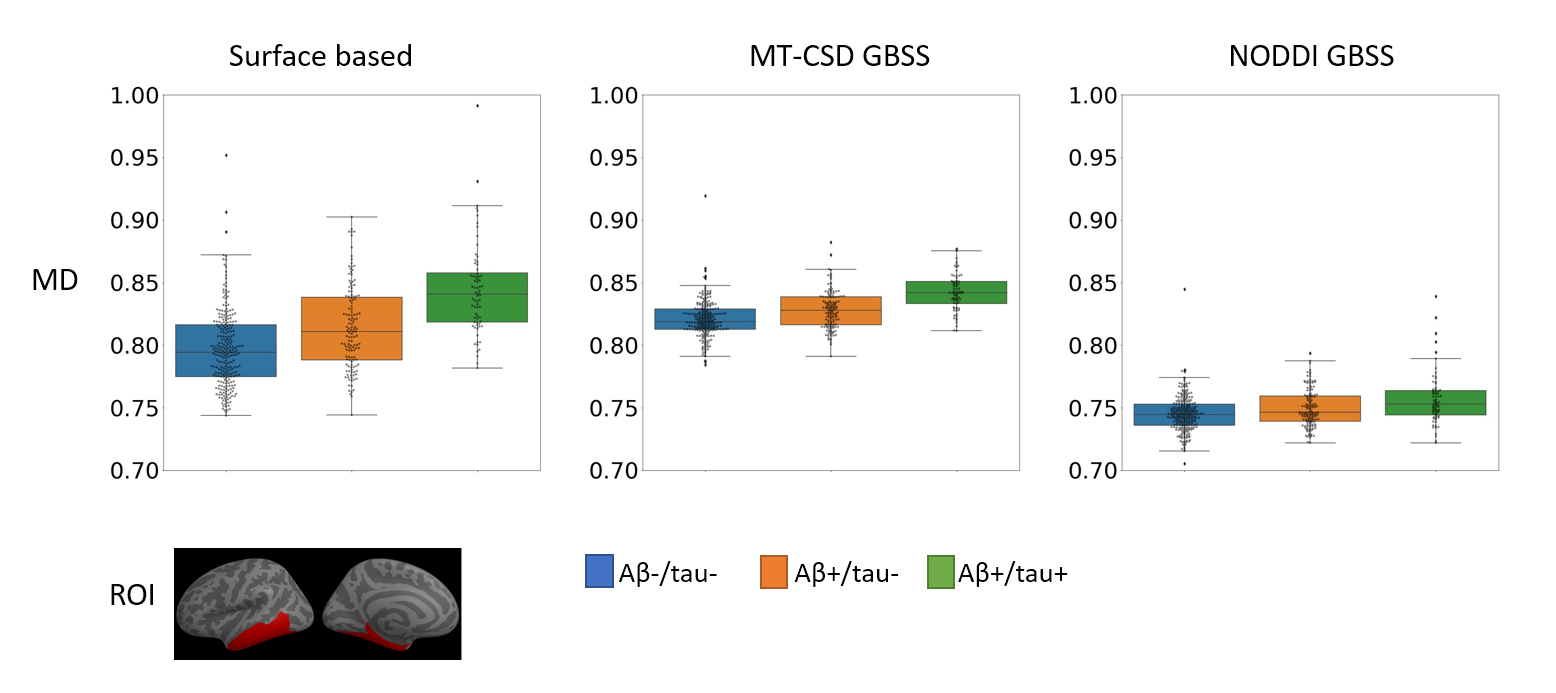
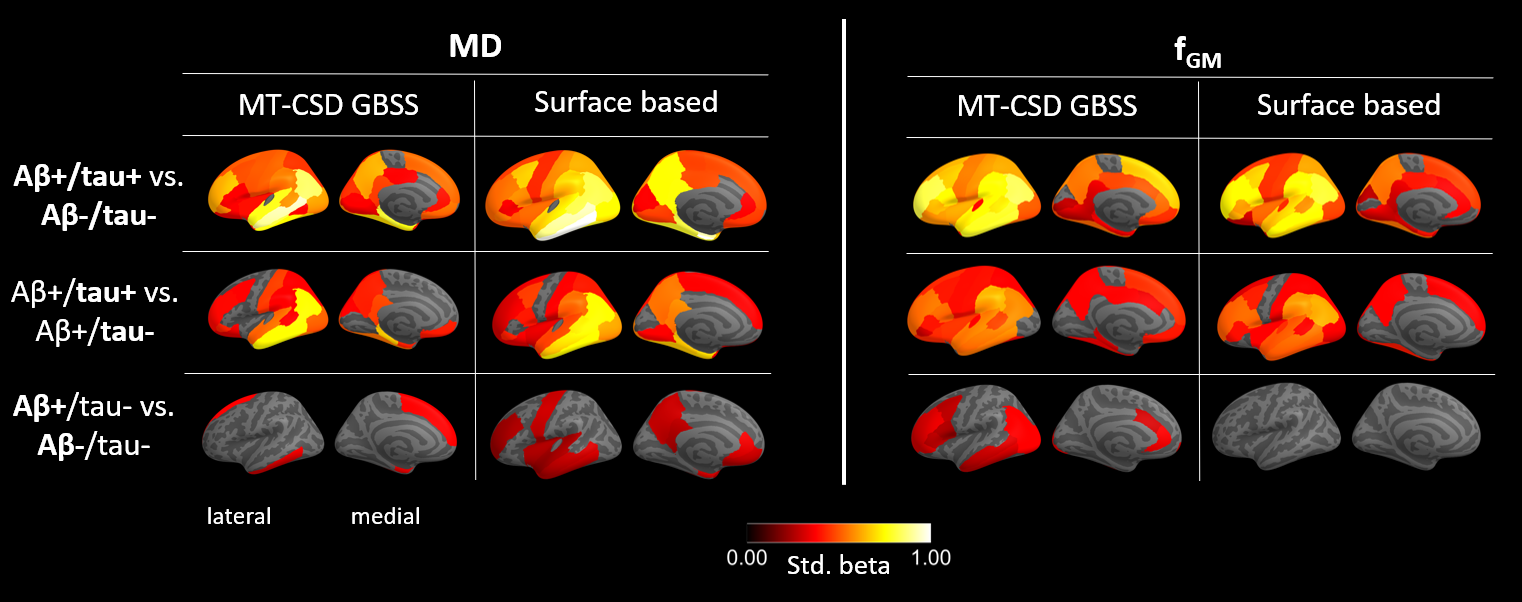
For the comparison of MT-CSD GBSS with NODDI-GBSS, we focused on MD and NDI, as the metrics most commonly used in previous studies based on the GBSS approach5,6. In all group comparisons, more extensive changes in cortical diffusion were found with MT-CSD GBSS compared to NODDI-GBSS (Fig. 2). The spatial distribution of these changes was consistent with the pathological process17–19 suggesting an improvement over the NODDI-GBSS in terms of sensitivity. The cortical MD values were consistently lower for NODDI-GBSS (0.7-0.8 mm2/s) compared to MT-CSD GBSS (0.8-0.9 mm2/s), indicating NODDI-GBSS might sample MD values closer to white matter while MT-CSD GBSS samples more centrally in the cortex (Fig. 3).A comparison of the MT-CSD GBSS approach and the surface-based approach is shown in Fig. 4 for the MD and the gray matter fraction (fGM) derived from MT-CSD. The two methods showed similar results when comparing the Aβ+/tau+ group with the Aβ-/tau- and Aβ+/tau- groups. However, in the comparison targeting early Aβ-related microstructural alterations (Aβ+/tau- vs. Aβ-/tau-), the two methods differed (Fig. 4 bottom row). The surface-based method detected more extensive changes in MD, while MT-CSD GBSS revealed more widespread differences in fGM. This difference in MD could potentially be explained by the higher variance in MD values extracted with the surface-based method compared to MT-CSD GBSS, suggesting a significant role played by partial volume effects (Fig. 3).
Conclusion
We compared three methods for probing gray matter microstructure in AD. Results showed that the MT-CSD GBSS approach, introduced in this work, and the surface-based approach were far more sensitive than the NODDI-GBSS in capturing statistically significant differences in dMRI metrics. Critically, the spatial distribution of the results was compatible with the known patterns of Aβ and tau accumulation, the hallmark of AD17–19. MT-CSD GBSS and the surface-based method only differ in the sensitivity to early Aβ-related changes, where effect sizes are relatively low. This highlights that caution is needed when interpreting results approaching the lower bound of statistical significance. Further work is needed to characterize both the methodological and biological underpinning of differences between MT-CSD GBSS and the surface-based method in these extreme cases.Acknowledgements
This work was supported by the Swedish Research Council - 2020-04549.References
1. Weston, P. S. J., Simpson, I. J. A., Ryan, N. S., Ourselin, S. & Fox, N. C. Diffusion imaging changes in grey matter in Alzheimer’s disease: A potential marker of early neurodegeneration. Alzheimer’s Research and Therapy vol. 7 1–8 Preprint at https://doi.org/10.1186/s13195-015-0132-3 (2015).
2. Montal, V. et al. Cortical microstructural changes along the Alzheimer’s disease continuum. Alzheimer’s and Dementia 14, 340–351 (2018).
3. Rodriguez-Vieitez, E. et al. Association of cortical microstructure with amyloid-β and tau: impact on cognitive decline, neurodegeneration, and clinical progression in older adults. Mol Psychiatry 1–10 (2021) doi:10.1038/s41380-021-01290-z.
4. Ball, G. et al. Development of cortical microstructure in the preterm human brain. Proc Natl Acad Sci U S A 110, 9541–9546 (2013).
5. Vogt, N. M. et al. Cortical Microstructural Alterations in Mild Cognitive Impairment and Alzheimer’s Disease Dementia. Cerebral Cortex 30, 2948–2960 (2020).
6. Vogt, N. M. et al. Interaction of amyloid and tau on cortical microstructure in cognitively unimpaired adults. Alzheimer’s & Dementia 18, 65–76 (2022).
7. Nazeri, A. et al. Functional consequences of neurite orientation dispersion and density in humans across the adult lifespan. Journal of Neuroscience 35, 1753–1762 (2015).
8. Nazeri, A. et al. Gray Matter Neuritic Microstructure Deficits in Schizophrenia and Bipolar Disorder. Biol Psychiatry 82, 726–736 (2017).
9. Veraart, J., Fieremans, E. & Novikov, D. S. Diffusion MRI noise mapping using random matrix theory. Magn Reson Med 76, 1582–1593 (2016).
10. Kellner, E., Dhital, B., Kiselev, V. G. & Reisert, M. Gibbs-ringing artifact removal based on local subvoxel-shifts. Magn Reson Med 76, 1574–1581 (2016).
11. Andersson, J. L. R., Skare, S. & Ashburner, J. How to correct susceptibility distortions in spin-echo echo-planar images: application to diffusion tensor imaging. Neuroimage 20, 870–888 (2003).
12. Andersson, J. L. R., Graham, M. S., Zsoldos, E. & Sotiropoulos, S. N. Incorporating outlier detection and replacement into a non-parametric framework for movement and distortion correction of diffusion MR images. Neuroimage 141, 556–572 (2016).
13. Tustison, N. J. et al. N4ITK: Improved N3 bias correction. IEEE Trans Med Imaging 29, 1310–1320 (2010).
14. Zhang, H., Schneider, T., Wheeler-Kingshott, C. A. & Alexander, D. C. NODDI: Practical in vivo neurite orientation dispersion and density imaging of the human brain. Neuroimage 61, 1000–1016 (2012).
15. Jeurissen, B., Tournier, J. D., Dhollander, T., Connelly, A. & Sijbers, J. Multi-tissue constrained spherical deconvolution for improved analysis of multi-shell diffusion MRI data. Neuroimage 103, 411–426 (2014).
16. Jack, C. R. et al. NIA-AA Research Framework: Toward a biological definition of Alzheimer’s disease. Alzheimers Dement 14, 535–562 (2018).
17. Hansson, O. Biomarkers for neurodegenerative diseases. Nature Medicine vol. 27 954–963 Preprint at https://doi.org/10.1038/s41591-021-01382-x (2021).
18. Cho, H. et al. In vivo cortical spreading pattern of tau and amyloid in the Alzheimer disease spectrum. Ann Neurol 80, 247–258 (2016).
19. Mattsson, N., Palmqvist, S., Stomrud, E., Vogel, J. & Hansson, O. Staging β-amyloid pathology with amyloid positron emission tomography. jamanetwork.com 76, 1319–1329 (2019).
Figures