4154
Revealing signatures of demyelination and axonal loss in white matter extra-axonal space using time dependent diffusion1Radiology, NYU Grossman School of Medicine, New York, NY, United States, 2Radiology, Massachusetts General Hospital, Harvard Medical School, Boston, MA, United States
Synopsis
Keywords: Microstructure, Simulations
In this work, we relate a specific feature of brain microstructure, the axon packing correlation length $$$l_c$$$, with parameters of time-dependent diffusion $$$D(t)$$$ obtained from Monte Carlo simulations. We observe that diffusion correlation length estimated from $$$D(t)$$$ shows good correspondence with $$$l_c$$$ estimated from geometries of packed disks with several densities, simple models for axon loss and demyelination, as well as for realistic substrates obtained from segmented electron microscopy.Introduction
Time-dependence of the diffusion coefficient $$$D(t)$$$ reveals sensitivity to brain microstructure1-8. By means of Monte Carlo (MC) simulations, $$$D(t)$$$ has been shown to provide information about structural changes caused by pathological conditions, such as beading8,9, axon loss10-12, demyelination10-13, and inflammation14. Here, using MC simulations in geometries of packed disks with different densities, realistic substrates from segmented electron microscopy, and for simple models10,11 of axonal loss and demyelination, we show that changes in the structural geometry, particularly, in the axonal packing correlation length, can be characterized using $$$D(t)$$$ transverse to axons packed in an aligned bundle.Theory
The relation between $$$D(t)$$$ and structure has been established15,16 via the medium’s density correlation function $$$\Gamma(x)$$$, a key geometric characteristic17. There still remains a challenge to relate specific features of $$$\Gamma(x)$$$ to signatures of $$$D(t)$$$. Here we focus on a workable definition of the structure correlation length – roughly, the width of $$$\Gamma(x)$$$ – such that it can be determined from measured $$$D(t)$$$. For that, we define $$$\Gamma(x)=\langle(x_0)n(x_0-x)\rangle$$$ via an area-weighted density $$$\sum\pi r^2_j\delta(x-x_j)$$$ of disk centers, and suggest to determine the structure correlation length $$$l_c=\sqrt{c_2}$$$ from the curvature of its power spectrum (Fourier transform) $$$\Gamma(k)$$$ at small $$$k$$$:$$\Gamma(k)=c_0+c_2k^2+c_4k^4+...\qquad(1)$$
For the extra-axonal space (EAS), $$$D(t)$$$ transverse to the axons has the form18
$$D(t)\simeq D_{\infty}+A\frac{\ln(t/t_c)}{t}, t>>t_c, \qquad(2)$$
which suggests the sensitivity to the correlation time $$$t_c=l_c^2/4D_{\infty}$$$ and, thereby, to $$$l_c$$$ (here $$$D_{\infty}$$$ is the tortuosity limit and $$$A\propto c_0$$$ is the strength of the restrictions, related to $$$c_0=\Gamma(k)|_{k\rightarrow 0}$$$). However, $$$t_c$$$ only enters under the logarithm, which could mean that $$$D(t)$$$ is only weakly sensitive to $$$t_c$$$. Hence, we also consider an equivalent way to determine $$$t_c$$$ via the instantaneous diffusion coefficient16
$$D_{\text{inst}}(t)=\frac{d(tD(t))}{dt}=D_{\infty}+A\frac{1}{t}+B\frac{1}{t^2}+...,\qquad(3)$$,
as the time scale at which the power-law tail becomes dominant and the (and higher order) corrections negligible: $$$t_c^{(\text{inst})}=|B/A|$$$.
Methods
Substrate generation: Geometries of randomly packed disks (parallel cylinders in cross-section) with fractions from 0.4 to 0.8 (EAS fractions from 0.6 to 0.2) were generated19 starting from lowest disk density (packing in Fig. 1a). Disks diameters followed the distribution for axons in human corpus callosum20, and the number of disks varied from $$$3\times10^4$$$ for the higher density to $$$1.5\times10^4$$$ for the lower density, keeping the substrate size constant to $$$397\times397$$$ $$$\mu$$$m2. To decrease mesoscopic fluctuations, each substrate was generated 20 times with different initializations.Models for axon loss and demyelination: from the generated disk packings at highest fraction 0.8, we simulate axon loss by randomly removing disks, yielding substrates with EAS from 0.2 to 0.6; and demyelination, by shrinking the outer disk diameter, yielding substrates with axon g-ratio from 0.60 to 0.85 (EAS from 0.2 to 0.6, assuming initial g-ratio21,22 of 0.60).
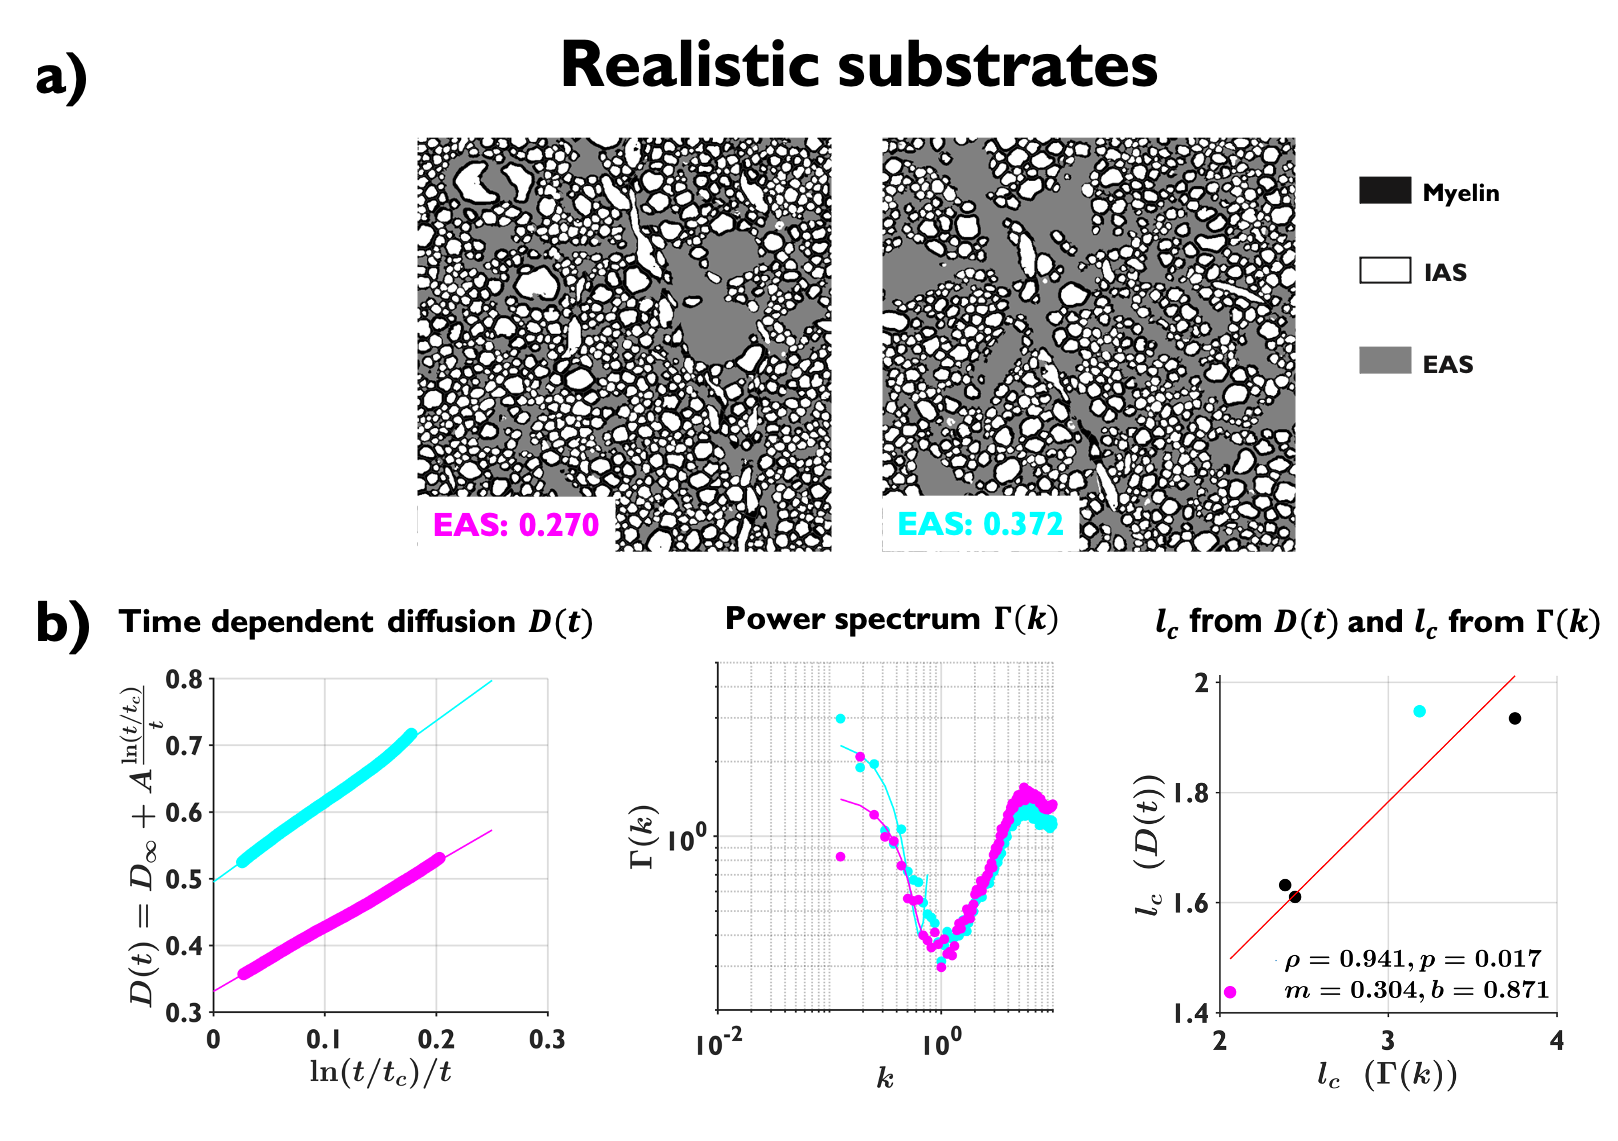
Realistic substrates: from segmented electron microscopy23 of normal rat brain cingulum, we created 60 realistic 2D substrates with EAS ranging from 0.27 to 0.37, with size $$$100\times100$$$ $$$\mu$$$m2. In order to decrease mesoscopic fluctuations, we averaged $$$D(t)$$$ and $$$\Gamma(k)$$$ on substrates with similar EAS.
Monte Carlo simulations in EAS24: MC simulations on each substrates of disks were performed with $$$1\times10^7$$$ random walkers with time step $$$4.15\times10^{-6}$$$ ms (step length 5.8 nm). For realistic substrates, MC simulations were performed with $$$1\times10^6$$$ random walkers with time step $$$2.7\times10^{-5}$$$ ms (step length 18 nm). For all cases, $$$D_0=D(t)|_{t=0}=2$$$ ms/mm2 and total diffusion time of 175 ms.
Results
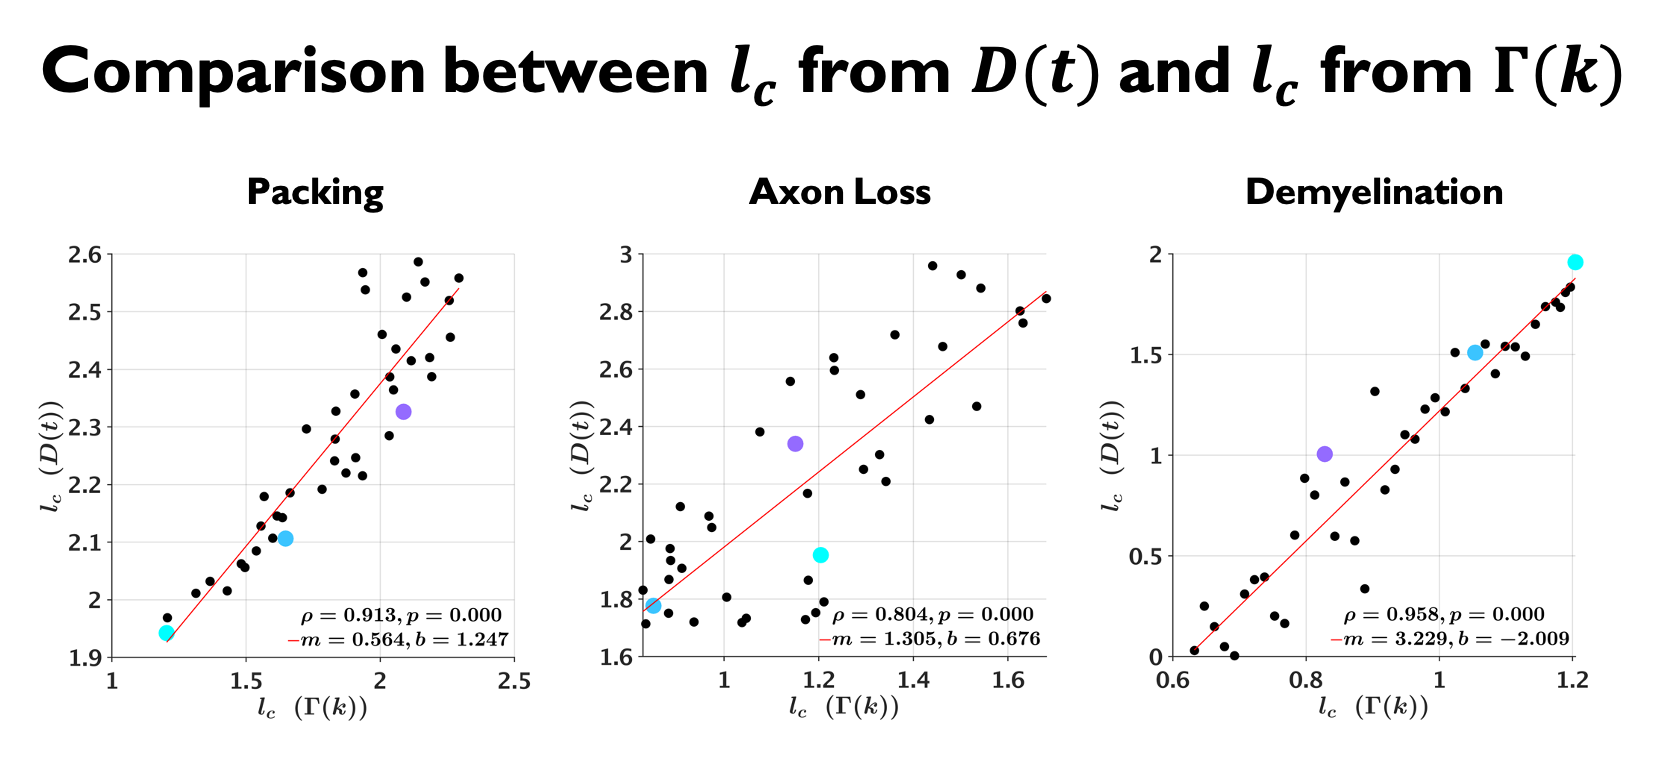
Examples of the substrates generated for packing, axon loss and demyelination are shown in Fig. 1a. Fig. 1b shows the fits (black lines) of Eq. (2) (top) and Eq. (3) (bottom), respectively, to $$$D(t)$$$ and $$$D_{\text{inst}}(t)$$$ obtained from MC simulations in the substrates of Fig. 1a. Fig. 2a shows the fits (black lines) of Eq. (1) at small $$$k$$$ for power spectra $$$\Gamma(k)$$$ (as defined above) from different substrates. The dependence of the structural parameters of interest on EAS fraction is shown in Fig. 2b: on the left, $$$c_0$$$ from Eq. (1); and on the right, the structure correlation length $$$l_c=\sqrt{c_2}$$$. We now relate these geometric characteristics to either the cumulative $$$D(t)$$$ or the instantaneous $$$D_{\text{inst}}(t)$$$. By fitting Eq. (2) to $$$D(t)$$$ and Eq.(3) to $$$D_{\text{inst}}(t)$$$ for all the substrates (all densities, all conditions), the parameters of interest are plotted against EAS fraction in Fig. 3a. As previously shown10-12, parameters can differentiate between tissue conditions. Of particular interest, the diffusion correlation length $$$l_c$$$ estimated from $$$D(t)$$$, and $$$l_c$$$ estimated from $$$D_{\text{inst}}(t)$$$, show a similar trend as the structure correlation length $$$l_c$$$ computed from $$$\Gamma(k)$$$ in Fig. 2b. There is significant agreement ($$$p<10^{-6}$$$) between parameters estimated from $$$D(t)$$$ and $$$D_{\text{inst}}$$$ (Fig. 3b). Fig. 4 shows an excellent correspondence between the correlation length estimated from $$$D(t)$$$ to that from the density correlation function $$$\Gamma(x)$$$, establishing the sensitivity to structure. Finally, in Fig. 5, using the described approach in realistic substrates, we also observe a good correspondence between $$$l_c$$$ from $$$D(t)$$$ and $$$l_c$$$ from $$$\Gamma(k)$$$.Conclusions
We established ways to determine the structural correlation length from the density correlation function $$$\Gamma(k)$$$ and from the time-dependent diffusion coefficient $$$D(t)$$$, and validated that they match for disk (axon) packings in a wide range of densities, for demyelination and axon loss, as well as for realistic EAS substrates obtained from segmented electron microscopy23,24.Acknowledgements
Research was supported by the National Institute of Neurological Disorders and Stroke of the NIH under awards R01 NS088040 and R21 NS081230,and by the Hirschl foundation, and was performed at the Center of Advanced Imaging Innovation and Research (CAI2R, www.cai2r.net), a Biomedical Technology Resource Center supported by NIBIB with the award P41 EB017183. H.H.L was supported by the Office of the Director of the NIH under award DP5 OD031854.
References
1 Mark A. Horsfield, Gareth J. Barker, W. Ian McDonald. Self-diffusion in CNS tissue by volume-selective proton NMR. Magn Reson Med. 1994;31:637-644.
2 Els Fieremans, Lauren M Burcaw, Hong-Hsi Lee, Gregory Lemberskiy, Belle Veraart, Dmitry S Novikov. In vivo observation and biophysical interpretation of time-dependent diffusion in human white matter. Neuroimage. 2016;129:414-427.
3 Hong-Hsi Lee, Antonios Papaioannou, Sung-Lyoung Kim, Dmitry S Novikov, Els Fieremans. In vivo observation and biophysical interpretation of time-dependent diffusion in human cortical gray matter. Neuroimage. 2020;222:117054
4 Corey A. Baron, Christian Beaulieu. Oscillating gradient spin-echo (OGSE) diffusion tensor imaging of the human brain. Magn Reson Med. 2014;72:726-736.
5 Manisha Aggarwal, Matthew D Smith, Peter A Calabresi. Diffusion-time dependence of diffusional kurtosis in the mouse brain. Magn Reson Med. 2020;84(3):1564-1578.
6 Jonas L. Olesen, Leif Ostergaard, Noam Shemesh, Sune N. Jespersen. Diffusion time dependence, power-law scaling, and exchange in gray matter. Neuroimage. 2021;251:118976.
7 Ileana O. Jelescu, Alexandre de Skowronski, Françoise Geffroy, Marco Palombo, Dmitry S.Novikov. Neurite Exchange Imaging (NEXI): A minimal model of diffusion in gray matter with inter-compartment water exchange. Neuroimage. 2022; 256:119277
8 Hong-Hsi Lee, Antonios Papaioannou, Sung-Lyoung Kim, Dmitry S Novikov, Els Fieremans. A time-dependent diffusion MRI signature of axon caliber variations and beading. Commun Biol. 2020;3(1):354.
9 Matthew D Budde, joseph A Frank. Neurite beading is suficient to decrease the apparent diffusion coeficient after ischemic stroke. Proc Natl Acad Sci. 2010;107(32):14472-7
10 E. Fieremans, j. H. jensen, j. Helpern, S. Kim, R. Grossman, M. Inglese, D. Novikov. Diffusion distinguishes between axonal loss and demyelination in brain white matter. Proc. Intl. Soc. Mag. Reson. Med. 2012.
11 D. S. Novikov, E. Fieremans. Relating extracellular diffusivity to cell size distribution and packing density as applied to white matter. Proc. Intl. Soc. Mag. Reson. Med. 2012
12 Ricardo Coronado-Leija, Hong-Hsi Lee, Els Fieremans, and Dmitry S. Novikov. Characterizing time-dependent diffusion in the extra-axonal space of white matter for axon loss and demyelination. Proc. ISMRM 3402, 2021.
13 Ginsburger Kévin, Poupon Fabrice, Beaujoin Justine, Estournet Delphine, Matuschke Felix, Mangin jean-Francois, Axer Markus, Poupon Cyril. Improving the Realism of White Matter Numerical Phantoms: A Step toward a Better Understanding of the Influence of Structural Disorders in Di!usion MRI. Frontiers in Physics. 2018;6.
14 Doring, André Afzali, Maryam Kleban, Elena Kreis, Roland jones, Derek. Realistic simulations of diffusion MR spectroscopy: The effect of glial cell swelling on non-Gaussian and anomalous diffusion. Proc ISMRM 2021
15 Novikov DS & Kiselev VG. Effective medium theory of a diffusion-weighted signal. NMR Biomed. 2010; 23(7):682-97
16 Dmitry S Novikov, jens H jensen, joseph A Helpern, Els Fieremans. Revealing mesoscopic structural universality with diffusion. Proc Natl Acad Sci USA. 2014;111(14):5088-933.
17 Torquato S. Random Heterogeneous Materials. Springer-Verlag (2002)
18 Lauren M Burcaw, Els Fieremans, Dmitry S Novikov. Mesoscopic structure of neuronal tracts from time-dependent diffusion. Neuroimage. 2015;114:18-37.
19 A Donev, S Torquato, FH Stillinger. Neighbor list collision-driven molecular dynamics simulation for nonspherical hard particles. I. Algorithmic details. J Comp Physics. 2005; 202(2):737-764
20 F Aboitiz, A B Scheibel, R S Fisher, E Zaidel. Fiber composition of the human corpus callosum. Brain Res. 1992; 598(1-2):43-53
21 Hong-Hsi Lee, Katarina Yaros, Belle Veraart, jasmine L Pathan, Feng-Xia Liang, Sungheon G Kim, Dmitry S Novikov, Els Fieremans. Along-axon diameter variation and axonal orientation dispersion revealed with 3D electron microscopy: implications for quantifying brain white matter microstructure with histology and diffusion MRI. Brain Struct Funct. 2019;224(4):1 469-1 488.
22 Ali Abdollahzadeh, IIya Belevich, Eija jokitalo, jussi Tohka, Alejandra Sierra. Automated 3D Axonal Morphometry of White Matter. Sci Rep. 2019;9(1):6084.
23 Ali Abdollahzadeh, IIya Belevich, Eija jokitalo, Alejandra Sierra, jussi Tohka. DeepACSON automated segmentation of white matter in 3D electron microscopy. Commun Biol. 2021;4(1):179.
24 Hong-Hsi Lee, Els Fieremans, Dmitry S Novikov. Realistic Microstructure Simulator (RMS): Monte Carlo simulations of diffusion in three- dimensional cell segmentations of microscopy images. J Neurosci Methods. 2021;350:109018.
Figures
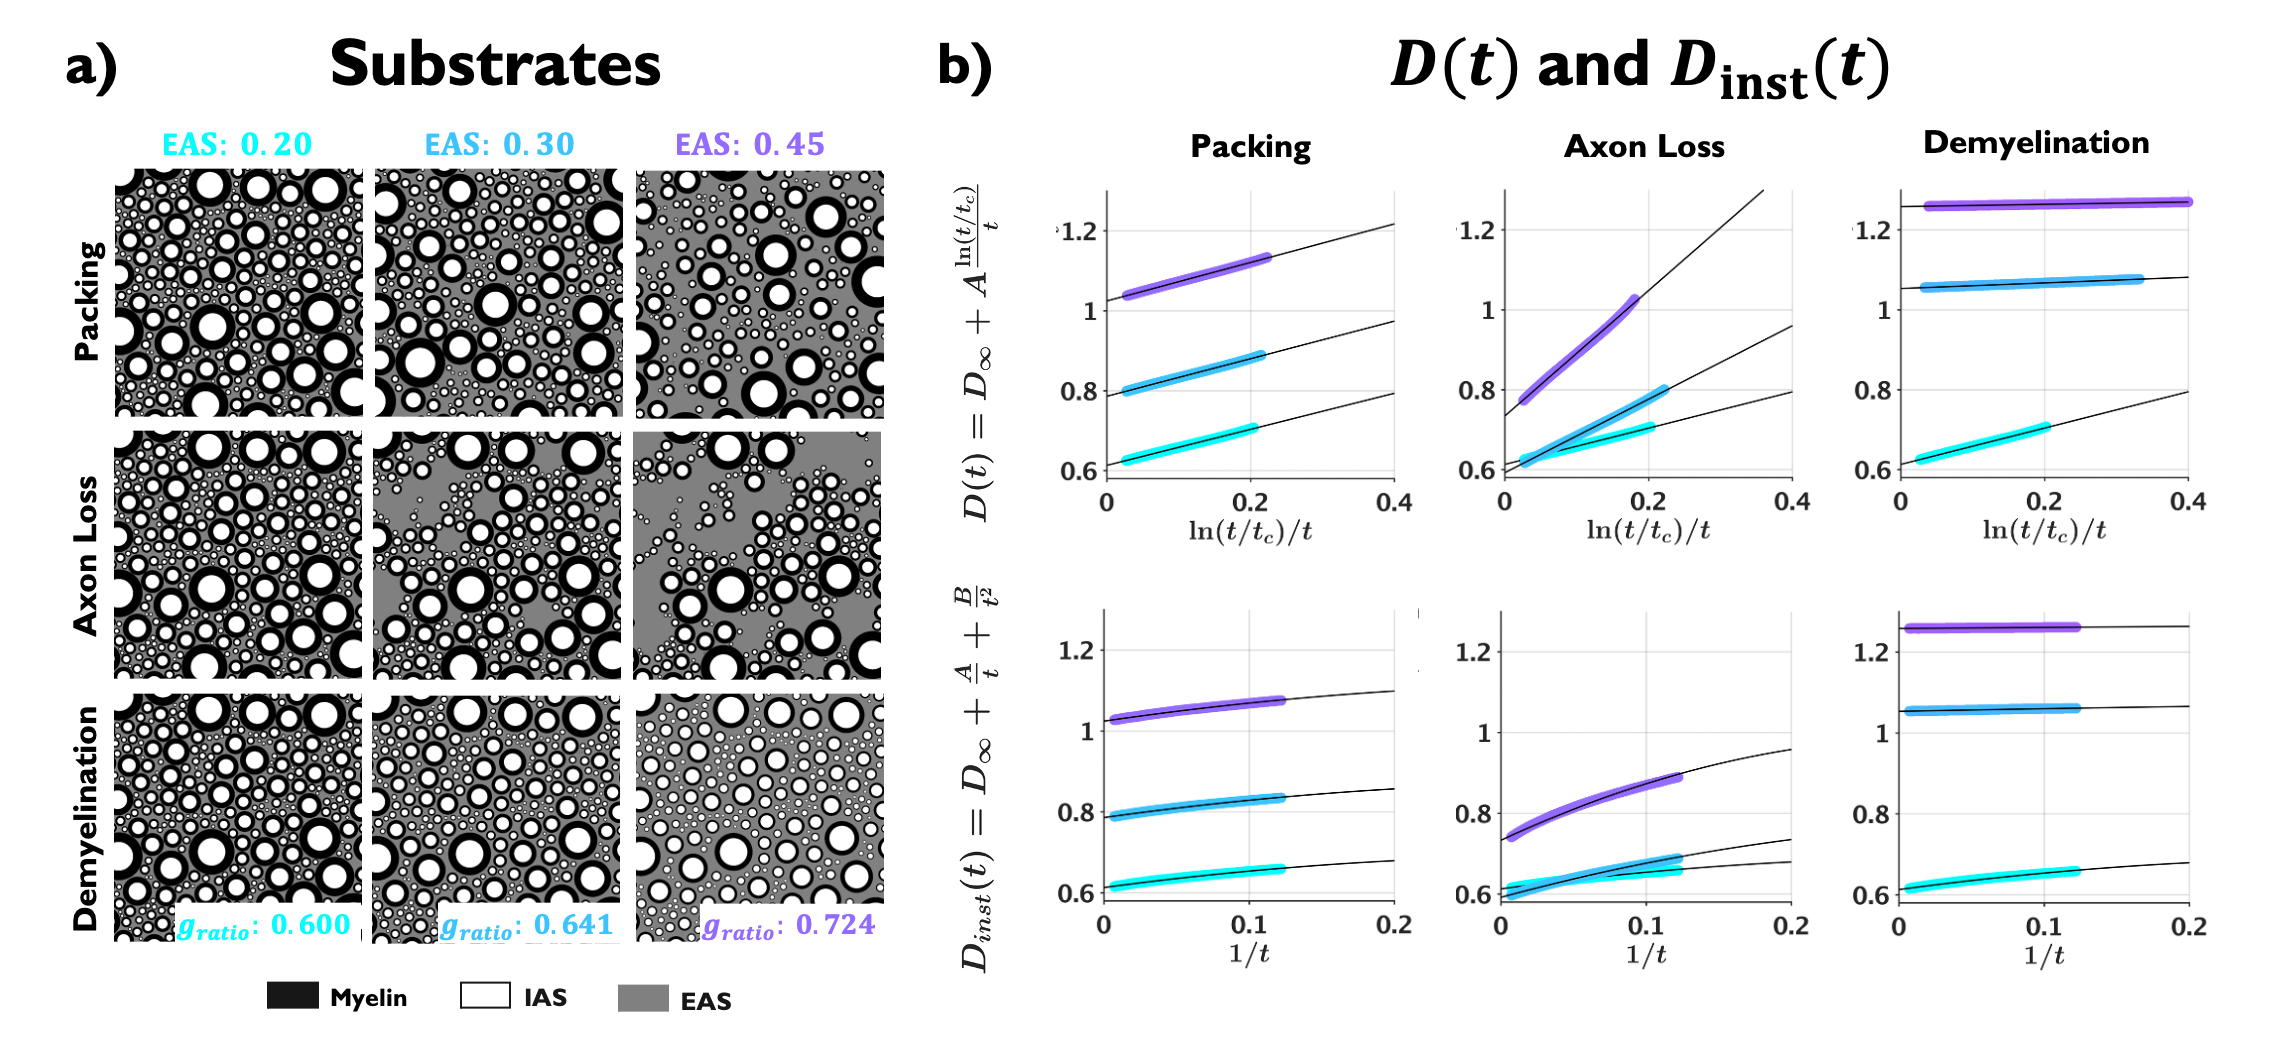
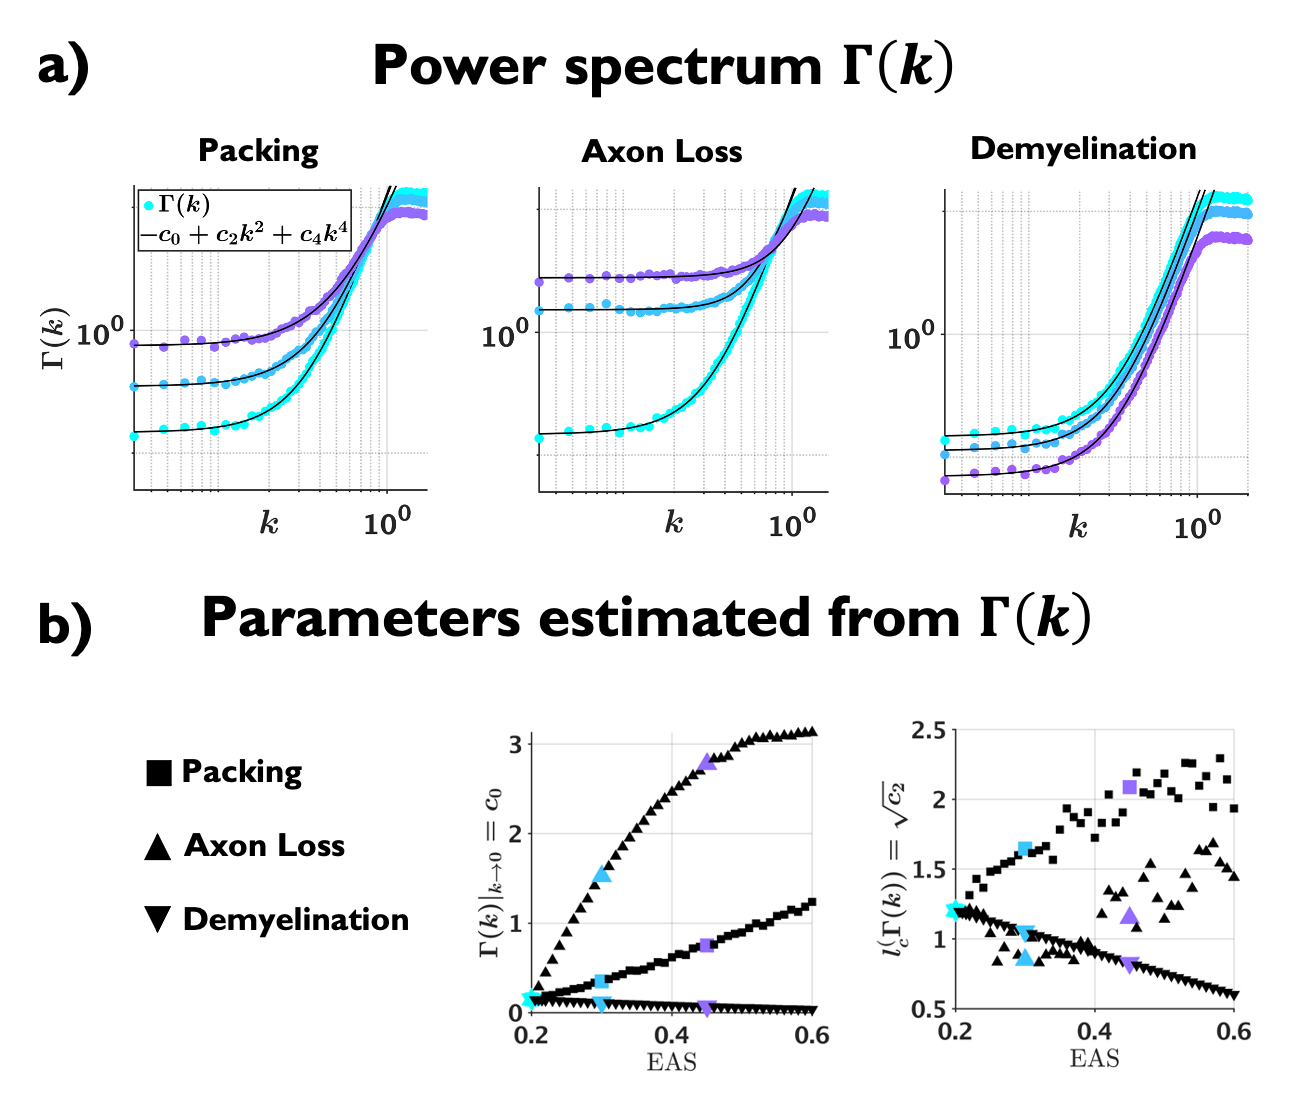
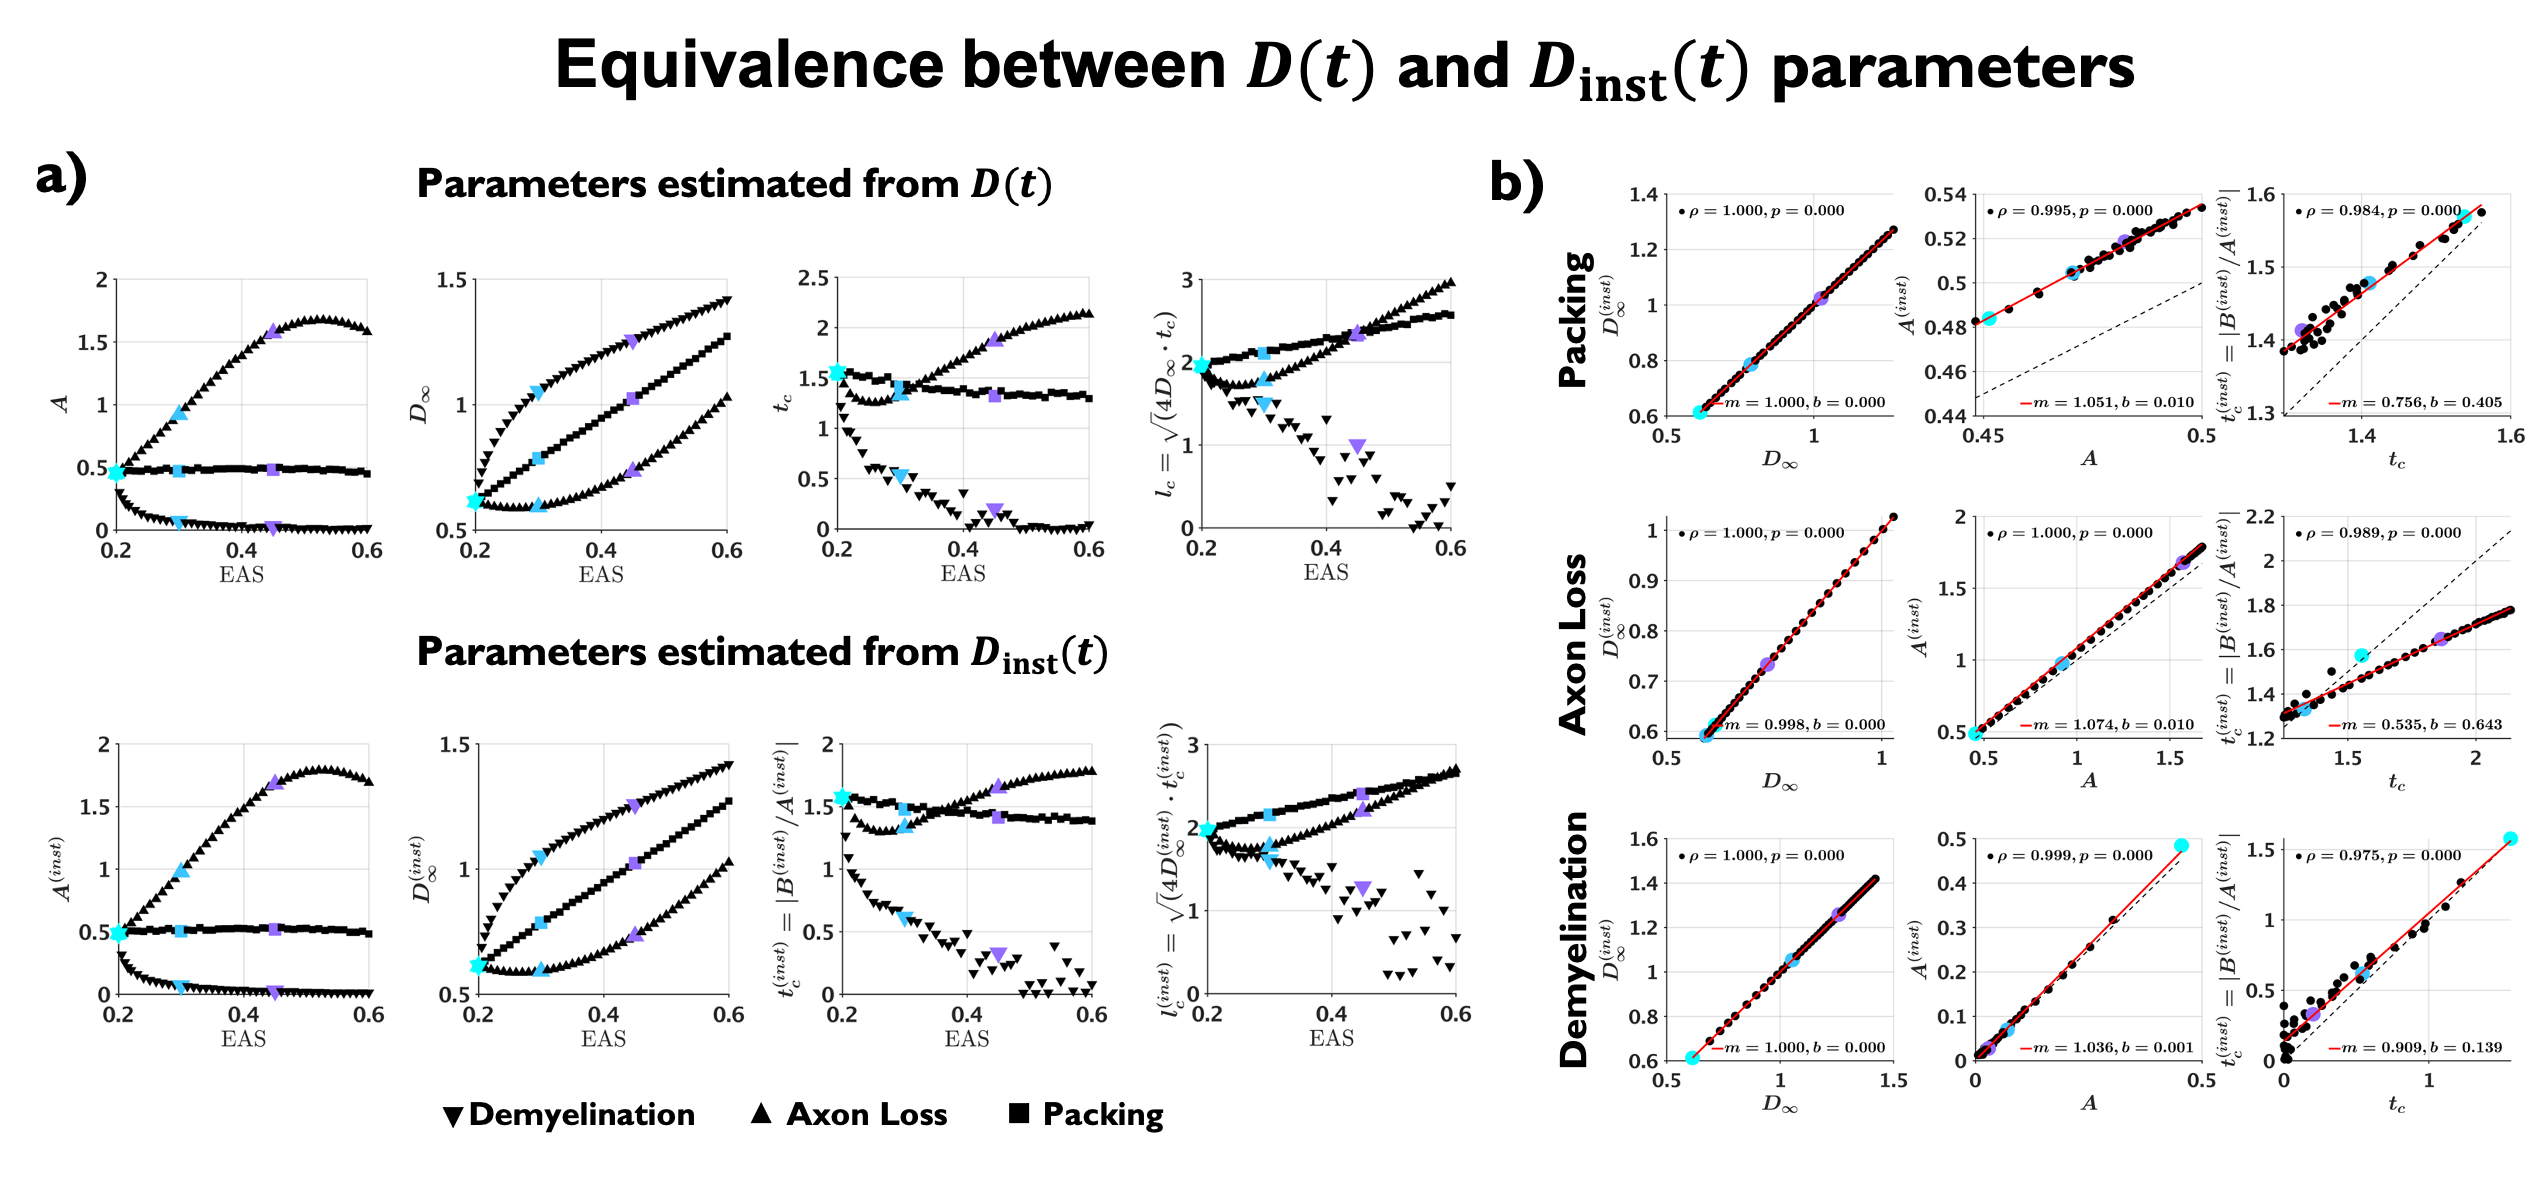
Fig 3. (a) Parameters estimated from $$$D(t)$$$ (top) and $$$D_{\text{inst}}(t)$$$ (bottom) plotted against EAS fraction. Note that parameters can differentiate between conditions with same EAS fraction, and that diffusion correlation length $$$l_c$$$ estimated from $$$D(t)$$$, shows similar trend as structure correlation length $$$l_c$$$ estimated from $$$\Gamma(k)$$$ in Fig. 2b. (b) Statistically significant agreement ($$$p<10^{-6}$$$) is observed between the estimated parameters from $$$D(t)$$$ and $$$D_{\text{inst}}(t)$$$, proving their equivalence.