4153
Evaluating histotripsy treatment dosage in the brain using MRI
Dinank Gupta1, Tarana P Kaovasia1, Dave Choi1, Steven P Allen2, Timothy L Hall1, Zhen Xu1, and Douglas C Noll1
1Biomedical Engineering, University of Michigan, Ann Arbor, MI, United States, 2Brigham Young University, Provo, UT, United States
1Biomedical Engineering, University of Michigan, Ann Arbor, MI, United States, 2Brigham Young University, Provo, UT, United States
Synopsis
Keywords: Diffusion/other diffusion imaging techniques, Focused Ultrasound, Histotripsy
Histotripsy is a non-invasive, non-thermal focused ultrasound ablation method that mechanically breaks down the target tissue into acellular debris and has shown promising results for brain surgery. Quantifying histotripsy treatment dosage is required to avoid over/under-treatment of the target region. In this work, we assess whether T1, T2 and ADC maps can be utilized to quantify the ablation effect generated by varying histotripsy dosage post-treatment using an ex-vivo bovine brain. We show that only the ADC map is able to visualize the histotripsy ablation. Increasing histotripsy dosage results in increasing ADC.Introduction
Brain surgery typically involves either a craniotomy or radiation therapy, both of which require invasive procedures and/or exposure to ionizing radiation [1,2]. Transcranial MR-guided Focused Ultrasound (tcMRgFUS) has been used to generate thermal ablation in the brain tissues noninvasively and is used clinically for the treatment of essential tremor [3] and Parkinson’s disease, but the treatment location of tcMRgFUS is limited to the center region of the brain due to overheating of the skull [4]. Transcranial histotripsy has been shown to noninvasively treat a wide range of locations in the brain by using a low-duty cycle sonication (<0.1%), without significant temperature increase to the skull [5]. tcMRgFUS thermal ablation utilizes MR thermometry to quantify the damage to the tissues [6]. Time series of MR-Thermometry images can be used to estimate a ‘thermal dose’ and can be used as a stopping criterion when sufficient thermal damage is delivered. In comparison to thermal damage, histotripsy mechanically disrupts the target tissue. The aim of this work is to establish MRI sequences that can be used to visualize and quantify histotripsy-induced damage. A previous study has shown that porcine liver, kidney, and muscle as well as bovine blood clot show changes in their Apparent Diffusion Coefficient (ADC) and T2 relaxation with varying dosages of histotripsy on a 7T animal scanner [7]. Our goal is to evaluate the changes in MRI parameters due to histotripsy in ex vivo bovine brain tissue on a 3T human scanner.Methods
All histotripsy experiments were performed on a transcranial 700 kHz, 360-element hemispherical ultrasound phased array with a focal radius of 15 cm (Figure 1). Bovine brains were obtained from a local abattoir and were degassed under vacuum and set in 1.5% agarose gel (Figure 1). Rectangular histotripsy lesion volumes of 10x10x5mm (corresponding to ~2200 treatment points/volume) were generated at an estimated peak negative pressure of 70MPa at the pulse repetition frequency (PRF) of 200Hz. A total of six histotripsy dosages were used by varying the number of pulses delivered to each treatment spot (1,5,10,15,20, and 30 pulses per location) Four lesions were generated for each dosage in two separate bovine brains, with 12 lesions per brain. Histology is pending, which will be used to evaluate the tissue damage. Post-histotripsy MRI scans were acquired to observe the changes in the tissue parameters due to histotripsy. T1 mapping was done by using variable flip angle spoiled gradient recalled echo (SPGR) with TE/TR: 5ms/8ms, flip angles: 5,10,15,20,30 degrees [8]. T2 mapping was performed using a vendor-provided T2 mapping pulse sequence and a monoexponential to the T2-decay curve was fit to estimate T2 values. The values of TEs for estimating the T2 map were: 6 ms,12 ms, 18.5 ms, 24.6 ms, 30.8 ms, 40 ms, 43 ms,, and 49.2 ms. To estimate the ADC, diffusion-weighted images (DWI) were acquired using b-values: 200,500,800,1000 and 1500 s/mm^2 (Figure 2). TOPUP was used for distortion correction and estimating voxel-wise ADC from the DWI scans[9].Results
Figure 3 shows T1, T2, and ADC maps of the histotripsy lesions. T1 and T2 maps are not able to visualize the lesions for any dose levels. In comparison, the ADC map can visualize the lesions and the sharp boundaries of the rectangular ablation zone are clearly visible. Although the lesions are visible, the signal within the lesions is heterogeneous. Due to the irregular shape of the brain, 2 of the 12 lesions were outside the tissue and were discarded from any further post-processing. Figure 4 plots the mean and standard deviation of ADC value (~150 voxels for each lesion) versus histotripsy dosage in both the bovine brain tissues. Increasing histotripsy dosage results in increasing mean ADC values, although the standard deviation of ADC is quite large. Similar trends of increasing ADC with increasing histotripsy dosage can be seen for both the treated bovine brains.Discussion
In this work, we have shown that ADC can be used to visualize histotripsy ablation. As increasing histotripsy dosage results in increasing ADC, we hypothesize that ADC can be used to quantify histotripsy-induced damage, which needs to be investigated by correlating with histological analysis in the future. While previous in-vivo brain studies have demonstrated that histotripsy ablation can be visualized on T2* and T2 weighted images, which showed the blood in the ablation zone rather than the mechanical cellular disruption generated by histotripsy. The ADC is highly variable within the lesion due to tissue heterogeneity. We will further investigate ADC and tissue damage with more tissue samples and histological analysis.Conclusion
Our initial results show that histotripsy ablation in the ex-vivo bovine brain can be visualized by ADC map. The mean ADC increases with increasing histotripsy dosage, however, it has a high standard deviation due to tissue heterogeneity. Histological analysis will be performed on these lesions. Histotripsy-induced damage evaluated histologically will be correlated with the ADC maps, to determine whether ADC can quantitatively evaluate histotripsy damage. Both T1 and T2 maps did not visualize the lesions for any tissue. This study examined only two brains and further investigation will be needed on more tissue samples to confirm the replicability of the results observed in the current work.Acknowledgements
This work is supported by NIH Grant R01EB28309References
[1] Lassen, B., Helseth, E., Rønning, P., Scheie, D., Johannesen, T. B., Mæhlen, J., Langmoen, I. A., & Meling, T. R. (2011). Surgical mortality at 30 days and complications leading to recraniotomy in 2630 consecutive craniotomies for intracranial tumors. Neurosurgery, 68(5), 1259–1268.[2] Greene-Schloesser, D., Robbins, M. E., Peiffer, A. M., Shaw, E. G., Wheeler, K. T., & Chan, M. D. (2012). Radiation-induced brain injury: A review. Frontiers in Oncology, 2(July), 1–18.[3] Lipsman, N., Schwartz, M. L., Huang, Y., Lee, L., Sankar, T., Chapman, M., Hynynen, K., & Lozano, A. M. (2013). MR-guided focused ultrasound thalamotomy for essential tremor: A proof-of-concept study. The Lancet Neurology, 12(5), 462–468.[4] Cohen-Inbar, O., Snell, J., Xu, Z., & Sheehan, J. (2016). What Holds Focused Ultrasound Back? World Neurosurgery, 91, 661–665.[5] Sukovich, J. R., Cain, C. A., Pandey, A. S., Chaudhary, N., Camelo-Piragua, S., Allen, S. P., Hall, T. L., Snell, J., Xu, Z., Cannata, J. M., Teofilovic, D., Bertolina, J. A., Kassell, N., & Xu, Z. (2019). In vivo histotripsy brain treatment. Journal of Neurosurgery, 131(4), 1331–1338.[6] Rieke, V., & Pauly, K. B. (2008). MR thermometry. Journal of Magnetic Resonance Imaging 27(2), 376–390.[7] Allen, S. P., Vlaisavljevich, E., Shi, J., Hernandez-Garcia, L., Cain, C. A., Xu, Z., & Hall, T. L. (2017). The response of MRI contrast parameters in in vitro tissues and tissue mimicking phantoms to fractionation by histotripsy. Physics in Medicine and Biology, 62(17), 7167–7180.[8] Blüml, S., Schad, L. R., Stepanow, B., & Lorenz, W. J. (1993). Spin‐lattice relaxation time measurement by means of a TurboFLASH technique. Magnetic Resonance in Medicine, 30(3), 289–295.[9] Andersson, J. L. R., Skare, S., & Ashburner, J. (2003). How to correct susceptibility distortions in spin-echo echo-planar images: Application to diffusion tensor imaging. NeuroImage, 20(2), 870–888.Figures
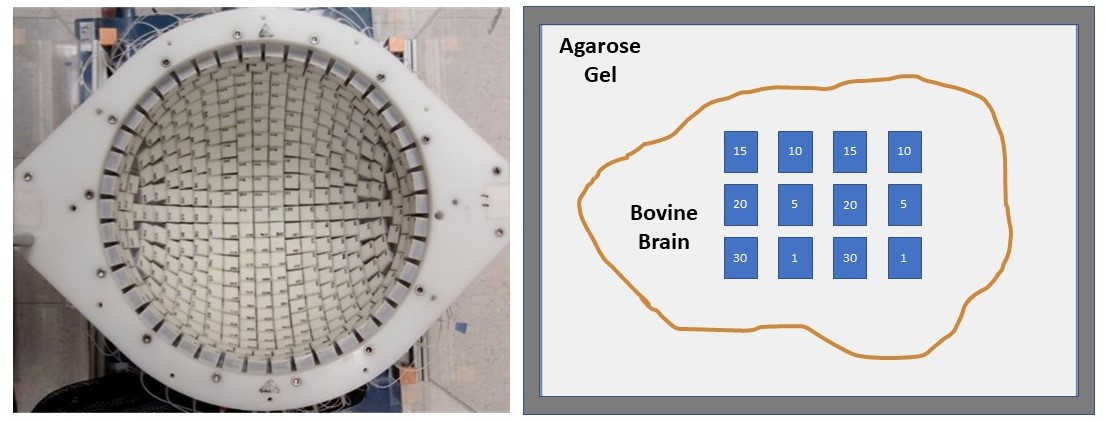
Figure 1: Left: Top view of the histotripsy treatment array. Right: Cartoon of the tissue block and treatment dosage plan. The intended treatment plan with 12 lesions with 6 different dosages, designated by the number in each block is marked.
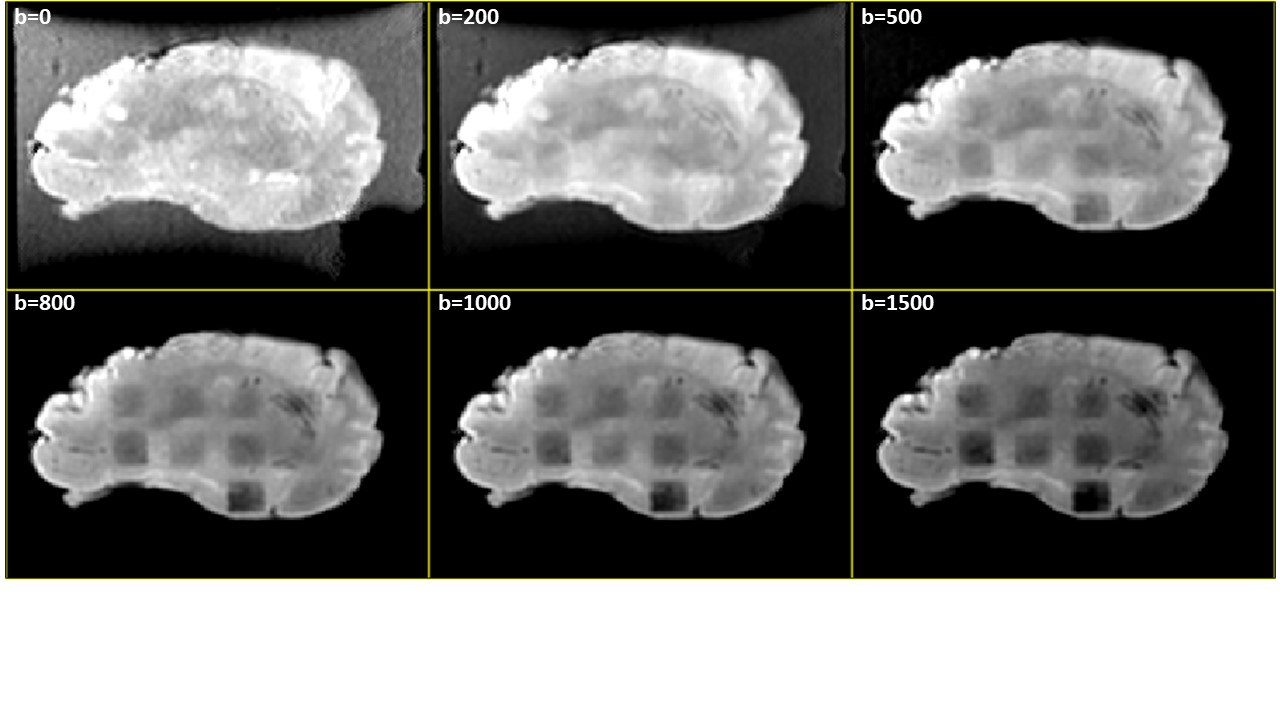
Figure 2: Lesion contrast to different DWI b-values (s/mm^2). Lesions with lower histotripsy dosage are visible clearly with higher b-values.
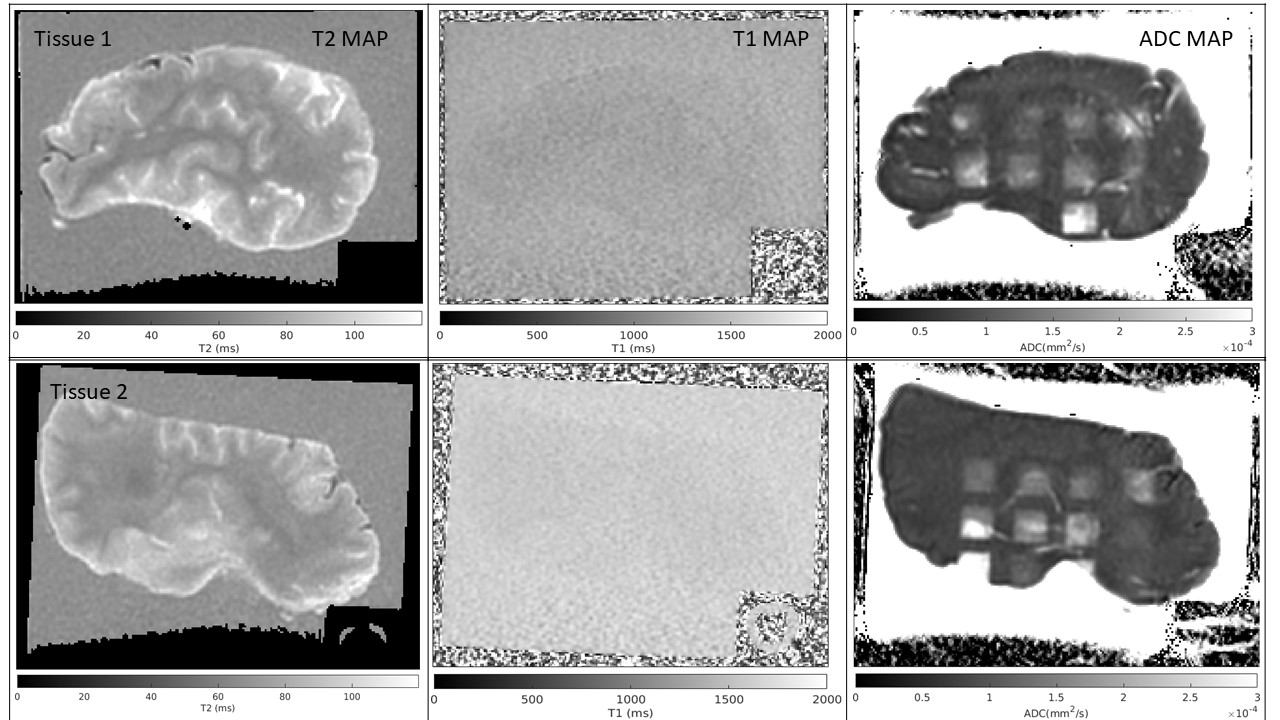
Figure 3: Left to right: T2 map, T1 map and ADC of the two tissues treated with dosage according to Figure 1. Only the ADC maps are able to visualize the lesions on both tissues.
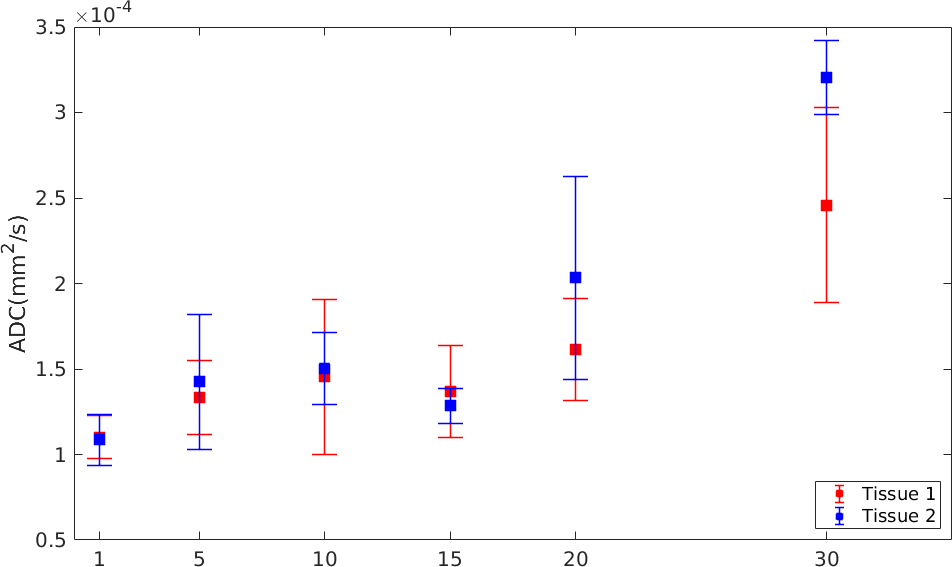
Figure 4: Mean and standard deviation of ADC for the lesions shown in Figure 3. The mean ADC increases with increasing dosage for both tissues.
DOI: https://doi.org/10.58530/2023/4153