4139
A preliminary comparison of multi-echo GraSE and T2 preparation-based myocardium T2 mapping1Department of Medical Imaging, Wuhan Asia General Hosipital, Wuhan, China, 2Philips Healthcare, Beijing, China
Synopsis
Keywords: Myocardium, Cardiovascular
T2 mapping is a quantitative technique for measuring T2 in tissues, which is gaining popularity in the MR community, particularly for the detection of cardiac edema. There are several representative T2 mapping methods, including GraSE and T2 preparation-based schemes. However, there is still a lack of clinical experience with these T2 mapping methods. In this study, we tentatively compared the GraSE-based and T2 preparation-based methods for myocardium imaging.Introduction
Cardiovascular magnetic resonance (MR) imaging (cardiac MR) is emerging as an effective noninvasive method for detecting myocardial edema1. Myocardial edema is typically characterized by elevated free water content and prolonged T2 values in the myocardium. The T2-weighted STIR method is currently the most commonly used clinical setting for myocardial edema, but it may be limited by several factors, such as phased-array coil-related signal inhomogeneity, motion-caused signal intensityvariation, interference from the high signal of stagnant blood, and et al.2. T2 mapping is a quantitative technique that can directly measure T2 in tissues and may have the potential benefits of improved diagnostic precision and robustness. T2 mapping schemes include multi-echo gradient and spin-echo (GraSE) based methods3 and T2 preparation-based methods4. There is still a lack of experience with these clinical settings. To evaluate the performance of these different T2 mapping methods, we compared multi-echo GraSE and T2 preparation-based T2 mapping of myocardium in three healthy volunteers.Materials and Methods
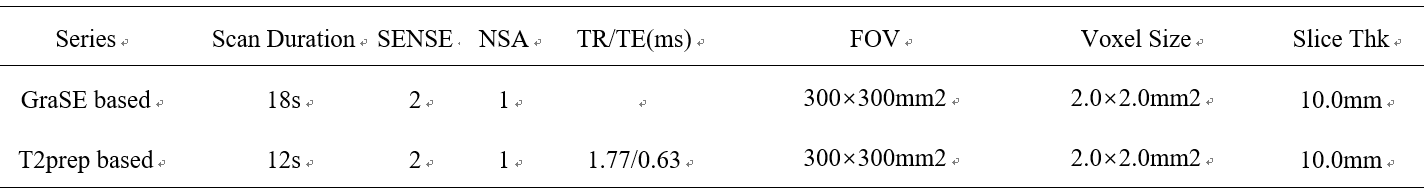
The institutional IRB approved this study. In this study, three healthy volunteers were recruited. Each subject was scanned using a 3.0T Elition system (Philips Healthcare, the Netherlands) with a 32-channel torso and spine coil for multi-echo GraSE and T2 preparation-based T2 mapping. The GraSE-based T2 mapping was carried out in a multi-echo fashion, in which a few k-space lines with different echo times (9 echoes) were acquired in each heartbeat and the entire k-space was filled over several heartbeats. The GraSE sequence was scanned in 18 seconds with a TSE factor of 9 and an EPI factor of 7. The T2 preparation-based method was designed in a completely different scheme, employing balanced turbo field echo (bTFE) as an acquisition technique with TFE factors of 92. The T2 preparation-based method was designed in a completely different scheme, employing balanced turbo field echo (bTFE) as an acquisition technique with TFE factors of 92. All of the k-space lines for a single image with a specific T2 preparation time were acquired in three heartbeats, and the T2 map was obtained by scanning several images with four T2 preparation times (0, 23.3, 46.6, and 70ms) in 12 heartbeats. Table 1 lists the other parameters of the two protocols. An experienced radiologist examined the acquired T2 mapping data (5 years). Each subject's myocardium was marked with three regions of interest (ROIs). The three ROIs were used to calculate the mean and standard deviation of myocardium T2 values. The Wilcoxon signed-rank test was used in Python 3.8 to compare the multi-echo GraSE and T2 preparation-based myocardium T2 mapping methods. To investigate the size and variation of the measured T2, the mean and standard deviation of myocardium T2 values were tested. A p-value less than 0.05 was deemed statistically significant.Results
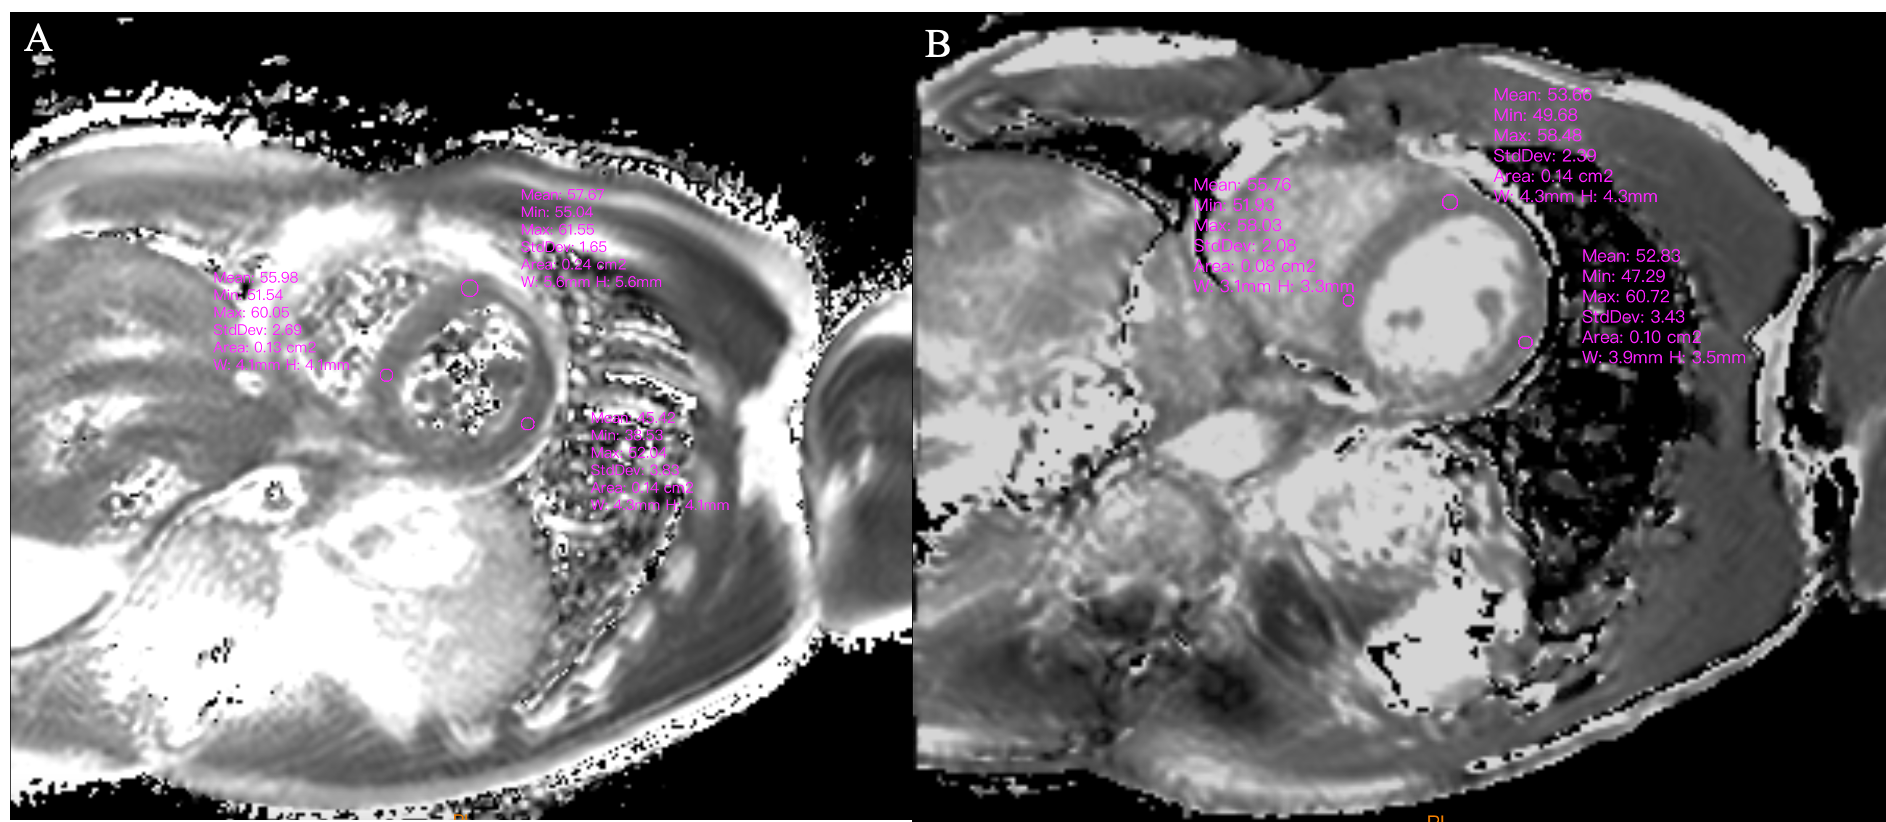
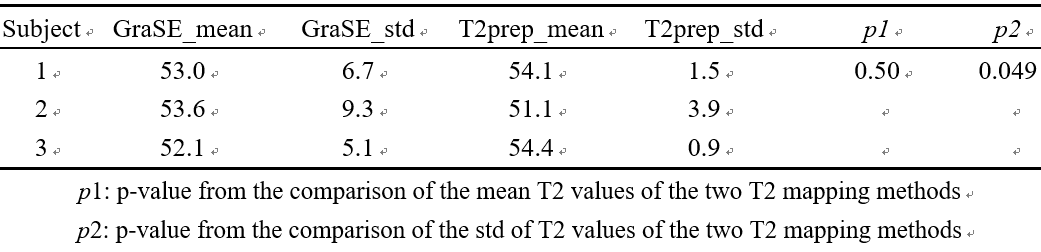
Table 2 shows the measured T2 values of the myocardium using the multi-echo GraSE and T2 preparation-based T2 mapping methods. The Wilcoxon signed-rank test revealed that the mean T2 values calculated from the three ROIs (Figure 1) were not statistically different between the two groups. In contrast, the standard deviation of T2 values in the myocardium differed statistically (p<0.05) between T2 mapping methods. The measurement variation was greater for the multi-echo GraSE-based T2 mapping method than for the T2 preparation-based method.Discussion and Conclusion
In this preliminary study, we discovered that the T2 preparation-based T2 mapping method produced T2 values of the myocardium that were comparable to the multi-echo GraSE-based counterpart, implying that both methods could be used to detect myocardial edema. Further analysis revealed that the T2 preparation-based T2 mapping scheme was more stable than the multi-echo GraSE-based T2 mapping method, with less variation in different regions of the myocardium, which could be attributed to the GraSE readout's sensitivity to susceptibility. However, the preliminary study's sample size is very small, and further research with a larger sample size is required because T2 mapping is gaining popularity.Acknowledgements
No other acknowledgement.References
1. McAlindon EJ, Pufulete M, Harris JM, Lawton CB, Moon JC, Manghat N, Hamilton MC, Weale PJ, Bucciarelli-Ducci C.Measurement of myocardium at risk with cardiovascular MR: comparison of techniques for edema imaging. Radiology,2015; 275(1): 61-70.
2. Giri S, Chung YC, Merchant A, Mihai G, Rajagopalan S, Raman SV, Simonetti OP. T2quantification for improved detection of myocardial edema. Journal of cardiovascularmagnetic resonance, 2009; 11: 56.
3. Sprinkart AM, Luetkens JA, Traber F, Doerner J, Gieseke J, Schnackenburg B, Schmitz G,Thomas D, Homsi R, Block W, Schild H, Naehle CP. Gradient Spin Echo (GraSE) imaging forfast myocardial T2 mapping. Journal of cardiovascular magnetic resonance, 2015; 17: 12.
4. Zhang S, Le TT, Kabus S, Su B, Hausenloy DJ, Cook SA, Chin CWL, Tan RS. Cardiac magneticresonance T1 and extracellular volume mapping with motion correction and co-registrationbased on fast elastic image registration. Magma, 2018; 31(1): 115-129.
Figures