4138
Cardiac magnetic resonance native T1 mapping assessed different CKD stages, a polit study
Yating Chen1, Di Tian1, Jingyu Zhang1, and Zhiyong Li1
1Department of radiology, The first affiliated hospital of dalian medical university, Dalian, China
1Department of radiology, The first affiliated hospital of dalian medical university, Dalian, China
Synopsis
Keywords: Myocardium, Cardiovascular, Chronic kidney disease,T1mapping, cardiac magnetic resonance
Chronic kidney disease (CKD) is a condition in which kidney damage or decreased kidney function persists for more than three months. Moreover, toxins inhibit myocardium leads to myocardial dysfunction and heart failure. T1 mapping, also known as longitudinal relaxation time quantitative imaging technology, is a new cardiac magnetic resonance (CMR) scanning technology, which can quantitatively evaluate myocardial T1 time and reflect changes in myocardial fibrosis.The purpose of this study is to analyze the difference and correlation between T1 value and CKD stage.Introduction
Chronic kidney disease(CKD) is a condition in which kidney damage or decreased kidney function persists for more than three months. The blood volume increases, the left ventricular end-diastolic volume, cardiac volume, and cardiac output increase, and the left ventricular function decreases and leads to heart failure when the function is not compensated in chronic renal failure. Moreover, toxins inhibit the myocardium leads to myocardial dysfunction and heart failure. T1 mapping is a new technique that can evaluate cardiac function well recently. T1 mapping, also known as longitudinal relaxation time quantitative imaging technology, is a new cardiac magnetic resonance (CMR) scanning technology, which can quantitatively evaluate myocardial T1 time (refers to the longitudinal relaxation time of myocardial tissue without contrast agent) and reflect changes in myocardial fibrosis [1]. Cardiac parameters are different in patients with different CKD stages.And different stages of CKD have different effects on the cardiovascular system. The purpose of this study is to analyze the difference and correlation between the T1 value and the CKD stage.Methods
In this study, 46 CKD patients(11 in CKD3, 7 in CKD4, and 28 in CKD5)from the First Affiliated Hospital of Dalian Medical University were recruited from June 2022 to October 2022, and CMR was performed on a 3.0-T scanner. Native T1 mapping was performed using a modified Look-Locker inversion-recovery sequence with 5(3)3 protocols at end-expiration in a plane covering the largest diameter of the cardiac mass. Cine sequences were obtained with the following acquisition parameters: TR= 2.1 ms; TE = 0.98 ms; slice thickness = 6 mm; FOV=300mm; Cardiac data including native T1 value were evaluated using CVI 42software (version5.14, Circle Cardiovascular Imaging Inc.). An experienced radiologist reviewed all images in the current study. The reviewing radiologist was blinded to patient identity, outcomes, original scans, and subsequent imaging. All statistical analyses were performed using SPSS software(version 26.0). We adopted the spearman coefficient and analysis of variance (ANOVA analysis) to analyze the data to be studied. Normally distributed continuous variables as the mean ± SD and other data as median (interquartile range [IQR]). The significance level was set at 0.05, and two-sided tests were used.Results
We recruited 46 patients for CMR and the clinical characteristics of the patients are given in Table 1.There was a significant difference in native T1 value between the CKD3,CKD4, and CKD5 groups (p = 0.009)(Table 2).And Table 3 shows the correlation analysis of the native T1 value of all patients. Spearman correlation analysis showed a significant positive correlation between native T1 values and eGFR (r = 0.426, p = 0.003).Discussion
CKD patients present extremely high cardiovascular risk and high cardiovascular mortality and morbidity. It was widely shown in many studies that cardiovascular status affects patients’ outcomes [2]. The aim of our study was to assess native T1 values and perform cardiovascular status assessments using non-invasive methods in patients with advanced CKD. We suppose that eGFR affectsmacrocirculation function and structure. This study suggests that it is possible to apply T1 mapping to assess myocardial data in CKD patients. The benefit of detecting the relationship between T1 value and CKD stage will help clinical decision-making and reduce the mortality of cardiovascular events in CKD patients.Conclusion
The changes in native T1 value seem to be an integrated part of cardiovascular system damage in CKD patients. Our study shows the meaning of T1 mapping to assess myocardial data in CKD patients is significant. At the same time, the progression of CKD shows a possible correlation with the native T1 value.Acknowledgements
No Acknowledgements.References
[1] Triadyaksa P, Kuijpers D, Akinci D'Antonoli T, Overbosch J, Rook M, van Swieten JM, Oudkerk M, Sijens PE. Early detection of heart function abnormality by native T1: a comparison of two T1 quantification methods. EurRadiol. 2020 Jan;30(1):652-662.[2] Locatelli F, Pozzoni P, Tentori F, Vecchio L: Epidemiology of cardiovascular risk in patients with chronic kidney disease. Nephrol Dial Transplant 2003,18:vii2-vii9.
Figures
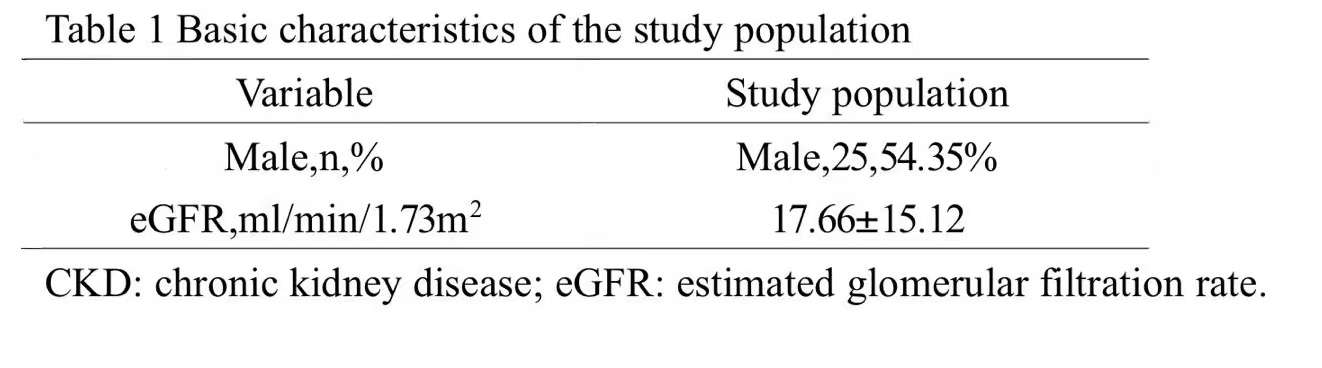
Basic characteristics of study population
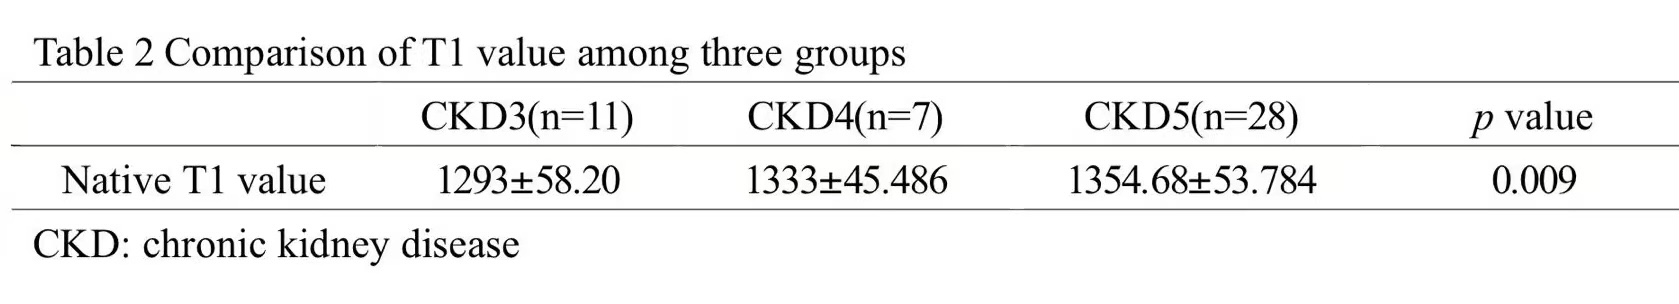
Comparison of T1 value among three groups
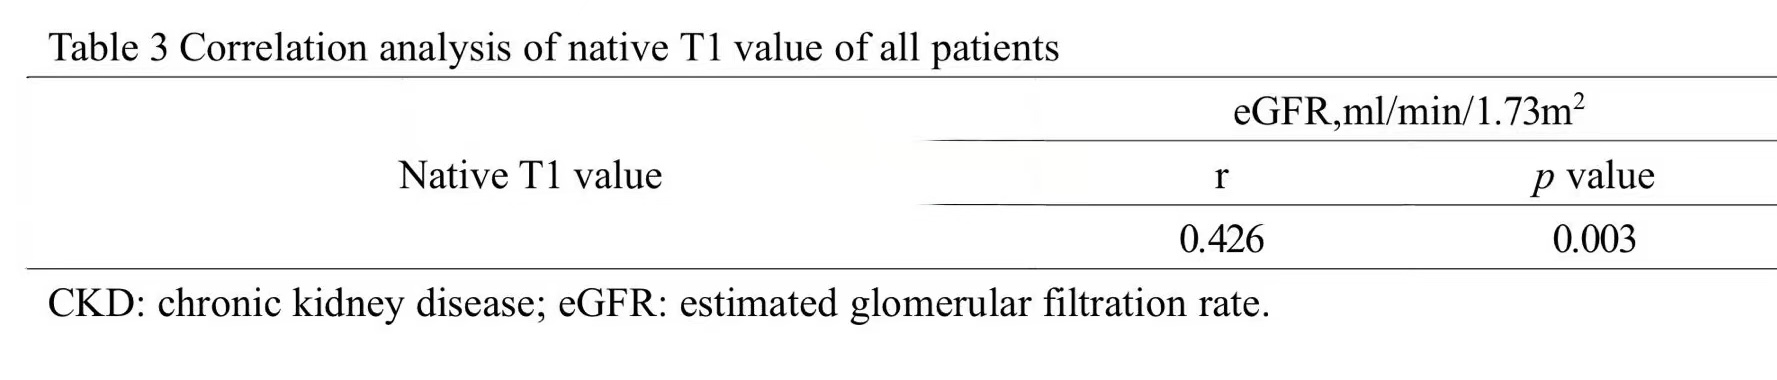
Correlation analysis of T1 value of all patients
DOI: https://doi.org/10.58530/2023/4138