4134
Cardiac MR evaluation of a myocarditis mouse model1Radiology and Biomedical Imaging, Yale University, New Haven, CT, United States, 2Cardiovascular Medicine, Yale University, New Haven, CT, United States
Synopsis
Keywords: Inflammation, Contrast Mechanisms
Tools were developed to evaluate mice models of myocarditis with cardiac MRI. Cine imaging with self-gating, T2 mapping using ECG-gated multi-spin echo acquisition, and pre- and post-contrast injection T1 mapping were employed. In twelve mice, including 4 mice models of myocarditis, normal T2 values were 19ms±2ms at 11.7T, and regions of higher T2 (25±2ms) were observed in some myocarditis mice. T1 mapping showed reduced T1 after injection of gadolinium, and regions of lower T1 in myocarditis vs. normal regions. These tools will be useful in improved characterization of myocarditis in mice.Introduction
Cardiac MRI is valuable in providing structural and functional information regarding the heart, including cine for evaluating volumes and mass as well as tissue characterization with T1 and T2 weighted imaging. More recent quantitative techniques with T2 mapping for inflammation assessment and T1 mapping for post-contrast measurement of fibrosis and necrosis have shown increased sensitivity. We sought to implement these mapping tools in mice due to their importance in monitoring models of myocarditis. Here we apply these technical methods to study a myocarditis mouse model and compare it to healthy controls.Methods
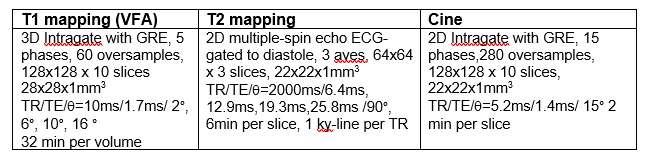
Twelve mice were imaged including 4 mice with myocarditis. The myocarditis model was an endothelial specific extracellular-signal-regulated kinase 5 (ERK5) knockout (KO), generated by crossing ERK5 flox/flox (f/f) mice with mice expressing inducible Cre recombinase under the Cdh5 promote. These mice develop spontaneous myocarditis (manuscript in preparation). Control mice are ERK5 f/f without the inducible Cre recombinase. ERK5 deletion was induced by injecting 10-week-old mice with 1mg/day of tamoxifen for 5 consecutive days and knockout was confirmed by genotyping. Control mice also received tamoxifen for the same number of days. Three of the myocarditis mice only had partial MR exams, due to their extensive disease.All imaging was performed on a 11.7T Bruker scanner (Paravision 6.0), using a 4cm volume coil, with mice positioned supine in a customized 3D-printed cradle. We monitored ECG and respiration using Small Animal Instruments (SAI) modules throughout the experiments. ECG electrodes were taped on the right front paw and left hind paw. Respiration was monitored using a pressure sensor pillow placed under the mouse. The temperature of the animal was maintained with temperature-controlled air blown into the bore. The imaging protocol consisted of localizers, self-gated cine imaging, ECG-gated T2-mapping and self-gated pre and post-contrast T1 mapping. Gadolinium contrast agent (Gadavist) was injected using a intraperitoneal catheter (1), using 20uL and a saline flush (a dose of 0.3 to 0.5 mmol/kg in these ~20-30g mice), followed by a 20 minute wait period before post-contrast imaging. Intraperitoneal injection in mice is common since i.v. mouse tail injections are challenging even for experts. Cine imaging was obtained using the product Intragate (self-gating) sequence (2) with scan parameters defined in Table 1. T2-mapping was performed using an ecg-gated multiple spin-echo sequence and 4TEs, as presented in Table 1 (using SAI monitor, begin delay ~80ms, acquisition window 20ms per RR). A single phase-encode was acquired in each RR in diastole, and 2000ms of recovery between echo-trains was employed. The multiple TE signals were fit to a single exponential decay, using least squares minimization, in Matlab. T1 mapping was performed using the method of Coolen et al (3), which advocates 3D GRE continuous imaging, with self-gating to generate a few cardiac-resolved bins, acquired at variable flip angles (VFA) for T1 estimation. The variable flip angle signals were fit to a model of gradient echo spoiled steady state signal vs. flip angle, using least-squares minimization, using customized software in Matlab. B1-mapping was performed in some studies, showing <10% error in B1, which was considered acceptable, so flip angle correction was not performed.
Results
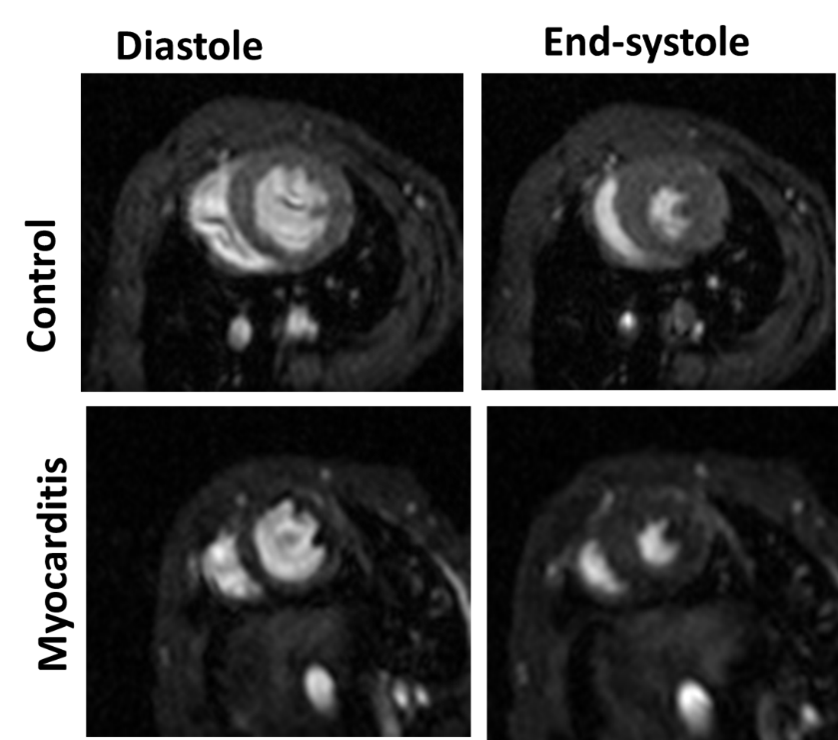
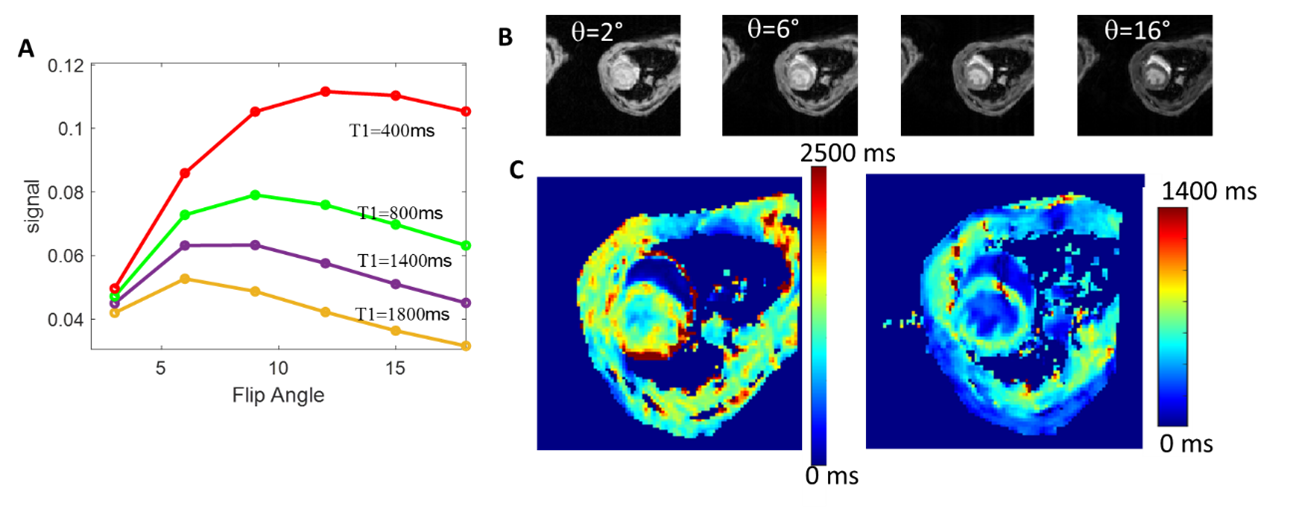
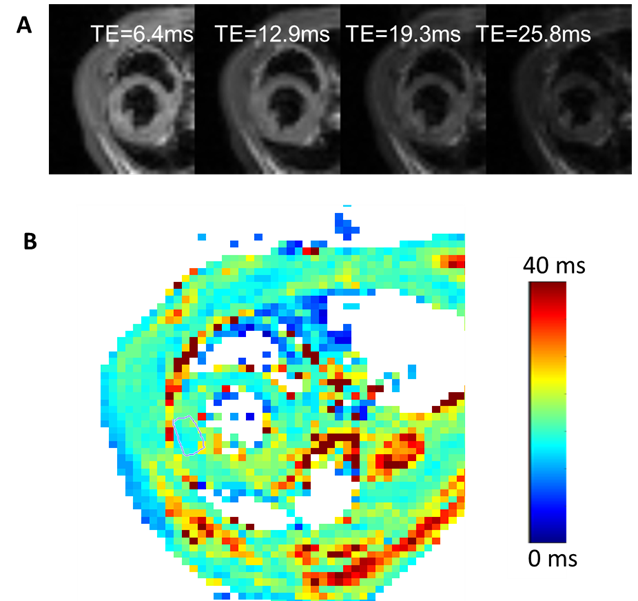
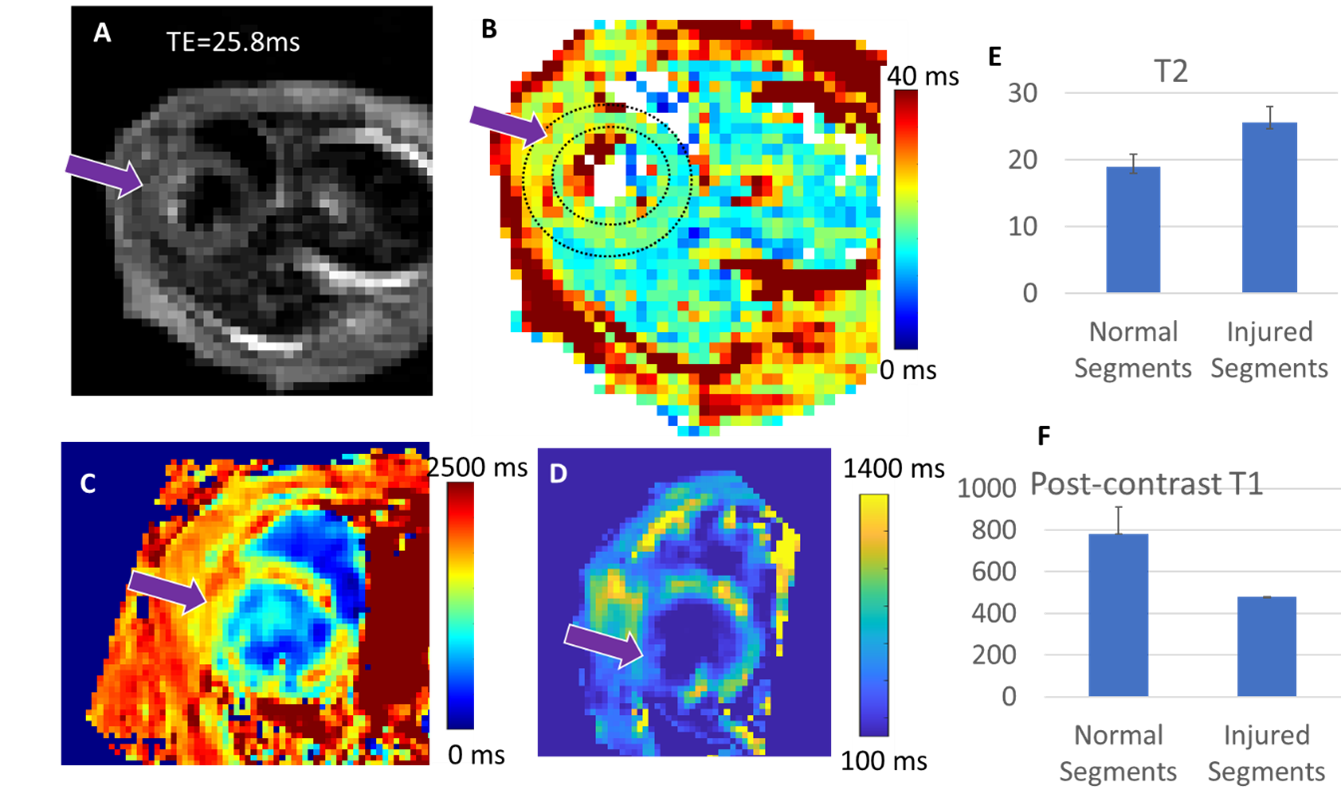
Figure 1 displays the cine data from a control and myocarditis model, at systole and diastole, showing excellent quality. Figure 2 presents the variable flip angle T1 mapping method, including the flip angle vs. T1 dependence at a TR of 10ms (A), examples of raw images (Figure 1B), and processed T1-maps (Figure 1C), which were able to provide estimates of pre-contrast myocardial , and post-contrast T1 values (shown in Figure 2 from a control mouse). Figure 3 presents raw T2W images and T2-maps from a control mouse. Figure 4 presents maps from a myocarditis model, showing possible regional of inflammation and necrosis, as evidenced by the region of increased T2 (Figure 4A,B) and reduced T1 post-contrast (arrows) (4e). Figure 4E-F compares average T2 and post-contrast T1 data from controls and to values in myocarditis mice (using ROIs). Regions of injury exhibited expected differences from regions in normal mice, but these must be confirmed using more objective ROI placement.Discussion
Our T2 data for controls matched prior measurements at 11.7T which reported T2 mapping values of 19ms at 11.7T (4), and was in the range of other reports (25ms at 7T (5), and 21ms at 9.4T (6)). The T2 maps would benefit from motion correction algorithms used in standard T2-mapping (“moco”). Our T1 values for myocardium were very similar to a recent 11.7T report, which noted that T1 values measured in systole were about 1400ms (7)—while another report noted native myocardial T1s of 1600ms at 9.4T (Coolen et al). The T1 mapping requires further improvements to establish its robustness, and cannot accurately measure pre-contrast blood T1. However, together these techniques will provide valuable insight into myocarditis, which will greatly benefit from investigation with preclinical cardiac MRI.Acknowledgements
American Heart Association (18CDA34110361)References
1. Dillenseger JP, Goetz C, Sayeh A, Zorn PE, Kremer S, Remond Y, Constantinesco A, Aubertin-Kirch G, Choquet P. Is Subcutaneous Route an Alternative to Intravenous Route for Mouse Contrast-Enhanced Magnetic Resonance Imaging at 1.5 T? Concept Magn Reson A 2019;2019.
2. Zuo Z, Subgang A, Abaei A, Rottbauer W, Stiller D, Ma G, Rasche V. Assessment of Longitudinal Reproducibility of Mice LV Function Parameters at 11.7 T Derived from Self-Gated CINE MRI. Biomed Res Int 2017;2017.
3. Coolen BF, Geelen T, Paulis LE, Nauerth A, Nicolay K, Strijkers GJ. Three-dimensional T1 mapping of the mouse heart using variable flip angle steady-state MR imaging. NMR Biomed 2011;24(2):154-162.
4. Schneider JE, Cassidy PJ, Lygate C, Tyler DJ, Wiesmann F, Grieve SM, Hulbert K, Clarke K, Neubauer S. Fast, high-resolution in vivo cine magnetic resonance imaging in normal and failing mouse hearts on a vertical 11.7 T system. J Magn Reson Imaging 2003;18(6):691-701.
5. Chen Y, Li W, Jiang K, Wang CY, Yu X. Rapid T-2 mapping of mouse heart using the carr-purcell-meiboom-gill sequence and compressed sensing reconstruction. J Magn Reson Imaging 2016;44(2):375-382.
6. Coolen BF, Simonis FFJ, Geelen T, Moonen RPM, Arslan F, Paulis LEM, Nicolay K, Strijkers GJ. Quantitative T-2 Mapping of the Mouse Heart by Segmented MLEV Phase-Cycled T-2 Preparation. Magn Reson Med 2014;72(2):409-417.
7. Speidel T, Li H, Bischoff M, Metze P, Rasche V. Fast Myocardial T1 -Mapping in Mice at 11.7 T using DESPOT and continuous tiny golden Angle Acquisitions. ISMRM 2020.
Figures