4132
Improving SASHA T1 precision via a deep-learning approach1Shool of Medical Technology, Beijing Institute of Technology, Beijing, China, 2Center for Biomedical Imaging Research, Department of Biomedical Engineering, School of Medicine, Tsinghua University, Beijing, China, 3Department of Infectious Diseases, The Affiliated Hospital of Yan’an University, Shanxi, China
Synopsis
Keywords: Myocardium, Machine Learning/Artificial Intelligence, SASHA
SASHA with a 3-parameter fitting model has high T1 accuracy but low precision due to low SNR in saturation-recovery T1-weighted images. Alternatively, a two-parameter model could improve the precision with the penalty of losing accuracy. In this study, we developed a 1D neural network (DeepFittingNet) to predict SASHA T1 and alleviate the impaction from noise. We trained DeepFittingNet using simulation of SASHA with different Rician noise levels and tested it using in-vivo MR data. Results showed that T1 from DeepFittingNet had high precision and comparable accuracy to that of the 3-parameter fitting.
INTRODUCTION
Cardiovascular magnetic resonance T1 mapping could characterize either diffuse or focus changes in the myocardium. Therefore, accurate myocardial T1 measurement is an unmet need to differentiate heart diseases and facilitate multi-center and long-term studies[1]. Saturation-recovery-single-shot-acquisition (SASHA) with a three-parameter (3-Para) fitting model is an alternative cardiac T1 mapping to Modified-Look-Locker inversion-recovery (MOLLI), which is widely used but has low accuracy, to accurately measure myocardial T1[2,3]. Due to the application of the saturation-recovery scheme, SASHA T1-weighted images are more prone to noise, resulting in low precision and therefore hampering the clinical application[4]. Several solutions have been proposed to improve SASHA T1 precision, including using a variable-flip-angle sequence or a 2-parameter (2-Para) fitting model[4,5]. The variable-flip-angle sequence is a bit complex and 2-Para fitting losses accuracy. Hence, SASHA precision still needs to be improved. In this study, we developed a 1D neural network (DeepFittingNet) to predict SASHA T1 and alleviate the impaction from noise.METHODS
DeepFittingNetIn Figure 1, DeepFittingNet consists of a bidirectional recurrent neural network (RNN) to encode the signals (Si) and saturation-recovery time (ti) and a fully connected neural network (FCNN) to predict T1. RNN and FCNN have eight hidden layers. A leaky rectified linear unit activation function is applied to each hidden layer of RNN and FCNN.
Training Dataset
SASHA sequence was numerically simulated 5000000 times. T1 (from 100ms to 2500ms), T2 (from 20ms to 250ms), heart rate (from 30bpm to 130bpm), off-resonance frequency (0Hz±30Hz), flip angle (Normalized B1:1±0.2), inversion efficiency (80%±20%), and saturation efficiency (100%±20%) were randomly changed. Reference T1 for each signal time course was calculated using a 3-Para curve-fitting method. Then, independent Gaussian noise was respectively added to real and imaginary parts of the complex singles to simulate different SNRs (from 20 to 120). Signals with and without noise were included in the dataset as data augmentation.
Validation and Testing Dataset: Twenty-one subjects (15 male;28±9 yrs) were imaged by MOLLI3(3)3(3)5 and SASHA on a Philips 3T scanner (Achieva TX) using typical imaging parameters, which was approved by the Institutional Review Board. All participants provided written informed consent prior scan. Ten of them (7 male; 29±12 yrs) were scanned twice in two separate scans. For each subject, only the SAX mid-ventricular slice was scanned. The curve-fitting method was used to fit T1. For SASHA, 2-Para and 3-Para models were used.
Training, Validation, and Testing: We implemented DeepFittingNet on a standard PC with one NVIDIA RTX3070 graphic processing unit using the Pytorch library.
The input T1-weighted signals were normalized to 0-1.1. DeepFittingNet was trained with 500 epochs and 25600 batch size. Mean absolute error ($$$MAE=\frac{1}{M}\sum_{}^{}|T_{x}-\hat{T_{x}}\mid$$$ , where $$$\hat{T_{x}}$$$ and $$$T_{x}$$$ are predicted one and ground-truth value) was used as the loss function to update DeepFittingNet with an ADAM optimizer and a learning rate of 0.001. SASHA T1 maps from ten subjects were used in the validation. Rest in-vivo images were used in testing. During training, the mean absolute difference and SD of left ventricle T1 of validation data were calculated.
Image and Statistical Analysis
ROIs for the left ventricle, septum, and blood were manually segmented in curve-fitting T1 maps. Mean±SD of T1 within these regions were calculated for each map. Paired Student’s t-test method with Bonferroni correction was used for multiple comparisons of the SASHA 3 T1 calculation methods. P<0.0167 was considered statistically significant.
RESULTS
In Figure 2, SASHA T1 maps by 2-Para fitting and DeepFittingNet had less variation across the left-ventricle myocardium in comparison to 3-Para fitting (Figure 2). MOLLI3(3)3(3)5 T1 maps had the highest image quality.T1 of the left ventricle of healthy volunteers at 3T were ~1580 ms by SASHA and ~1120 ms by MOLLI3(3)3(3)5 (Figure 3 and Table 1). The corresponding blood T1 was ~2200 ms and ~1800 ms, respectively. SASHA T1 of the left ventricle and septum calculated by 3-Para fitting and DeepFittingNet were ~80 ms higher than those by 2-Para fitting. There is no difference in SASHA left-ventricle T1 between 3-Para fitting and DeepFittingNet (P=0.25), as well as septum T1 (P=0.94), meaning DeepFittingNet had comparable accuracy to 3-Para fitting.
SASHA T1 by DeepFittingNet had a lower SD than 3-Para fitting in both the left ventricle and septum, where 2-Para had the lowest value. There is no difference in SD of Blood T1 between DeepFittingNet and 2-Para (P=0.78) while 3-Para fitting still had the highest value, indicating DeepFittingNet improved the image quality of SASHA T1 maps in comparison with 3-Para fitting.
DISCUSSION and CONCLUSION
Our study demonstrated that a 1D neural network trained by simulated signals with different Rician noise levels could improve the SASHA T1 precision while maintaining accuracy.Acknowledgements
This work is supported by the National Natural Science Foundation of China for Young Scholars (No. 82202138), the Fundamental Research Funds for the Young Investigator (No. XSQD-202213003), and the Fundamental Research Funds for the Central Universities (No. LY2022-22)
References
- Messroghli DR, Moon JC, Ferreira VM, Grosse-Wortmann L, He T, Kellman P, Mascherbauer J, Nezafat R, Salerno M, Schelbert EB, Taylor AJ, Thompson R, Ugander M, van Heeswijk RB, Friedrich MG. Clinical recommendations for cardiovascular magnetic resonance mapping of T1, T2, T2* and extracellular volume: A consensus statement by the Society for Cardiovascular Magnetic Resonance (SCMR) endorsed by the European Association for Cardiovascular Imaging (EACVI). J Cardiovasc Magn Reson 2017;19(75).
- Chow K, Flewitt JA, Green JD, Pagano JJ, Friedrich MG, Thompson RB. Saturation recovery single-shot acquisition (SASHA) for myocardial T(1) mapping. Magn Reson Med 2014;71(6):2082-2095.
- Messroghli DR, Radjenovic A, Kozerke S, Higgins DM, Sivananthan MU, Ridgway JP. Modified Look-Locker inversion recovery (MOLLI) for high-resolution T1 mapping of the heart. Magn Reson Med 2004;52(1):141-146.
- Kellman P, Hansen MS. T1-mapping in the heart: accuracy and precision. J Cardiovasc Magn Reson 2014;16(22).
- Chow K, Yang Y, Shaw P, Kramer CM, Salerno M. Robust free-breathing SASHA T1 mapping with high-contrast image registration. J Cardiovasc Magn Reson 2016;18(1):47.
Figures
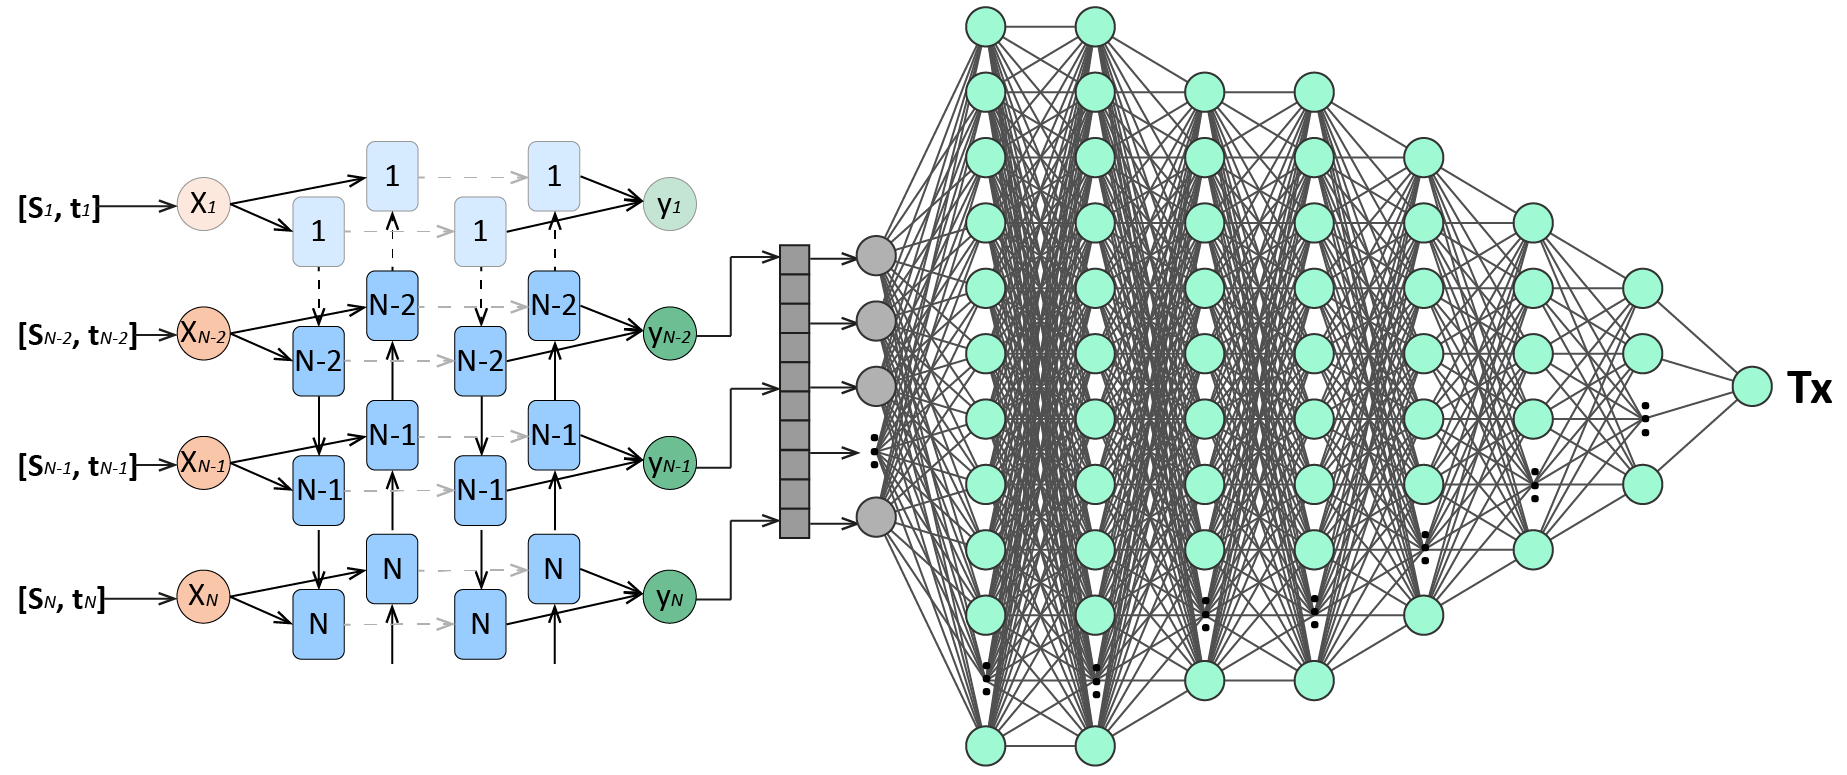
Figure 1. DeepFittingNet architecture. A: a bidirectional recurrent neural network (RNN) is first used to encode the T1-weighted signals (Si) and saturation-recovery time (ti). B: A fully connected neural network is used to predict T1. The hide size of each layer of RNN is 32. The neurons of each layer of FCNN were designed as 400, 400, 200, 200, 100, 50, 30, and 1.
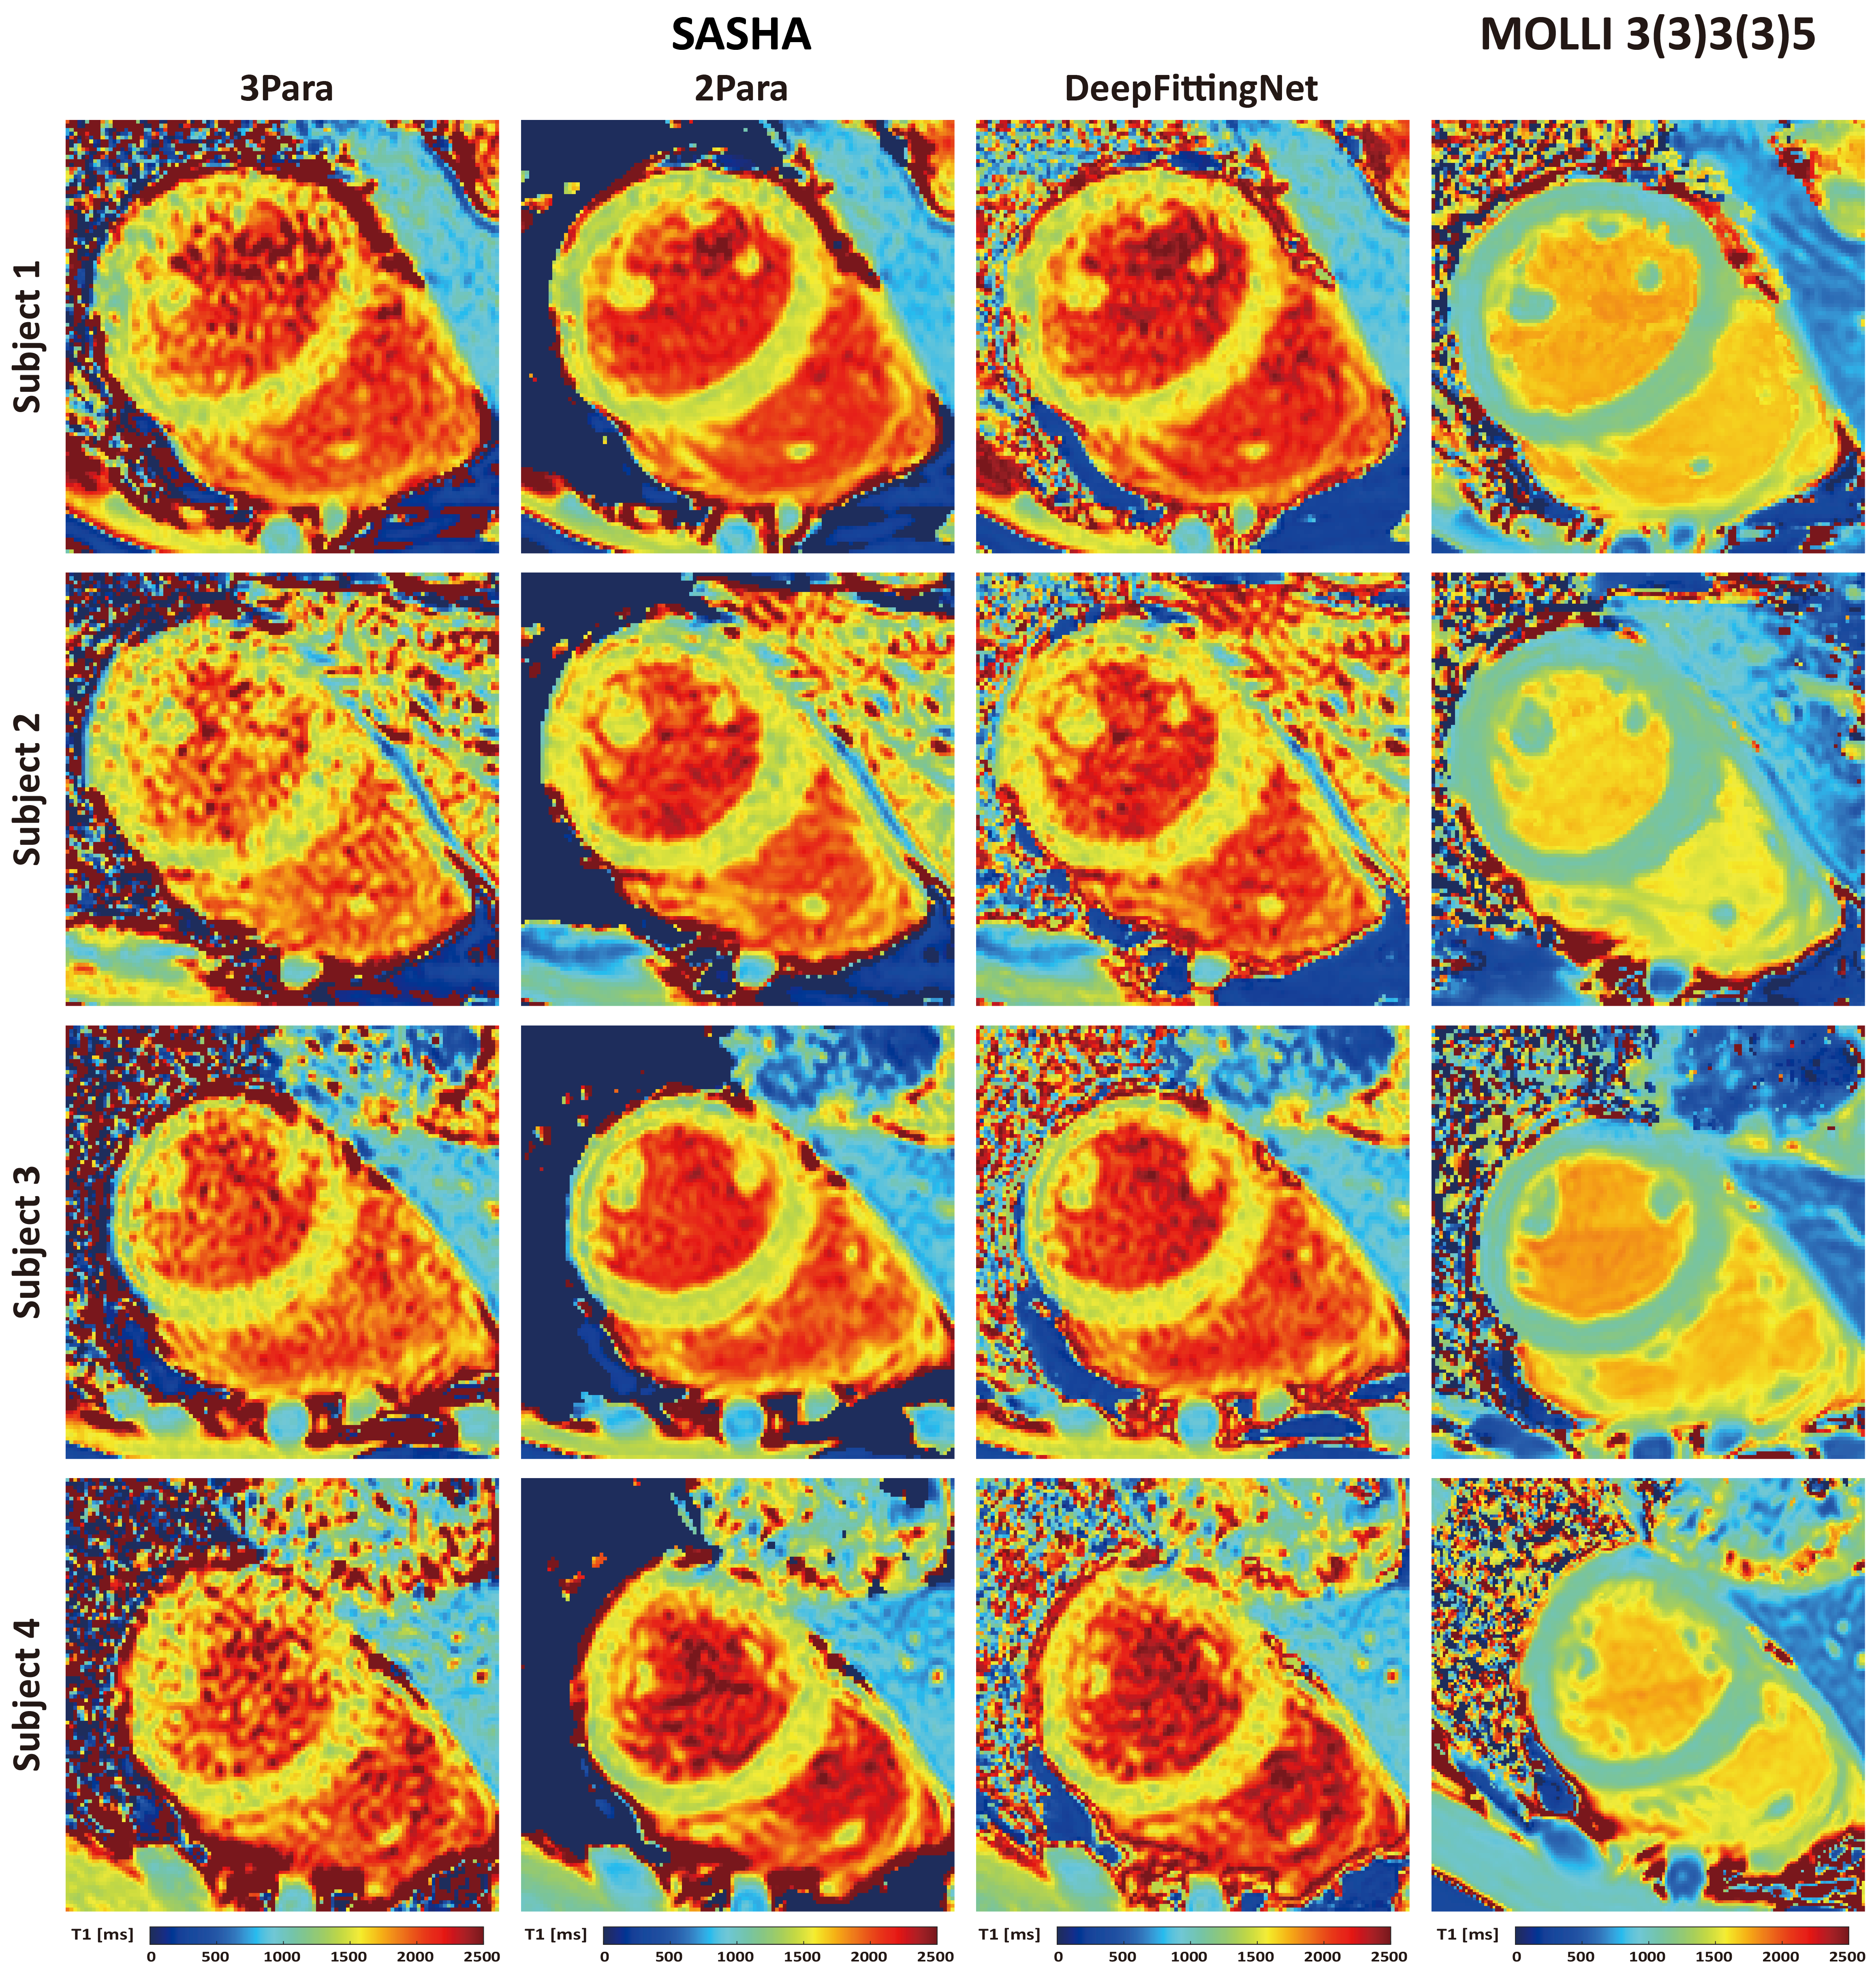
Figure 2. T1 maps of four subjects imaged by SASHA and MOLLI3(3)3(3)5. For SASHA, curve-fitting with 2-Para and 3-Para models and DeepFittingNet were used in T1 map reconstruction. MOLLI3(3)3(3)5 T1 maps have the best image quality. Left-ventricle and blood in SASHA T1 maps built by 2-Para fitting and DeepFittingNet have less variation compared to SASHA 3-Para.
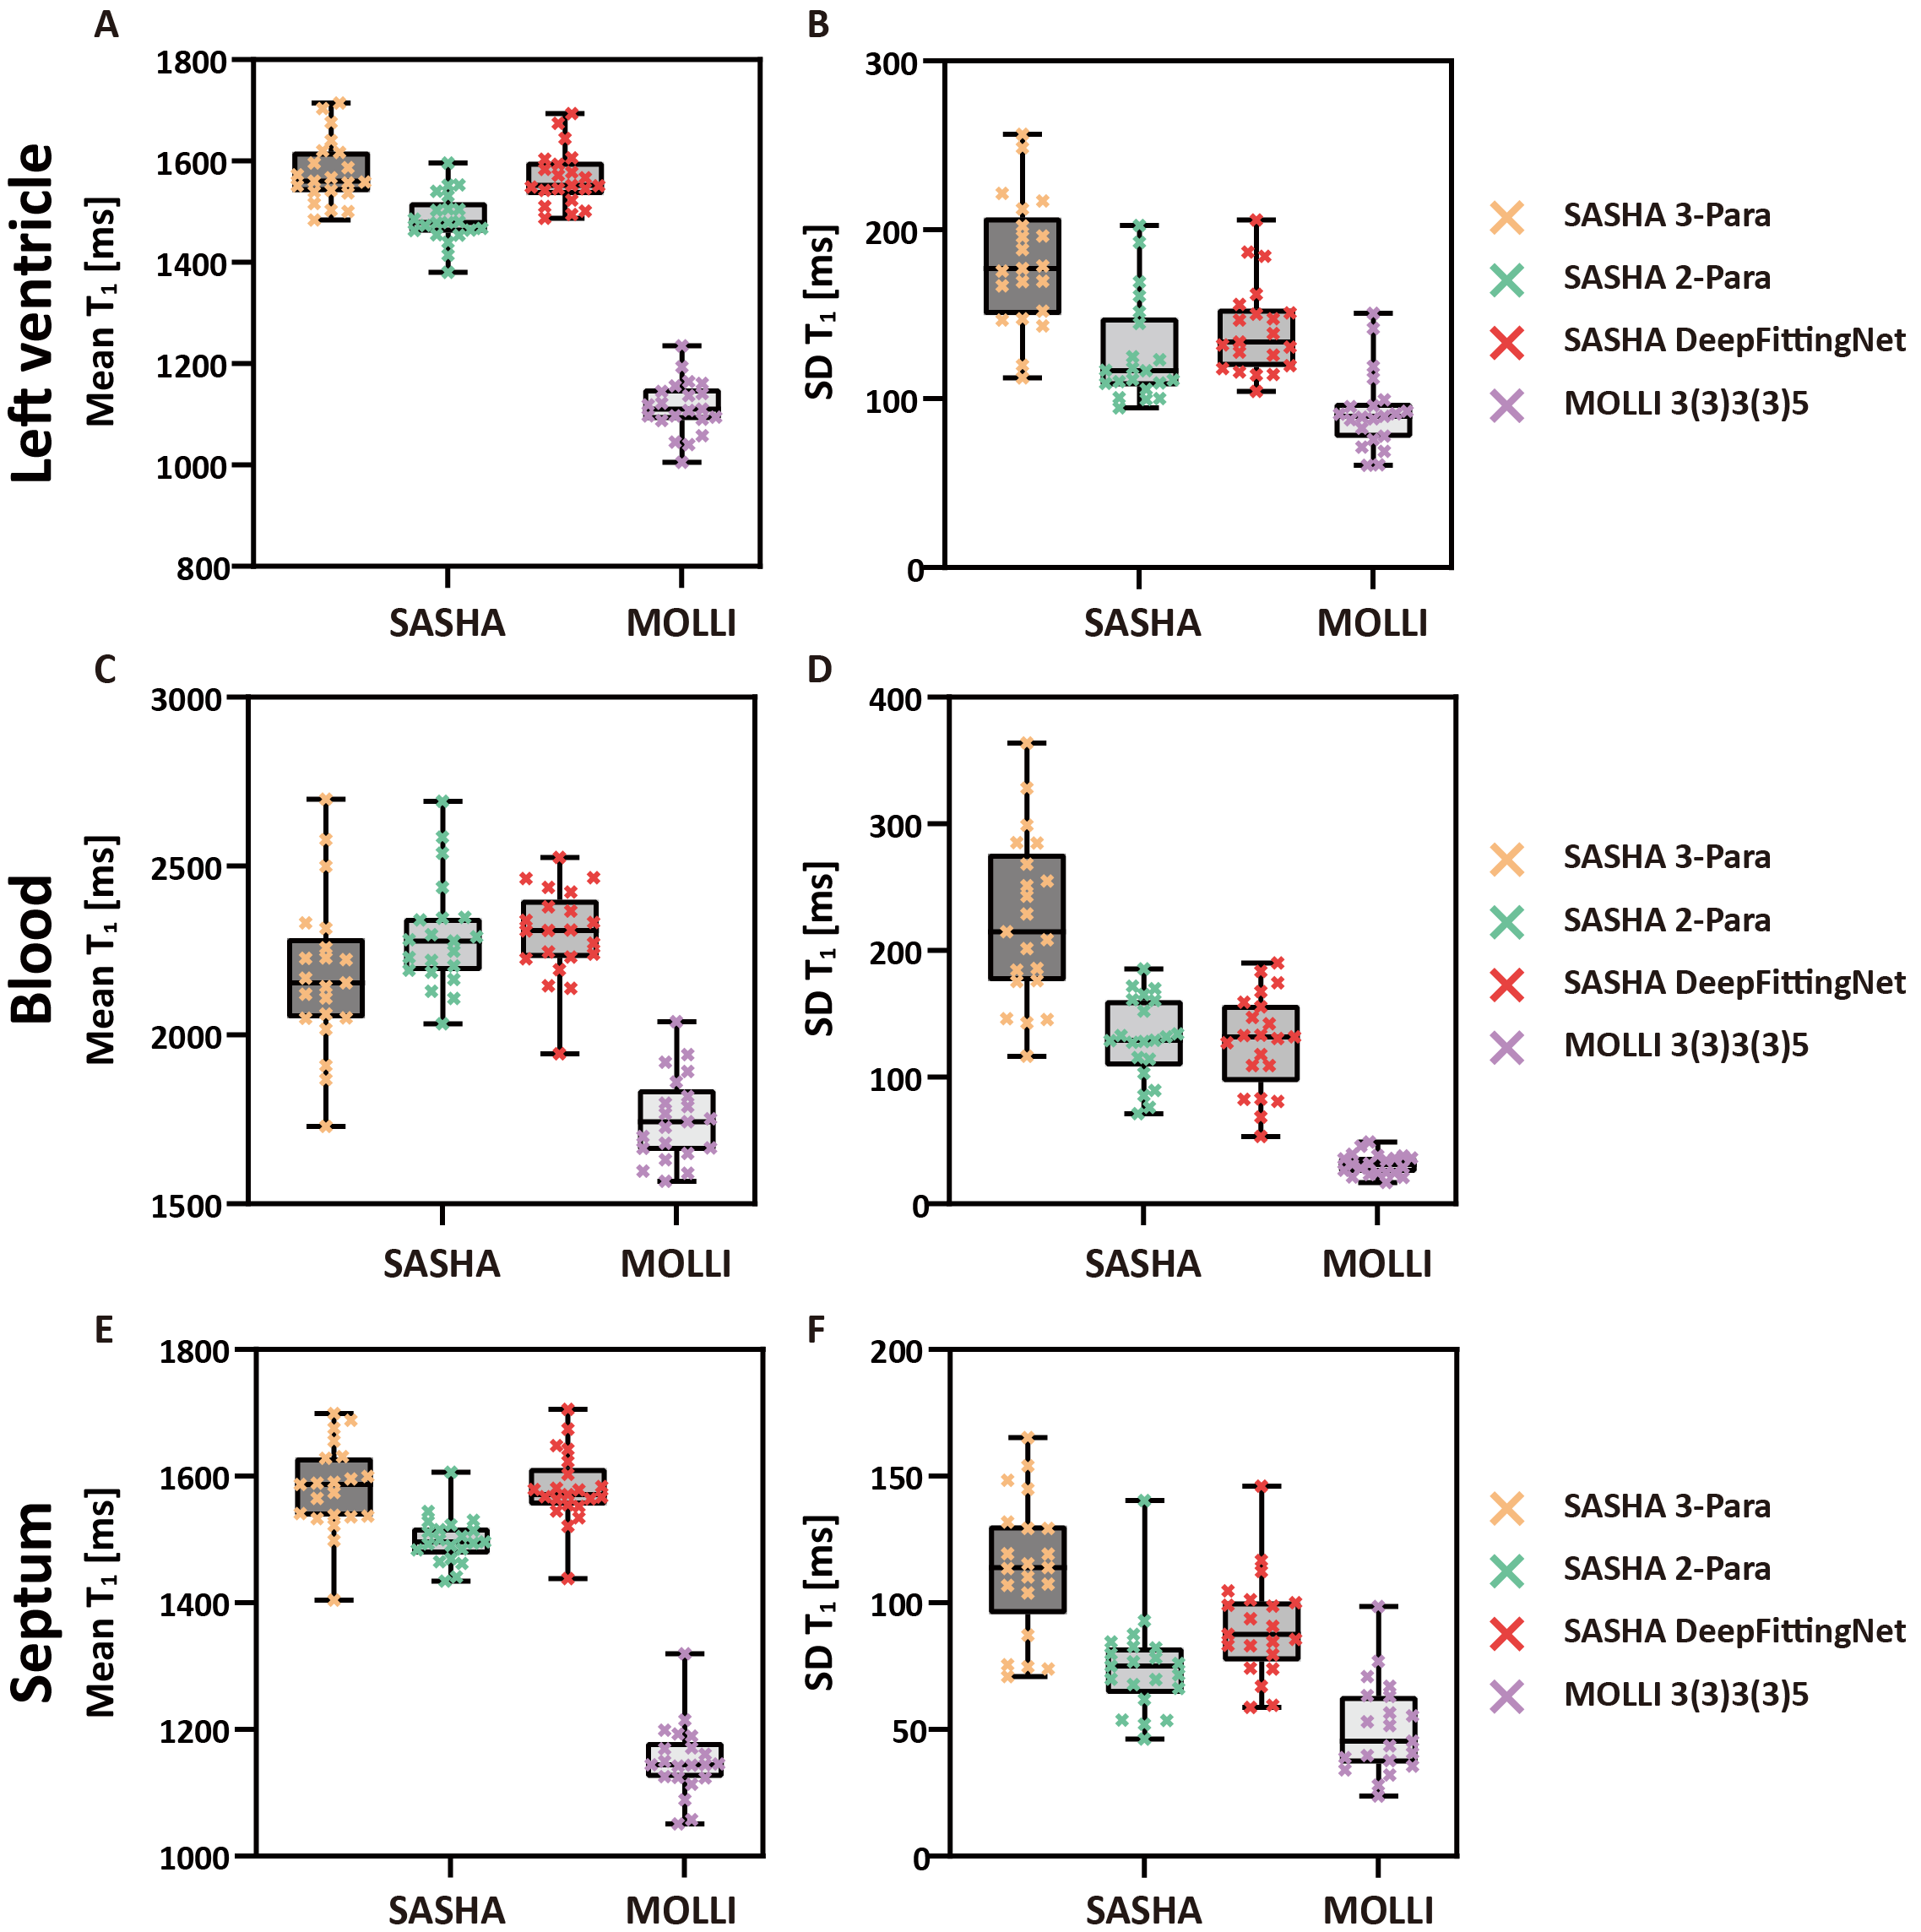
Figure 3. Results of testing experiments. Box-plots shows mean and SD for left ventricle (A and B), blood (C and D) and septum (E and F) averaged across all volunteers (N=21) by two sequences (SASHA and MOLLI3(3)3(3)5). For SAHSA, the results of three calculation methods are shown.
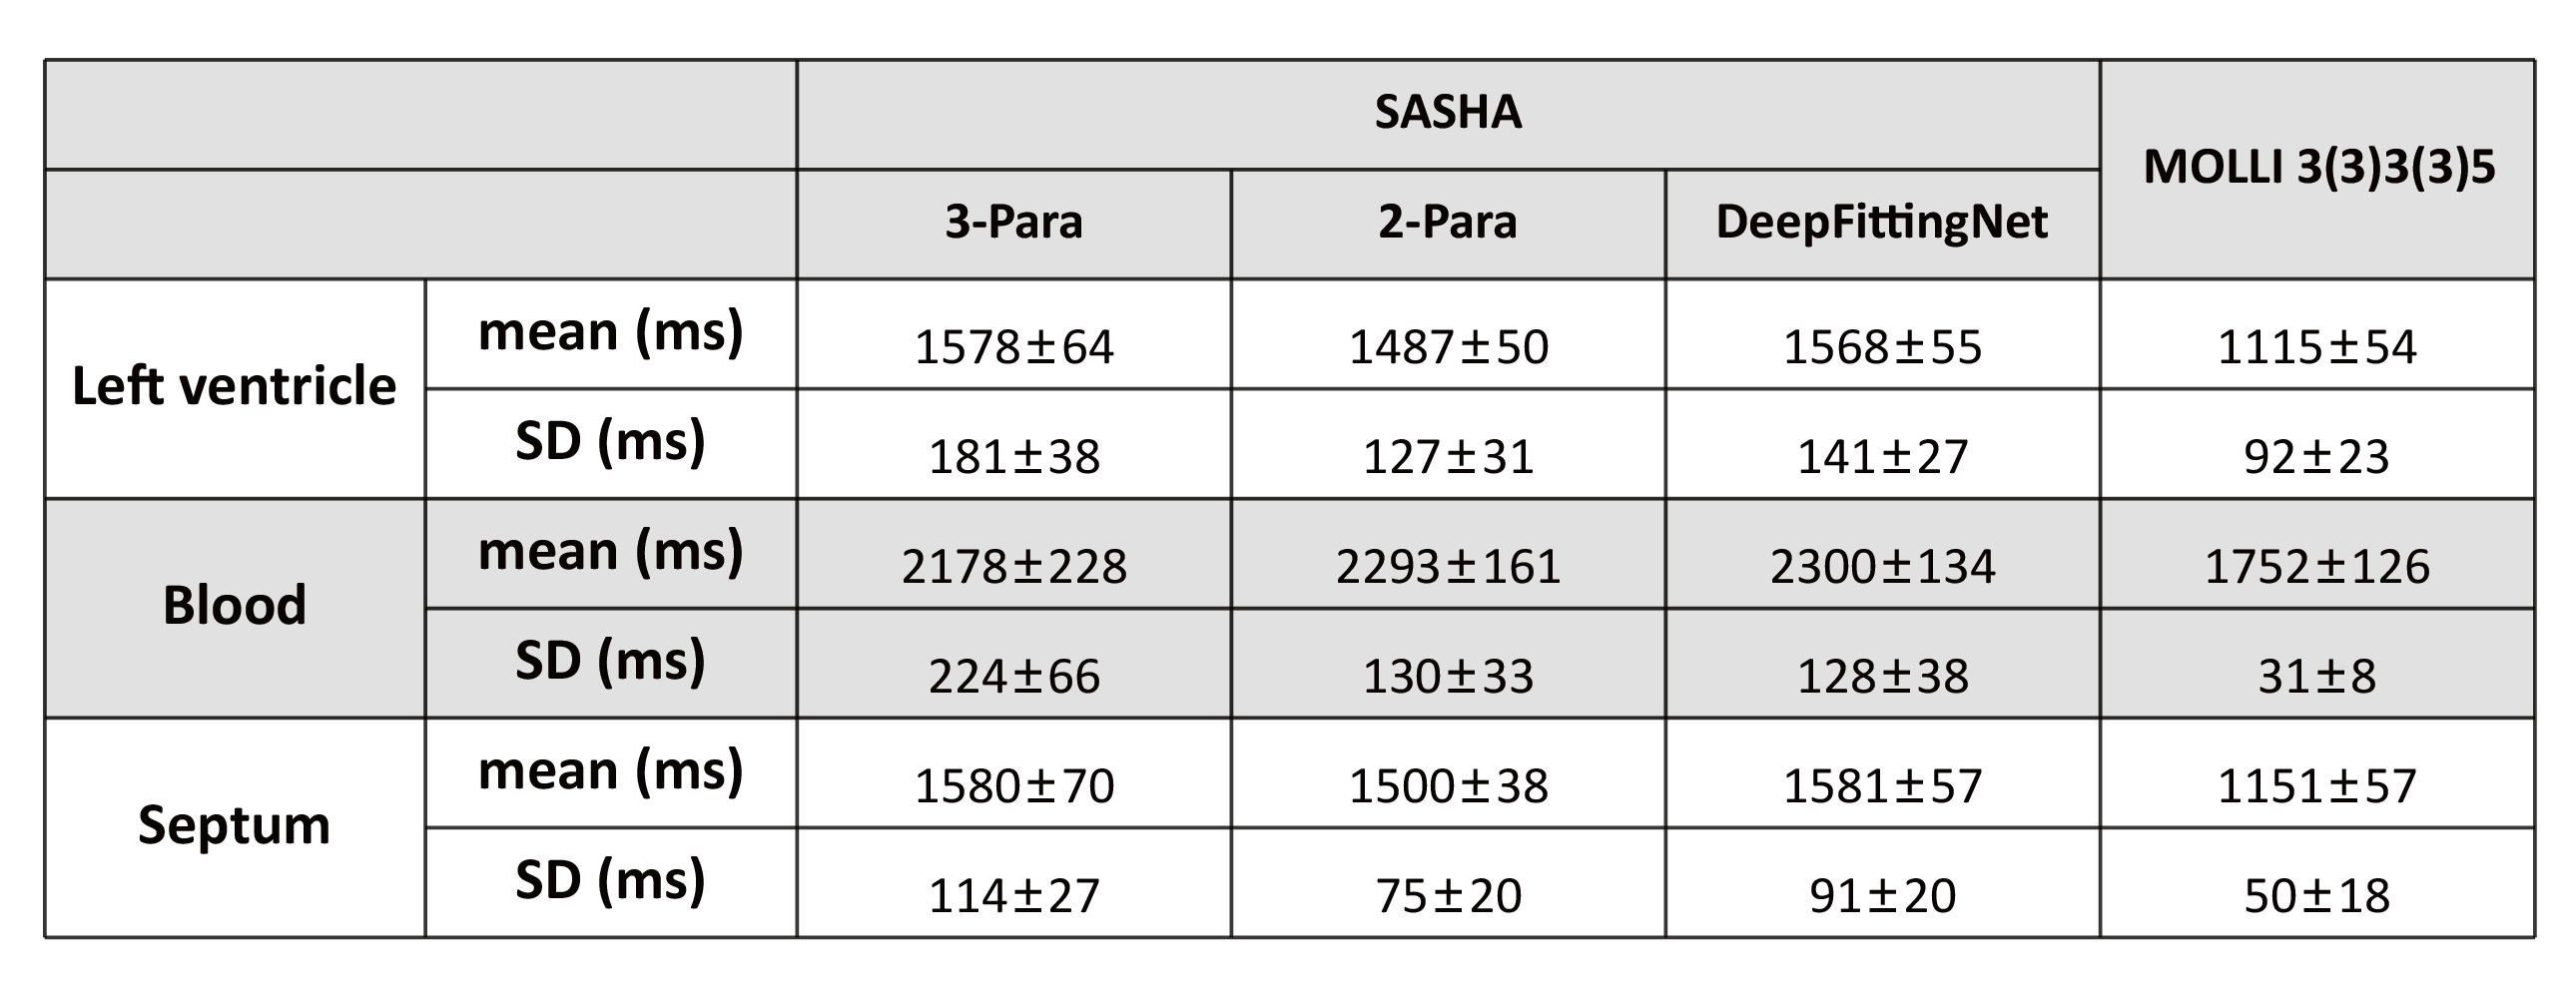
Table 1. The mean and SD of T1 averaged across all volunteers (N=21) in the testing dataset.