4129
Prediction for Ki-67 Expression Using Intravoxel Incoherent Motion Imaging in Rectal Cancer
Anliang Chen1, Deshuo Dong1, Changjun Ma1, Ailian Liu1, and Qingwei Song1
1radiology, The First Affiliated Hospital of Dalian Medical University, Dalian, China
1radiology, The First Affiliated Hospital of Dalian Medical University, Dalian, China
Synopsis
Keywords: Cancer, Digestive
The Ki-67 expression has been verified as a prognostic indicator in colorectal cancer, correlating with biological behavior of tumor and response to the chemotherapy. The purpose of this study was to evaluate the value of intravoxel incoherent motion (IVIM) imaging for prediction of Ki-67 expression status in rectal cancer. The results indicate that high Ki-67 status group had significantly lower ADC and D values than low Ki-67 status group. IVIM imaging allows non-invasive visualization and quantification of tissue composition for prediction of Ki-67 expression status in rectal cancer.Introduction
Colorectal cancer is one of the most common malignant tumors in human body. Ki-67 is a nuclear protein and expressed during all phases of cell cycle activity1.The Ki-67 expression has been verified as a prognostic indicator in colorectal cancer, correlating with biological behavior of tumor2, and response to the chemotherapy. IVIM imaging can get multiple parameters noninvasively and quantitatively to evaluate the diffusion and microcirculation perfusion of the water molecules in the voxel without the need for an exogenous contrast agent. This study is aimed to evaluate the value of IVIM imaging for prediction of Ki-67 status in rectal cancer.Methods and Materials
This study retrospectively included 86 patients which were divided into two groups, high Ki-67 status group (n=67, 49 males, 18 females, age 66.06±9.99) and low Ki-67 status group (n=19, 16 males, 3 females, age 63.21±9.66). All patients underwent IVIM imaging and conventional MR examinations including T1WI, T2WI, DCE-MR on a 3.0T GE MR scanner. Raw data were transferred to AW 4.6 workstation for postprocessing. Three regions of interest (ROIs) were manually placed on the lesion of rectal lesions to obtain ADC, D, D* and f values (Figure1). The ADC, D, D* and f values were compared between the two groups using Mann-Whitney U test. Receiver operating characteristic (ROC) curve analyses were performed to evaluate the diagnostic efficiency of the parameters. Statistical analyses were carried out with SPSS 26.0 (IBM) and MedCalc 12.5.5.Results
High Ki-67 status group had significantly lower ADC and D values than low Ki-67 status group (P < 0.05)(Table 1). There was no difference of D * and f values between two groups. The AUC values for the ROC analyses of ADC and D values for differentiation two groups was 0.681 and 0.663 , with the sensitivity of 92.95% and 73.13%, and specificity of 47.37% and 68.42%, respectively (Figure 2, Table 2).Discussion and Conclusions
IVIM imaging can effectively reflect lesion changes between two groups of Ki-67 status in rectal cancer. The ADC and D value reflects the diffuse state of the tumor. The decrease in ADC, D value and the increase in tumor density may be related to the higher invasiveness and malignancy of rectal cancer with high Ki-67 status. In conclusion, IVIM imaging may have certain potential non-invasive technique for prediction for Ki-67 status in rectal cancer.Acknowledgements
No acknowledgement found.References
[1] Scholzen T, Gerdes J. The Ki-67 protein: From the known and the unknown. J Cell Physiol 2000;182(3):311-322.
[2] Melling N, Kowitz CM, Simon R, et al. High Ki67 expression is an inde- pendent good prognostic marker in colorectal cancer. J Clin Pathol 2016;69(3):209-214.
Figures
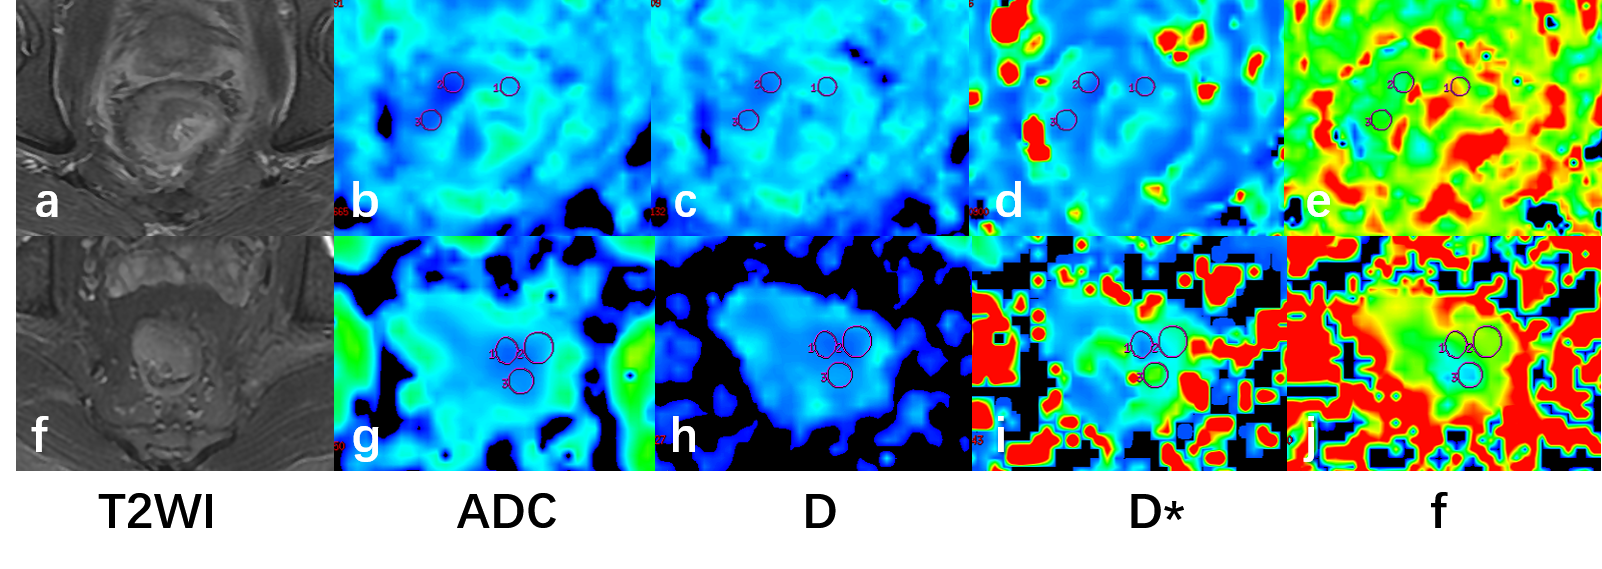
Figure 1 T2WI (a,f) showed the largest lesion of rectal cancer. Figure a-e: A 56-year-old male patient with low Ki-67 status. ADC(b), D(c), D* (d) and f(e) images are shown and the average values were 1.267×10⁻³ mm2/s, 0.770×10⁻³ mm2/s, 4.23×10⁻³ mm2/s and 0.680. Figure f-j: A 68-year-old male patient with high Ki-67 status. ADC(g), D(h), D* (i) and f(j) images are shown and the average values were 0.623×10⁻³ mm2/s, 0.477×10⁻³ mm2/s, 6.377×10⁻³ mm2/s and 0.259.
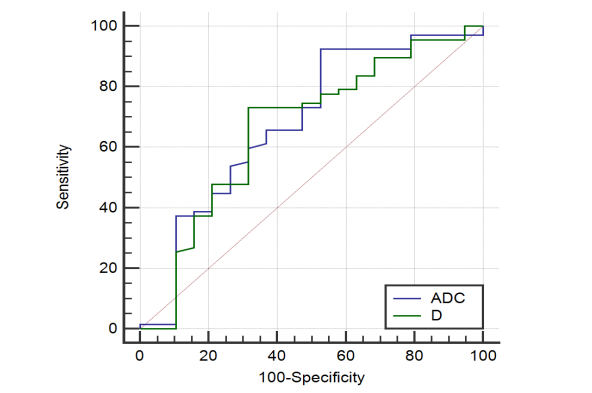
Figure 2 ROC Curves of ADC and D value in the comparison of Ki-67 status in rectal cancer. The area under the ROC curve of ADC and D values were 0.681 and 0.663.
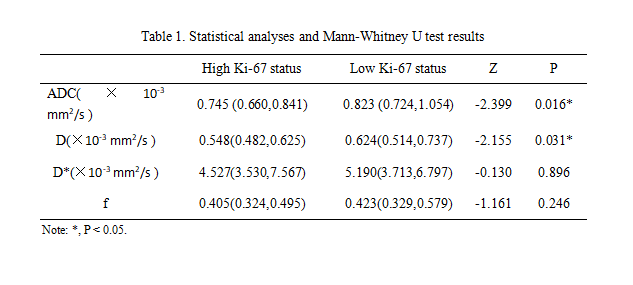
Table 1. Statistical analyses and Mann-Whitney U test results
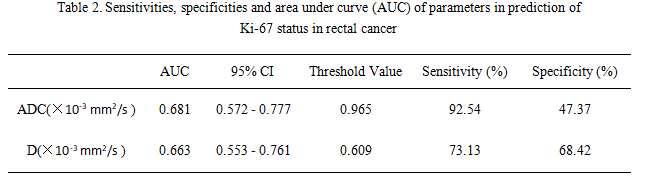
Table 2. Sensitivities, specificities and area under curve (AUC) of parameters in prediction of Ki-67 status in rectal cancer
DOI: https://doi.org/10.58530/2023/4129