4128
Evaluation of Diffusion Kurtosis Imaging in Prediction of P53 Expression in Rectal Cancer
Anliang Chen1, Deshuo Dong1, Changjun Ma1, Ailian Liu1, and Qingwei Song1
1radiology, The First Affiliated Hospital of Dalian Medical University, Dalian, China
1radiology, The First Affiliated Hospital of Dalian Medical University, Dalian, China
Synopsis
Keywords: Cancer, Cancer
Mutant P53 promotes tumor cell proliferation, invasion, and resistance to chemotherapy. The purpose of this study was to evaluate the value of Diffusion Kurtosis Imaging (DKI) for prediction of P53 expression status in rectal cancer. The results indicate that positive P53 status group had significantly lower MD and higher MK values than negative P53 status group. DKI reflect a non-Gaussian phenomenon of water molecules within biologic tissues for prediction of P53 expression status in rectal cancer.Introduction
Rectal cancer is one of the major causes of cancer-related mortality worldwide. Mutant P53 promotes tumor cell proliferation, invasion, and resistance to chemotherapy1. DKI reflect a non-Gaussian phenomenon of water molecules within biologic tissues. This study focuses on the value of diffusion kurtosis imaging (DKI) in predicting P53 expression status in rectal cancer.Methods and Materials
A retrospective analysis was performed on 82 rectal cancer patients confirmed with P53 expression according to their postoperative pathology results. They were divided into group 1 (positive P53 status; 60 patients; 45 male, 15 female, mean age: 66.57±9.91 years, range: 45-90 years) and group 2 (negative P53 status; 22 patients, 17 male, 5 female, mean age: 62.55±10.13 years, range: 43-89 years) according to their P53 status. All participants underwent T2WI、DKI scans on a 3.0T MRI scanne(GE Signa HDXT) before surgery. Detailed scan parameters were listed in Table 1. The DKI images were post-processed using FuncTool software on AW4.6 workstation. Three region of interests (ROIs) were put on the largest slice of tumors, avoiding bleeding, necrosis, and cystic degeneration. Statistical analyses were carried out with SPSS 26.0 (IBM) and MedCalc 15.2.2. Mann-Whitney U test was used to compare the differences between two groups. Receiver operating characteristic (ROC) curve analyses were performed to evaluate the diagnostic efficiency of the parameters.Results
Group 1 had significantly higher mean kurtosis (MK) values and lower mean diffusion (MD) values than group 2 (P < 0.05)(Table 2). There was no difference of fractional anisotropy (FA) values between two groups. The AUC values for the ROC analyses of MK and MD values for differentiation two groups was 0.676 and 0.650, with the sensitivity of 66.67% and 31.67%, and specificity of 68.18% and 95.45%, respectively (Figure 2).Discussion and Conclusions
Group 1 had significantly higher MK value than group 2, which might be related to the complexity of the microstructure in positive P53 status (such as cell density, and cell atypia, etc.). Group 1 had significantly lower MD value than group 2, which might because positive P53 status group has the structure of tissue is relatively dense, thus the degree of diffusion limitation of water molecules is high. MK and MD values both performed a certain potential diagnostic efficiency in prediction of P53 status.Acknowledgements
No acknowledgement found.References
[1] Nakayama M, Oshima M. Mutant p53 in colon cancer. J Mol Cell Biol 2019;11(4):267-276.Figures
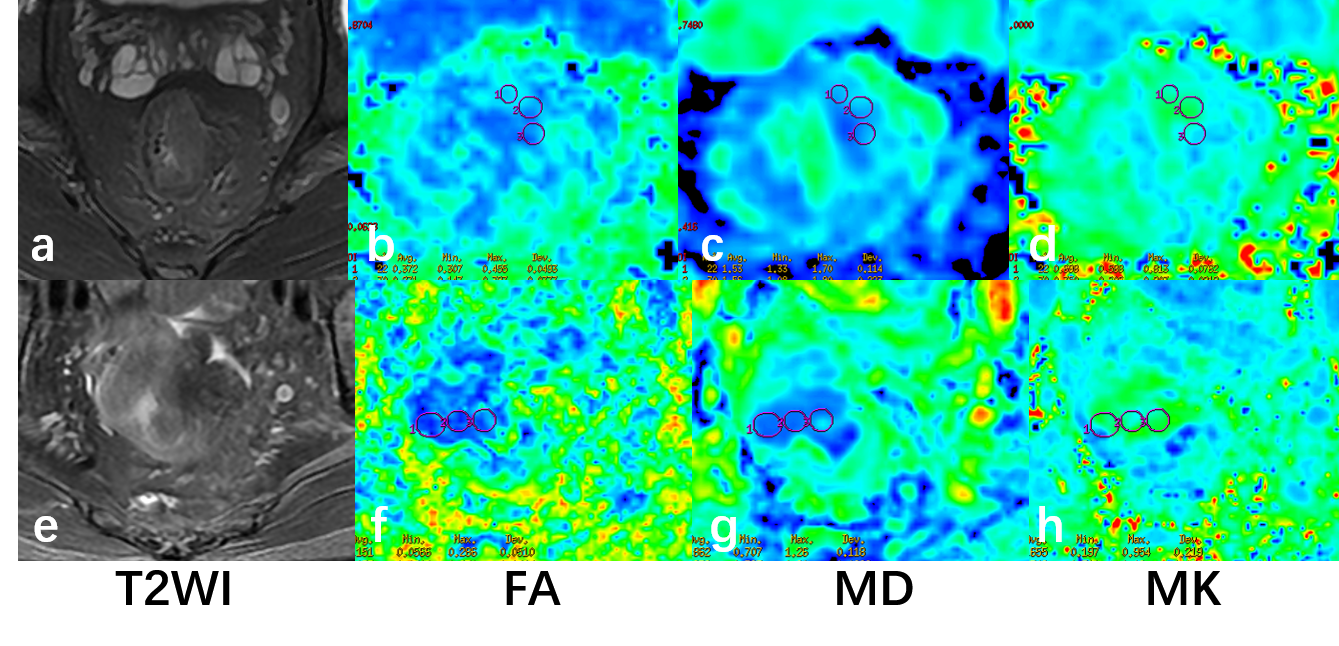
Figure 1. A 58-year-old male rectal cancer patient with negative P53 status confirmed by postoperative pathology. T2WI(a), FA(b), MD(c), MK(d) images were shown. FA values are 0.372, 0.271, 0.232; MD values are 1.53 μm2 /ms, 1.56 μm2 /ms, 1.35 μm2 /ms; MK values are 0.698, 0.750, 0.500.A 88-year-old male rectal cancer patient with positive P53 status confirmed by postoperative pathology. T2WI(e), FA(f), MD(g), MK(h) images were shown. FA values are 0.151, 0.153, 0.203; MD values are 0.862 μm2 /ms, 0.878 μm2 /ms, 1.04 μm2 /ms; MK values are 0.655, 0.748, 0.803.
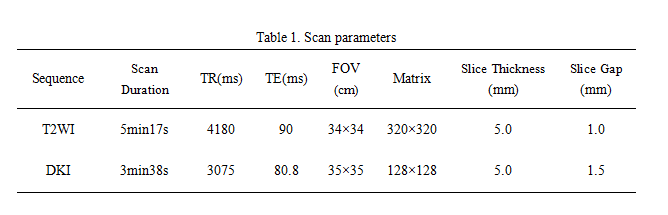
Table 1. Scan parameters
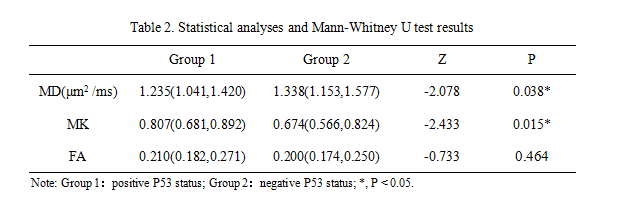
Table 2. Statistical analyses and Mann-Whitney U test results
DOI: https://doi.org/10.58530/2023/4128