4115
Identifying the Metabolic Signatures of PPARD-Overexpressing Gastric Tumors by HP MRI and Metabolomics
Shivanand Pudakalakatti1, Mark Titus2, Imad Shureiqi3, Xiangsheng Zuo4, and Pratip Bhattacharya1
1Cancer Systems Imaging, University of Texas MD Anderson Cancer Center, Houston, TX, United States, 2Genitourinary Medical Oncology, University of Texas MD Anderson Cancer Center, Houston, TX, United States, 3University of Michigan, Ann Arbor, MI, United States, 4Gastrointestinal Medical Oncology, University of Texas MD Anderson Cancer Center, Houston, TX, United States
1Cancer Systems Imaging, University of Texas MD Anderson Cancer Center, Houston, TX, United States, 2Genitourinary Medical Oncology, University of Texas MD Anderson Cancer Center, Houston, TX, United States, 3University of Michigan, Ann Arbor, MI, United States, 4Gastrointestinal Medical Oncology, University of Texas MD Anderson Cancer Center, Houston, TX, United States
Synopsis
Keywords: Digestive, Hyperpolarized MR (Non-Gas), 13C Pyruvate, Metabolomics
Peroxisome proliferator-activated receptor delta (PPARD) is a ligand-dependent nuclear transcription factor that regulates a multiplicity of pathophysiological processes vital to cell metabolism. Recent discovery of PPARD overexpressed in villin-positive gastric progenitor cells, demonstrated spontaneous development of large, invasive gastric tumors as the mice aged. These unique animal models allowed us to address the knowledge gap of PPARD-regulated downstream metabolic changes and determine the significance of changes in gastric tumorigenesis by hyperpolarized MRI, NMR spectroscopy and LC-MS. Unlike many cancer systems, we found these gastric cancer tumors are not primarily dependent on aerobic glycolysis but on fatty acid oxidation for energy.Background
Peroxisome proliferator-activated receptor delta (PPARD) is a nuclear receptor known to play an essential role in regulation of cell metabolism, cell proliferation, inflammation, and tumorigenesis in normal and cancer cells. Recent discovery of PPARD overexpressed in villin-positive gastric progenitor cells, demonstrated spontaneous development of large, invasive gastric tumors as the mice aged. However, the role of PPARD in regulation of downstream metabolism in normal gastric and tumor cells is elusive. The aim of this study is to apply Magnetic Resonance (MR) and mass spectrometry-based analytical techniques to understand PPARD-regulated downstream metabolic changes and significance of those changes to gastric tumorigenesis in mice.Methods
Hyperpolarized 1-13C pyruvate MR spectroscopy (in vivo), Nuclear Magnetic Resonance (NMR) spectroscopy and Liquid Chromatography-Mass Spectrometry (LC-MS) (ex vivo) were employed for metabolic profiling to determine the PPARD-regulated metabolite changes in different time points of PPARD overexpressing mice during the development of gastric cancer (GC) and compared with the corresponding wild-type (WT) mice.Results
NMR-spectroscopy based metabolomics screening results showed increased levels of inosine monophosphate (p = 0.0054), uracil (p = 0.0205), phenylalanine (p = 0.017), glycine (p = 0.014), and isocitrate (p = 0.029) and lower levels of inosine (p = 0.0188) in 55-week-old PPARD mice than in 55-week-old wild-type mice (Figure 1). PPARD mice as aged from 10 weeks to 35 weeks and 55 weeks, the significant changes in levels of the metabolites inosine monophosphate (p = 0.0054), adenosine monophosphate (p = 0.009), UDP-glucose (p = 0.0006), and oxypurinol (p = 0.039) were observed. Hyperpolarized 1-13C pyruvate to lactate flux measurement in live 10 weeks-old PPARD mice with no gastric tumors and 35 weeks-old PPARD mice with gastric tumors did not show any significant difference in nLac (ratio of lactate to total pyruvate+lactate) value indicating this PPARD-induced spontaneous gastric tumor development does not require glycolysis as the main source of fuel to tumorigenesis in GC (Figure 2). On the other hand, LC-MS analysis of the fatty acid levels showed a concomitant decrease in linoleic acid, palmitic acid, oleic acid and steric acid in 55-week-old PPARD mice compared to 10-week-old PPARD mice, supporting fatty acid oxidation as a bioenergy source for PPARD overexpressing gastric tumors (Figure 3).Conclusions
NMR spectroscopy and LC-MS data revealed significant changes in PPARD-regulated downstream metabolites in preclinical mouse models. Unlike many cancer systems, we found this PPARD overexpressing gastric cancer tumors are not primarily dependent on aerobic glycolysis. Instead, our data demonstrated that fatty acid oxidation is the dominant bioenergy source in these tumors. PPARD and PPARD-mediated metabolite changes might be the potential targets for developing interventions for gastric cancer chemoprevention and chemotherapies.Acknowledgements
This research was funded in part by a grant from NCI PREVENT; Cancer Prevention Research Institute of Texas (RP220270), Duncan Family Institute for Cancer Prevention and Risk Assessment Seed Funding; by grants from the US National Cancer Institute (U01 CA214263, U54 CA151668 and R21 CA185536, R01 CA218004; and 1P50 CA221707-01). This work also was supported by the National Institutes of Health/NCI Cancer Center Support Grant under award number P30 CA016672.References
1. Torre, L.A.; Bray, F.; Siegel, R.L.; Ferlay, J.; Lortet-Tieulent, J.; Jemal, A. Global cancer statistics, 2012. CA Cancer J. Clin. 2015, 65, 87–108.
2. Zuo, X.; Deguchi, Y.; Xu, W.; Liu, Y.; Li, H.S.; Wei, D.; Tian, R.; Chen, W.; Xu, M.; Yang, Y.; et al. PPARD and Interferon Gamma Promote Transformation of Gastric Progenitor Cells and Tumorigenesis in Mice. Gastroenterology 2019, 157, 163–178.
3. Pudakalakatti, S.; Zuo, X.; Titus, M.; Shureiqi, I.; Bhattacharya, P. Identifying the Metabolic Signatures of PPARD-Overexpressing Gastric Tumors. Int. J. Mol. Sci. 2022, 23(3), 1645
Figures
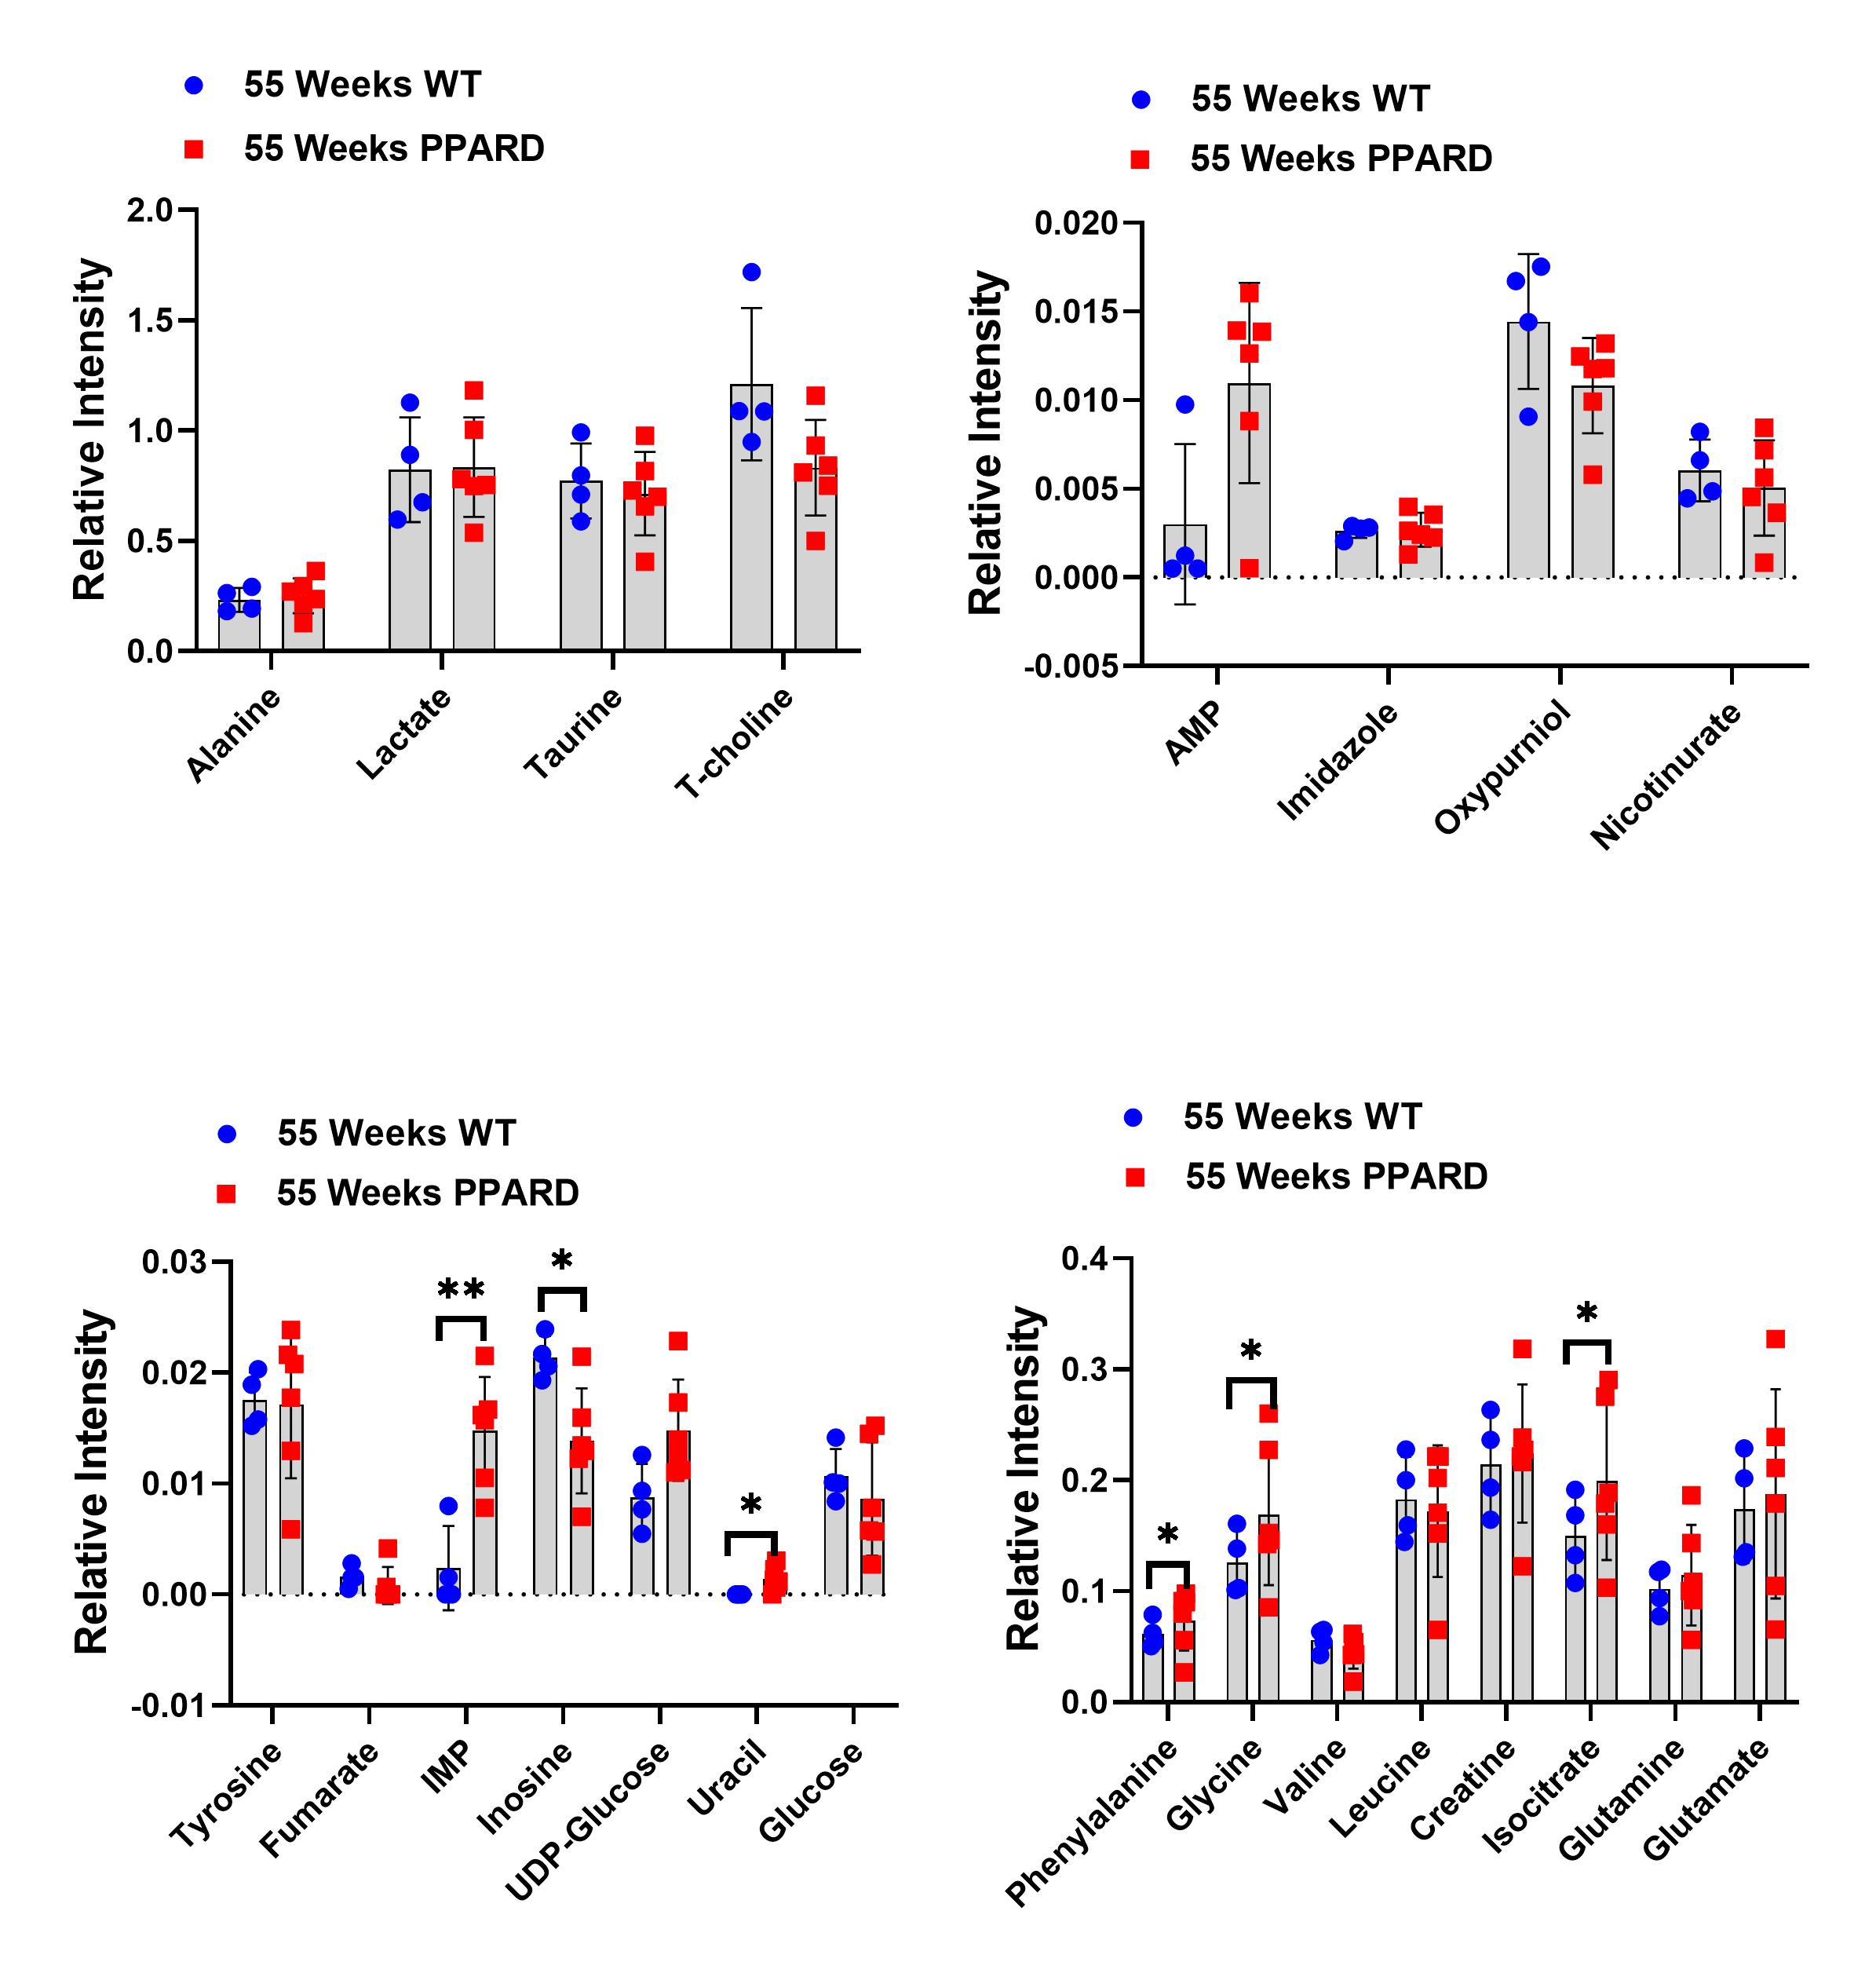
Figure 1: Interleaved scatter plots are showing the differences in the metabolite concentrations between 55-week-old PPARD and WT mice. The error bars represent standard deviation. Significant differences in IMP, inosine, uracil, phenylalanine, glycine, and isocitrate levels were observed. * p < 0.05; ** p < 0.005
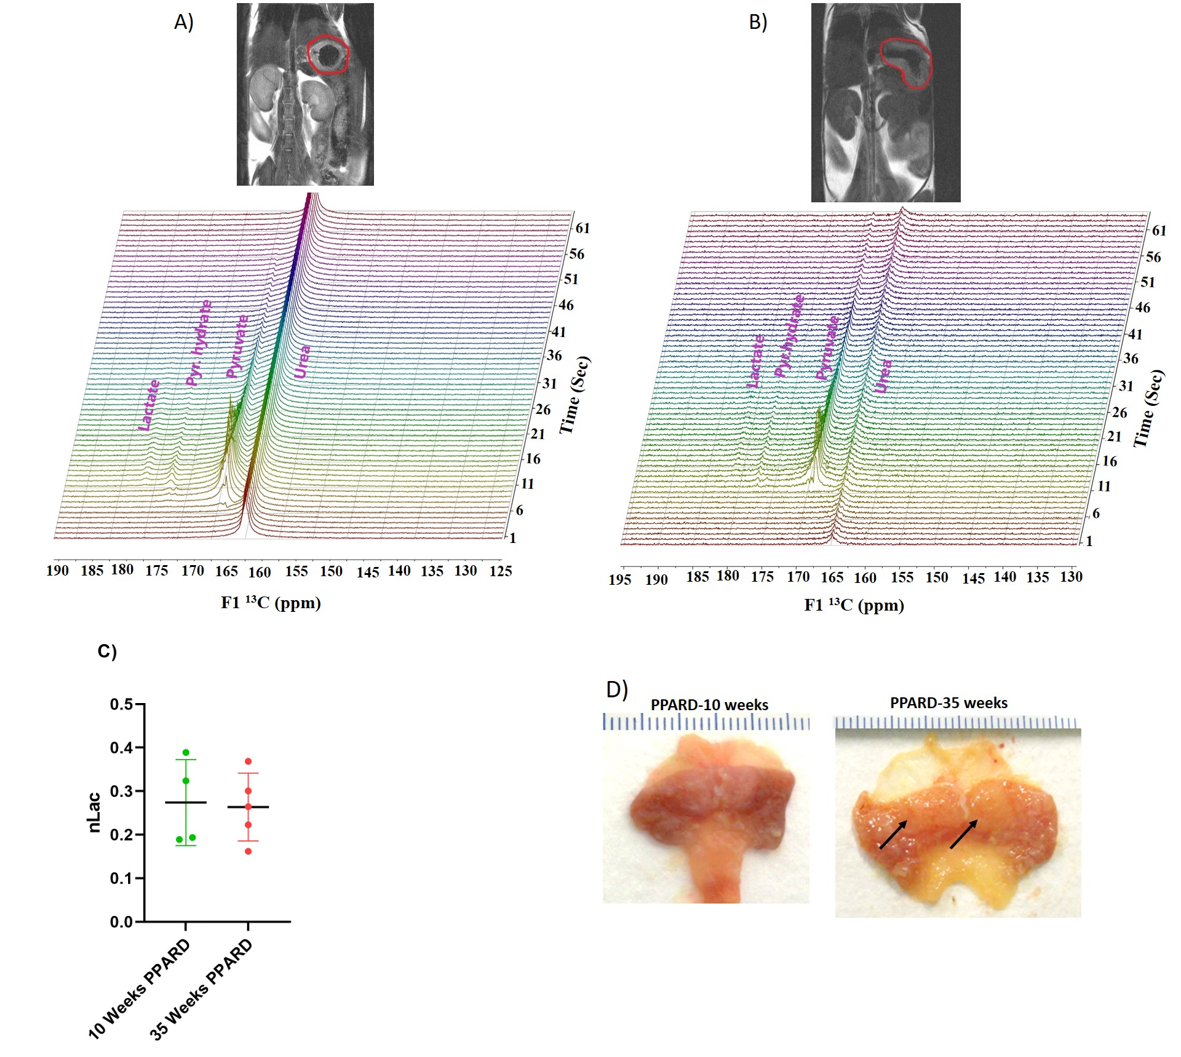
Figure 2: A) and B) Representative proton T2 weighted MR images of 10 week and 35 week PPARD gastric cancer mice. Gastric tumor is shown in the red circle. Below each anatomic proton image corresponding stacked 1D 13C spectrum collected after injection of hyperpolarized pyruvate at tumor region with bar voxel is shown. C) No significant difference in lactate to total pyruvate+ lactate ratio (nLac) is observed between 10 week and 35 week PPARD overexpressing gastric tumors. D) Pictures of tumors (arrow) of 10 week and 35 week PPARD overexpressing mice collected after euthanization.
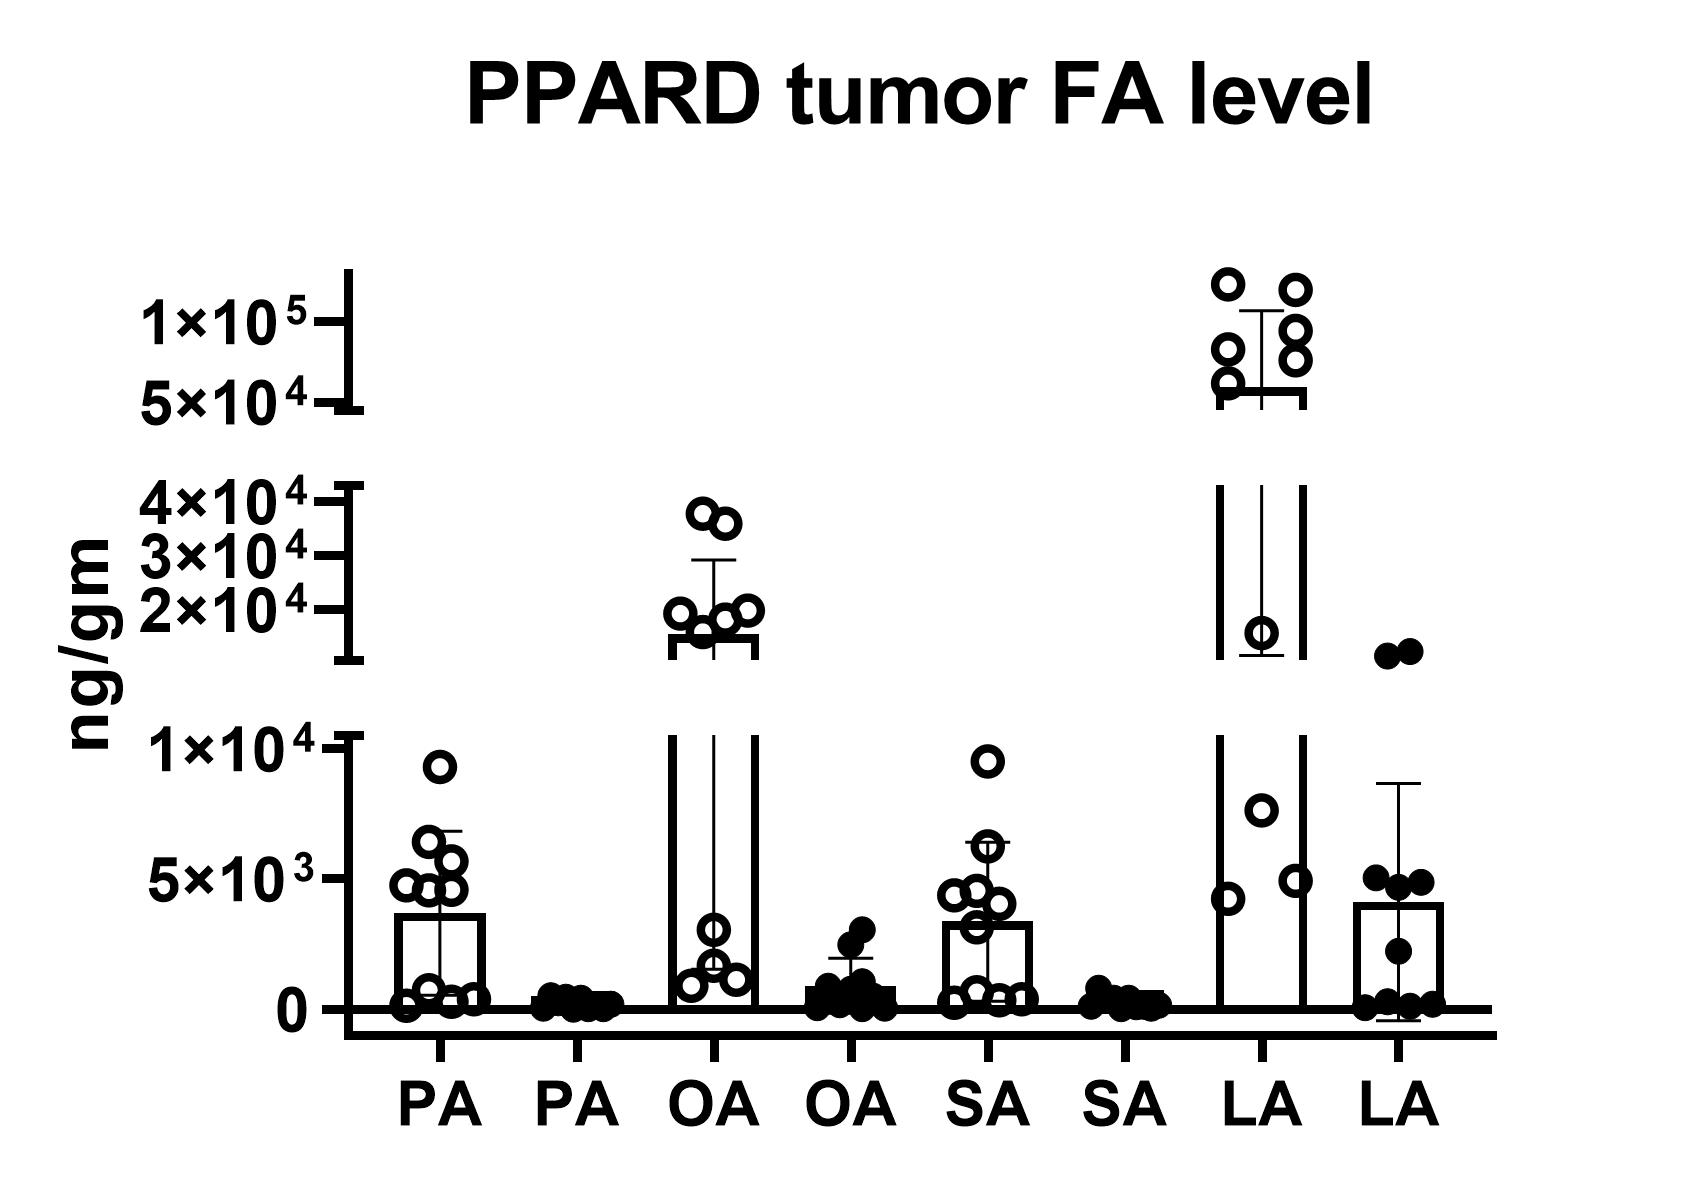
Figure 3: Palmitic acid (PA), oleic acid (OA), steric acid (SA), and linoleic acid (LA) levels went down in 55 week PPARD mice tumors (solid black circles) compared to 10 week PPARD mice tumors (hollow circles). The p values for PA (p = 0.0029), OA (p = 0.0007), SA (p = 0.0028), and LA (p = 0.0015) are significant.
DOI: https://doi.org/10.58530/2023/4115