4114
Comparison and combination of CT and MRI radiomics for early prediction of pathological response to neoadjuvant chemotherapy in gastric cancer
Jing Li1, Hongkun Yin2, Jinxia Guo3, and Jinrong Qu4
1Radiology, the Affiliated Cancer Hospital of Zhengzhou University (Henan Cancer Hospital), Zhengzhou, China, 2Institute of Advanced Research, Infervision Medical Technology Co., Ltd, Beijing, China, 3GE Healthcare, MR Research China, Beijing, Beijing, China, 4the Affiliated Cancer Hospital of Zhengzhou University (Henan Cancer Hospital), Zhengzhou, China
1Radiology, the Affiliated Cancer Hospital of Zhengzhou University (Henan Cancer Hospital), Zhengzhou, China, 2Institute of Advanced Research, Infervision Medical Technology Co., Ltd, Beijing, China, 3GE Healthcare, MR Research China, Beijing, Beijing, China, 4the Affiliated Cancer Hospital of Zhengzhou University (Henan Cancer Hospital), Zhengzhou, China
Synopsis
Keywords: Digestive, Radiomics, Gastric cancer; Computed tomography, X-rayed; Neoadjuvant chemotherapy
To compare and combine CT and multi-parametric MRI (mp-MRI) radiomics for early prediction of pathologic response to neoadjuvant chemotherapy (NAC) in locally advanced gastric cancer (LAGC). The CT radiomics model, mp-MRI radiomics model and the combined nomogram were all associated with pathologic response. The multi-modal nomogram containing both CT and MRI radiomics scores exhibited added predictive ability and was linked to patients’ outcome. The CT and MRI radiomics model exhibited equivalent capability. This study proposed a multi-modal radiomics nomogram by incroperating concurrent CT and MRI images, which presents favorable efficacy in predicting treatment response to NAC in LAGC.Purpose
Current radiomics analysis on treatment response prediction in gastric cancer focused on CT solely, multi-parametric MRI (mp-MRI)’s significance in gastric cancer radiomics has not been addressed. This study aimes to compare and combine CT and mp-MRI radiomics for pretreatment prediction of pathological response to neoadjuvant chemotherapy (NAC) in locally advanced gastric cancer (LAGC)Methods
A total of 225 consecutive LAGC who received NAC plus radical gastrectomy and evaluated under the criteria of tumor regression grading (TRG) from two centers were retrospectively recruited. The TRG results are the ground truth, patients were labeled as responders (TRG=0+1) and non-responders (TRG=2+3). Concurrent baseline (before NAC) CT and MRI images were segmented with a 2D freehand ROI manually on the maximal tumor slice. Rdiomics features were extracted through the least absolute shrinkage and selection operator method. Key radiomics features were extracted to build radiomics score (Radscore) and compared between responders and non-responders. Logistic regression classifier was applied to construct CT model, ADC/T2WI/DCE and mp-MRI based models. A multi-modal nomogram integrating CT/mp-MRI Radscore were constructed thereafter. Models’ performances were evaluated and compared using receiver operating characteristic (ROC) curve, its clinical utility was determined by decision curve analysis (DCA). The association of the nomogram with overall survival (OS) and progression free survival (PFS) was evaluated by Kaplan-Meier survival analysis.Results
The ADC/T2WI/DCE models, CT Radscore, mp-MRI Radscore and the combined nomogram were all significantly associated with TRG (P<0.001). The nomogram incorporating CT and mp-MRI Radscores achieved the highest AUCs of 0.893 (95% CI, 0.834-0.937) and 0.871 (0.767-0.940) in training and validation datasets, and exhibited prognostic significance in predicting patients’ survival, with hazard ratio (HR) was 3.358 (95% CI,1.250-9.019) (long rank P = 0.035), C-index was 0.589 (95% CI, 0.463-0.707) for OS, and HR was 2.937(95% CI: 1.270-6.789) (long rank P = 0.023), C index was 0.601 (95% CI, 0.475-0.718) for PFS. The DCA revealed the nomogram holds higher net benefit than CT model and mp-MRI model across the majority range of reasonable threshold probabilities. Moreover, the mp-MRI model yielded higher AUC than single sequence based models, but showed insignificant difference from CT model in both datasets (P>0.05).Conclusions
The mp-MRI radiomics is equivalent to CT radiomics in predicting pathologic response to NAC for LAGC. The nomogram integrating both CT and mp-MRI Radscore further improved the predictive capability.Acknowledgements
No acknowledgement found.References
- Sung H, Ferlay J, Siegel RL,et al. Global cancer statistics 2020: GLOBOCAN estimates of incidence and mortality worldwide for 36 cancers in 185 countries. CA Cancer J Clin 2021; 71 (3) :209-249. 2.
- Coccolini F, Nardi M, Montori G, et al. Neoadjuvant chemotherapy in advanced gastric and esophago-gastric cancer. Meta-analysis of randomized trials. Int J Surg 2018; 51:120-127. 3.
- Shi C, MD, Berlin J, Branton PA, et al. Protocol for the examination of specimens from patients with carcinoma of the stomach (Version: Stomach 4.1.0.0) [EB/OL]. Northfield: College of American pathologists February. Published February 1, 2020. Accessed November 1, 2020. https://documents.cap.org/protocols/cp-giupper-stomach-20-4100.pdf 4.
- Cui Y, Zhang J, Li Z, et al. A CT-based deep learning radiomics nomogram for predicting the response to neoadjuvant chemotherapy in patients with locally advanced gastric cancer: A multicenter cohort study. EClinicalMedicine 2022; 46:101348. 5.
- Li J, Yan LL, Zhang HK, et al. Dynamic contrast-enhanced and diffusion-weighted MR imaging in early prediction of pathologic response to neoadjuvant chemotherapy in locally advanced gastric cancer. Abdom Radiol (NY) 2022; 47(10):3394-3405. 6.
- Horvat N, Veeraraghavan H, Khan M, et al. MR Imaging of Rectal Cancer: Radiomics Analysis to Assess Treatment Response after Neoadjuvant Therapy. Radiology 2018; 287 (3):833-843. 7.
- Chen W, Wang S, Dong D, et al. Evaluation of Lymph Node Metastasis in Advanced Gastric Cancer Using Magnetic Resonance Imaging-Based Radiomics. Front Oncol 2019; 9:1265. 8.
- Collins GS, Reitsma JB, Altman DG, et al. Transparent reporting of a multivariable prediction model for individual prognosis or diagnosis (TRIPOD): the TRIPOD statement. BMJ 2015; 350:g7594. 9.
- Meng L, Dong D, Chen X, et al. 2D and 3D CT Radiomic Features Performance Comparison in Characterization of Gastric Cancer: A Multi-Center Study. IEEE J Biomed Health Inform 2021; 25 (3):755-763. 10.
- van Griethuysen JJM, Fedorov A, Parmar C, et al. Computational Radiomics System to Decode the Radiographic Phenotype. Cancer Res 2017; 77(21):e104-e107.
- Lehmann TM, Gönner C, Spitzer K. Addendum: B-spline interpolation in medical image processing. IEEE Trans Med Imaging 2001; 20(7):660-665.
- de Vos BD, Berendsen FF, Viergever MA, et al. A deep learning framework for unsupervised affine and deformable image registration. Med Image Anal 2019; 52:128-143.
- Vickers AJ, Cronin AM, Elkin EB, et al. Extensions to decision curve analysis, a novel method for evaluating diagnostic tests, prediction models and molecular markers. BMC Med Inform Decis Mak 2008; 8:53.
Figures
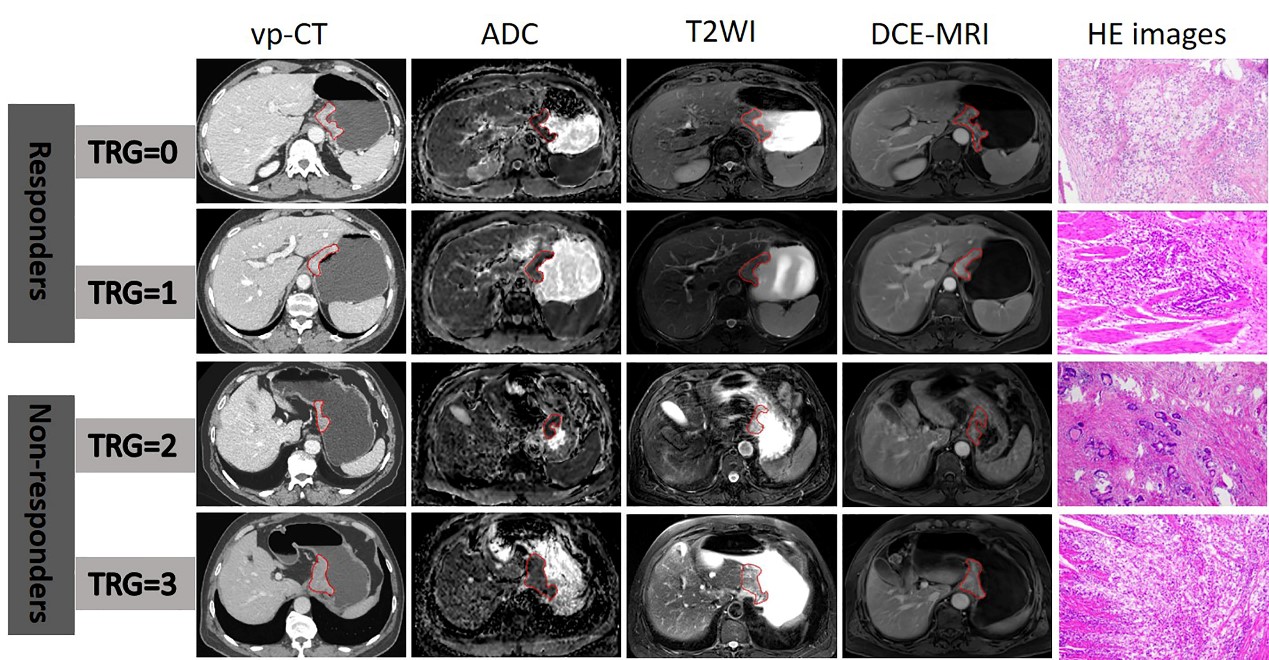
Figure
1: Typical CT and MRI images of four patients in responders and non-responders.
From left to right: tumor ROI delineation (red label) on pre-treatment original
CT images at the venous phase, ADC map, T2W images, DCE-MRI and postoperative
pathological images. Abbreviation: TRG=tumor regression grading, ROI= the
regions of interest, vp-CT=CT images at venous phase, ADC= apparent diffusion
coefficients, DCE-MRI=dynamic contrasted enhanced MRI.
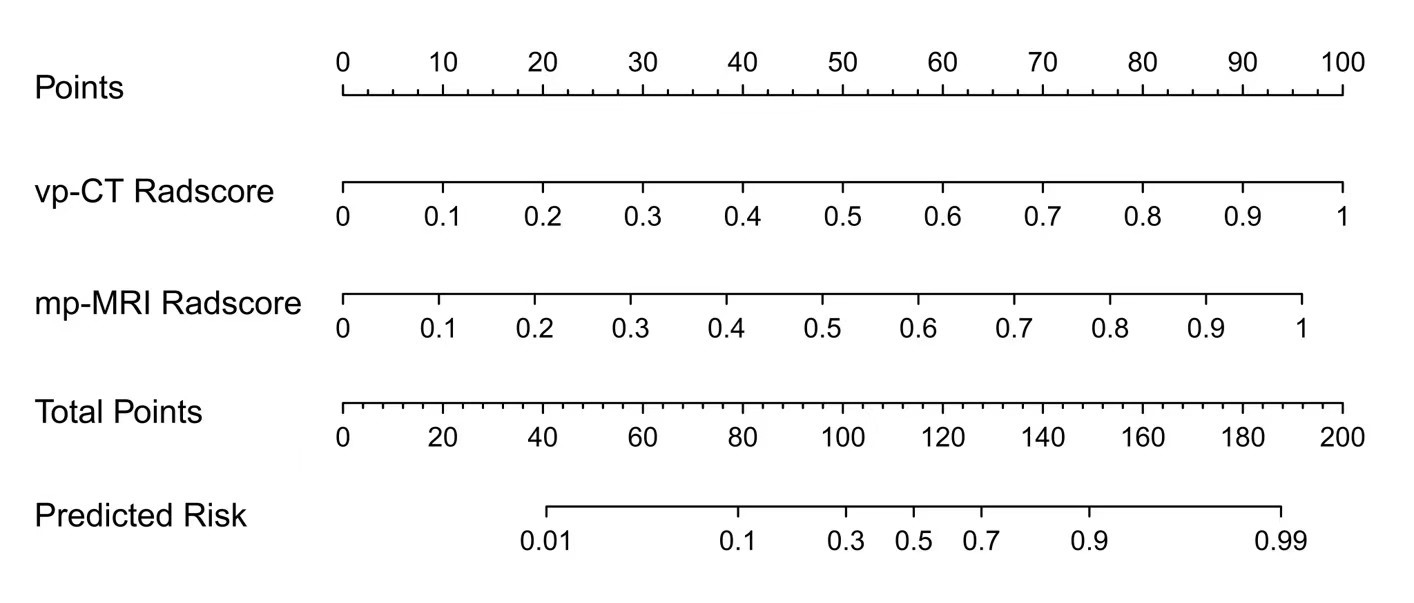
The
developed multi-modal radiomics nomogram
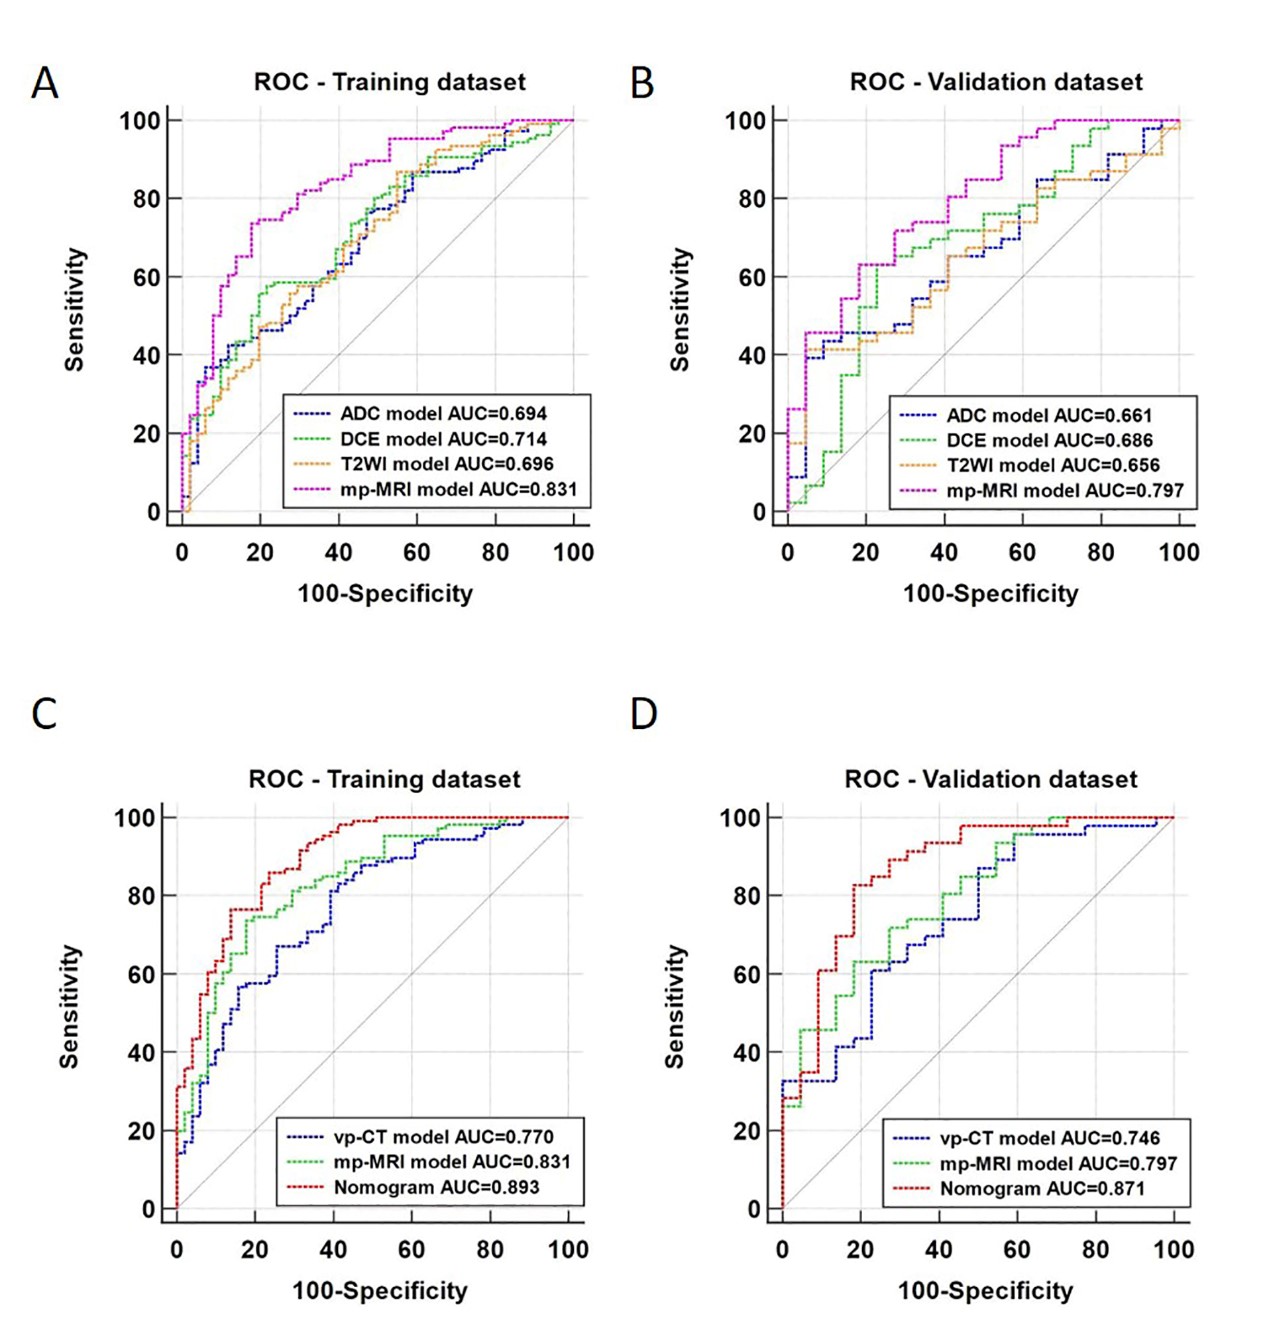
Predictive
performance of radiomics models. Receiver operating characteristic (ROC) curves
for radiomics models derived from derived from ADC, T2WI, DCE-MRI, mp-MRI in
(A) training dataset and (B) validation dataset. ROC analysis for radiomics
models derived from vp-CT, mp-MRI and the multi-modal nomogram in (C) training
dataset and (D) validation dataset.
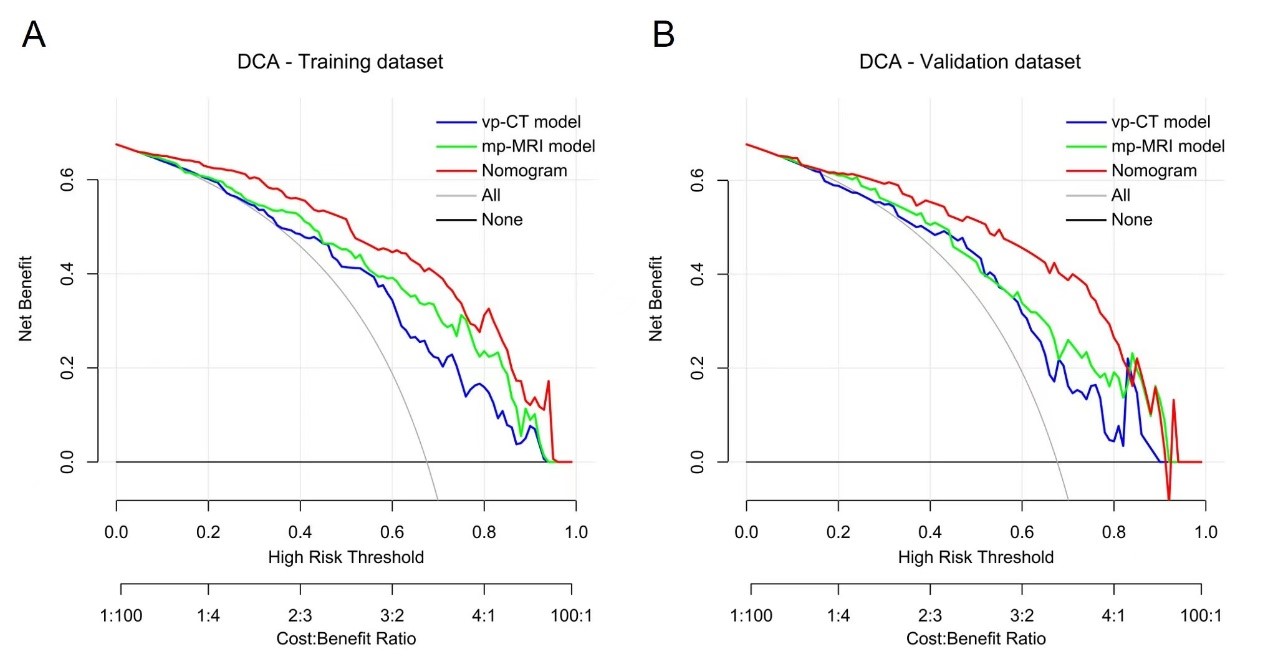
Decision
curve analysis for predicting response performance of radiomics models in (A)
training dataset and in (B) validation dataset. The y-axis measures the net
benefit, the red line represents the combined nomogram, the blue line
represents the vp-CT model, the green line represents mp-MRI model, the gray
line represents the assumption that all patients will respond to NAC treatment
and the horizontal black line represents the assumption that no patient will
respond to treatment.
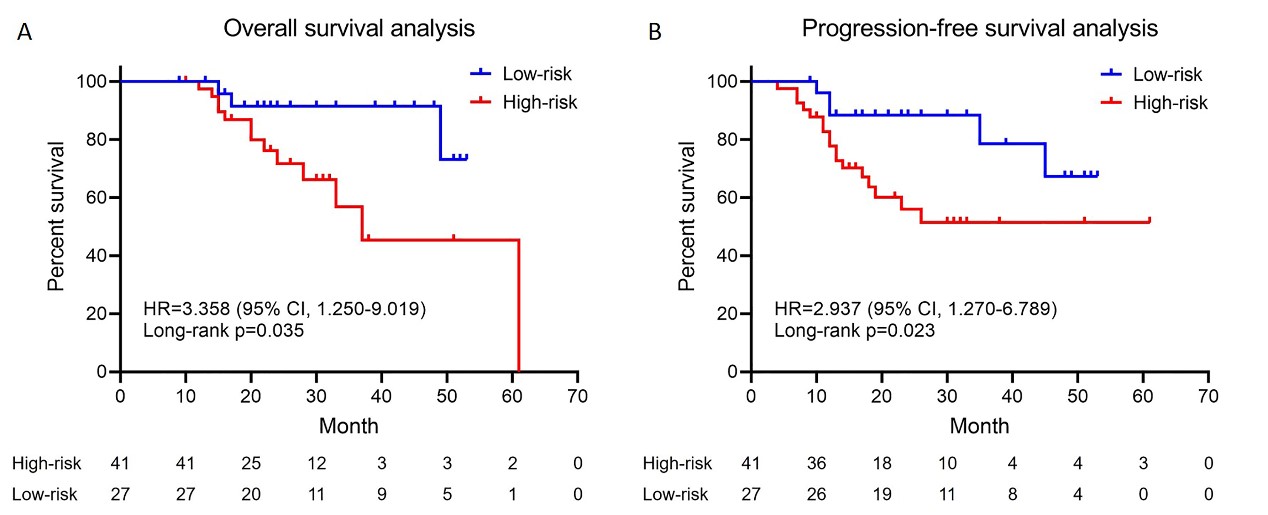
Kaplan–Meier
survival curves of overall survival (A) and progression-free survival (B)
according to the risk score predicted by the nomogram in the validation
dataset.
DOI: https://doi.org/10.58530/2023/4114