4112
Metabolic Profiling of Small Intestinal Mucosa of patients with Celiac Disease and their Family members by NMR Spectroscopy
Uma Sharma1, Deepti Upadhyay1, Prasenjit Das 2, and Govind K Makharia3
1Department of Nuclear Magnetic Resonance, All India Institute of Medical Sciences, New Delhi, NEW DELHI, India, 2Department of Pathology, All India Institute of Medical Sciences, New Delhi, NEW DELHI, India, 3Department of Gastroenterology & Human Nutrition, All India Institute of Medical Sciences, New Delhi, NEW DELHI, India
1Department of Nuclear Magnetic Resonance, All India Institute of Medical Sciences, New Delhi, NEW DELHI, India, 2Department of Pathology, All India Institute of Medical Sciences, New Delhi, NEW DELHI, India, 3Department of Gastroenterology & Human Nutrition, All India Institute of Medical Sciences, New Delhi, NEW DELHI, India
Synopsis
Keywords: Digestive, Body, Celiac disease, Metabolomics, First Degree Relative Celiac Disease, Biomarker, Pathophysiology, NMR Spectroscopy
The present study demonstrated distinct metabolic features of intestinal mucosa biopsies in first-degree relatives (FDRs) of patients with celiac disease (CeD) patients and disease controls (DC) using proton NMR spectroscopy. FDRs had significantly lower levels of proline and allantoin while higher levels of 7 metabolites compared to CeD patients. The results showed a higher concentration of glucose, fumarate, tyrosine, and formate in the FDRs as compared to CeD and DC indicating altered energy metabolism and gut microbiome of FDRs. The obtained results may provide insight into the underlying mechanism involved in the pathophysiology of CeD patients.Introduction
It is well known that celiac disease (CeD) is a familial disease1. Because of the genetic susceptibility, the prevalence of CeD among their first-degree relatives (FDRs) has been reported in the range of 2% to 20%, which is relatively higher than the general population2. Increased intestinal permeability3 and altered gut microflora4 have been reported even in those FDRs that had negative serology. To date, no metabolomics study has reported the metabolic pattern of the FDRs of CeD. In our continuing efforts to delineate the underlying biochemical processes of CeD development5,6, we thought that the metabolome of FDRs may shed additional information on the initiation of disease, as these subjects present with negative serology as well as normal intestinal histology. Therefore, we investigated the metabolic profile of small intestinal biopsies, of the serologically negative FDRs of the CeD patients using in-vitro 1H NMR spectroscopy coupled with univariate and multivariate data analysis methods. The metabolome of FDRs has been compared with those of the patients with CeD and disease controls (DCs).Patients and Methods
Sixty four patients with CeD (mean age 28.5 ± 11.4 yrs) and fifty anti-tTG Ab negative FDRs (mean age 33.1±13.8 yrs; female 21; male 29) of CeD patients (mean age 27.7 ± 12.5 yrs) were recruited for this study. Intestinal mucosal biopsies could be collected only from the 13 FDRs as the rest refused to undergo endoscopic examination. All these FDRs had normal mucosa on histopathological examination. Thirty-five subjects (mean age 31.9 ±9.4 yrs) undergoing endoscopy for dyspepsia served as DC. Informed consent was taken and Institute’s Ethics committee approved the study. All patients were treated according to the standard treatment regimen. Diagnosis of CeD was based on a combination of clinical manifestations, CeD-specific serological markers, and confirmed histological abnormalities using a modified Marsh-Oberhuber classification. During the endoscopic examination, mucosal biopsies were obtained from the second part of the duodenum (6 bits for NMR spectroscopy and 4 bits for histopathology). Perchloric acid extraction of mucosa was carried out and lyophilized powder was dissolved in D2O and subjected to proton NMR spectroscopy (1D and 2D) at 700 MHz. (Agilent, U.S.A.). Sodium trimethyl silyl- (2,2,3,3-H4) propionate was added as a standard for chemical shift and quantification of metabolites. The concentration of metabolites was determined and compared using Kruskal Wallis and Mann Whitney (SPSS 20.0) test as appropriate and a p-value <0.05 was considered significant. PCA analysis was performed on the concentration data to determine clustering patterns, followed by PLS-DA analysis to build a model for differentiating between various groups (Unscrambler 10.2, CAMO Software).Results
FDRs vs. CeD patientsFDRs had significantly lower levels of proline and allantoin while higher levels of seven metabolites compared to CeD patients (Table 1). PLS-DA score plots also depicted the separation between FDRs and CeD patients (R2Y=0.52 and Q2=0.51) (Figure 1). The corresponding loading plot indicated the metabolites that were responsible for the separation of groups (Figure 2).
FDRs vs. DC
The concentration of glucose, tyrosine, fumarate, and formate was significantly higher in the intestinal mucosa of FDRs compared to DC (Table 1). The PLS-DA score plot revealed clear differentiation of FDRs from DC (R2Y=0.74 and Q2=0.63) (Figure 3). The loading plot indicated the metabolites contributing to the separation between the two groups (Figure 4).
Discussion
To the best of our knowledge, this is the first study demonstrating a distinct metabolic profile of the small intestine mucosa of FDRs compared to CeD patients and DC. Our data showed a significantly lower concentration of allantoin in the FDRs compared to CeD, however, it was similar to DC. Allantoin was reported as a biomarker of oxidative stress and inflammation7 and thus its low level reflected the absence of intestinal inflammation in FDRs. A significantly higher concentration of histidine was seen in FDRs compared to CeD, while it was similar to DC. Histidine has anti-inflammatory and anti-oxidant effects8, its higher level may be indicative of its increased biosynthesis and its utilization for a cytoprotective mechanism of intestinal mucosa in FDRs. We earlier reported a significantly lower level of histidine in the patients with CeD5 and potential celiac disease CeD6 as compared to DC indicating its significant role in mucosal protection. Lower proline was seen in FDRs compared to CeD but it was similar to DC. Proline serves as a precursor for the synthesis of various metabolites such as polyamines and amino acids such as Arg9, thus playing a protective role in maintaining mucosal integrity in FDRs. Interestingly, FDRs had altered levels of glucose, isoleucine, phenylalanine, fumarate, formate, and tyrosine compared to CeD and DC. The glutamine, glutamate, and isoleucine along with glucose serve as an energy source for small intestinal mucosa10. Thus, altered levels of these metabolites may be attributed to metabolic abnormalities in their utilization as energy substrates and perturbation in the TCA cycle (fumarate) and gut microflora (tyrosine).Conclusion
The present study demonstrated distinct metabolic features of intestinal mucosa in FDRs of CeD patients. The results may provide insight into the underlying mechanism involved in the pathophysiology of CeD.Acknowledgements
The Department of Biotechnology, Government of India is acknowledged for financial support (BT/Bio-CARe/01/233/2010-11). Department of Science and Technology, Govt. of India is acknowledged for providing funds for a 700 MHz NMR spectrometer (IR/SO/LU-05/2007/AIIMS).References
1. Macdonald WC, Dobbins WO 3rd, Rubin CE. N Engl J Med. 1965;272:448-56. 2. Singh P, Arora S, Lal S, Strand TA, Makharia GK. Am J Gastroenterol. 2015;110(11):1539-48. 3. van Elburg RM, Uil JJ, Mulder CJ, Heymans HS. Gut. 1993;34(3):354-7. 4. Tjellström B, Stenhammar L, Högberg L, Fälth-Magnusson K, Magnusson KE, Midtvedt T, Sundqvist T, Houlston R, Popat S, Norin E Scand J Gastroenterol. 2007;42(10):1204-8. 5. Upadhyay D, Singh A, Das P, Mehtab J, Dattagupta S, Ahuja V, Makharia GK, Jagannathan NR, Sharma U. NMR Biomed. 2020;33(8):e4305. 6. Upadhyay D, Singh A, Das P, Mehtab J, Dattagupta S, Ahuja V, Makharia GK, Jagannathan NR, Sharma U. NMR Biomed. 2020;33(8):e4305. 7. Dryland PA, Love DR, Walker MF, Dommels Y, Butts C, Rowan D, Roy NC, Helsby N, Brian L, Browning BL, Zhu S, Copp BR, Ferguson LR. TOBCJ.2008;1:1-6. 8. Yan SL, Wu ST, Yin MC, Chen HT, Chen HC. J Food Sci. 2009;74(8):H259-65. 9. Wu G, Bazer FW, Burghardt RC, Johnson GA, Kim SW, Knabe DA, Li P, Li X, McKnight JR, Satterfield MC, Spencer TE. Amino Acids. 2011;40(4):1053-63. 10. Wu G. J Nutr. 1998;128(8):1249-52.Figures
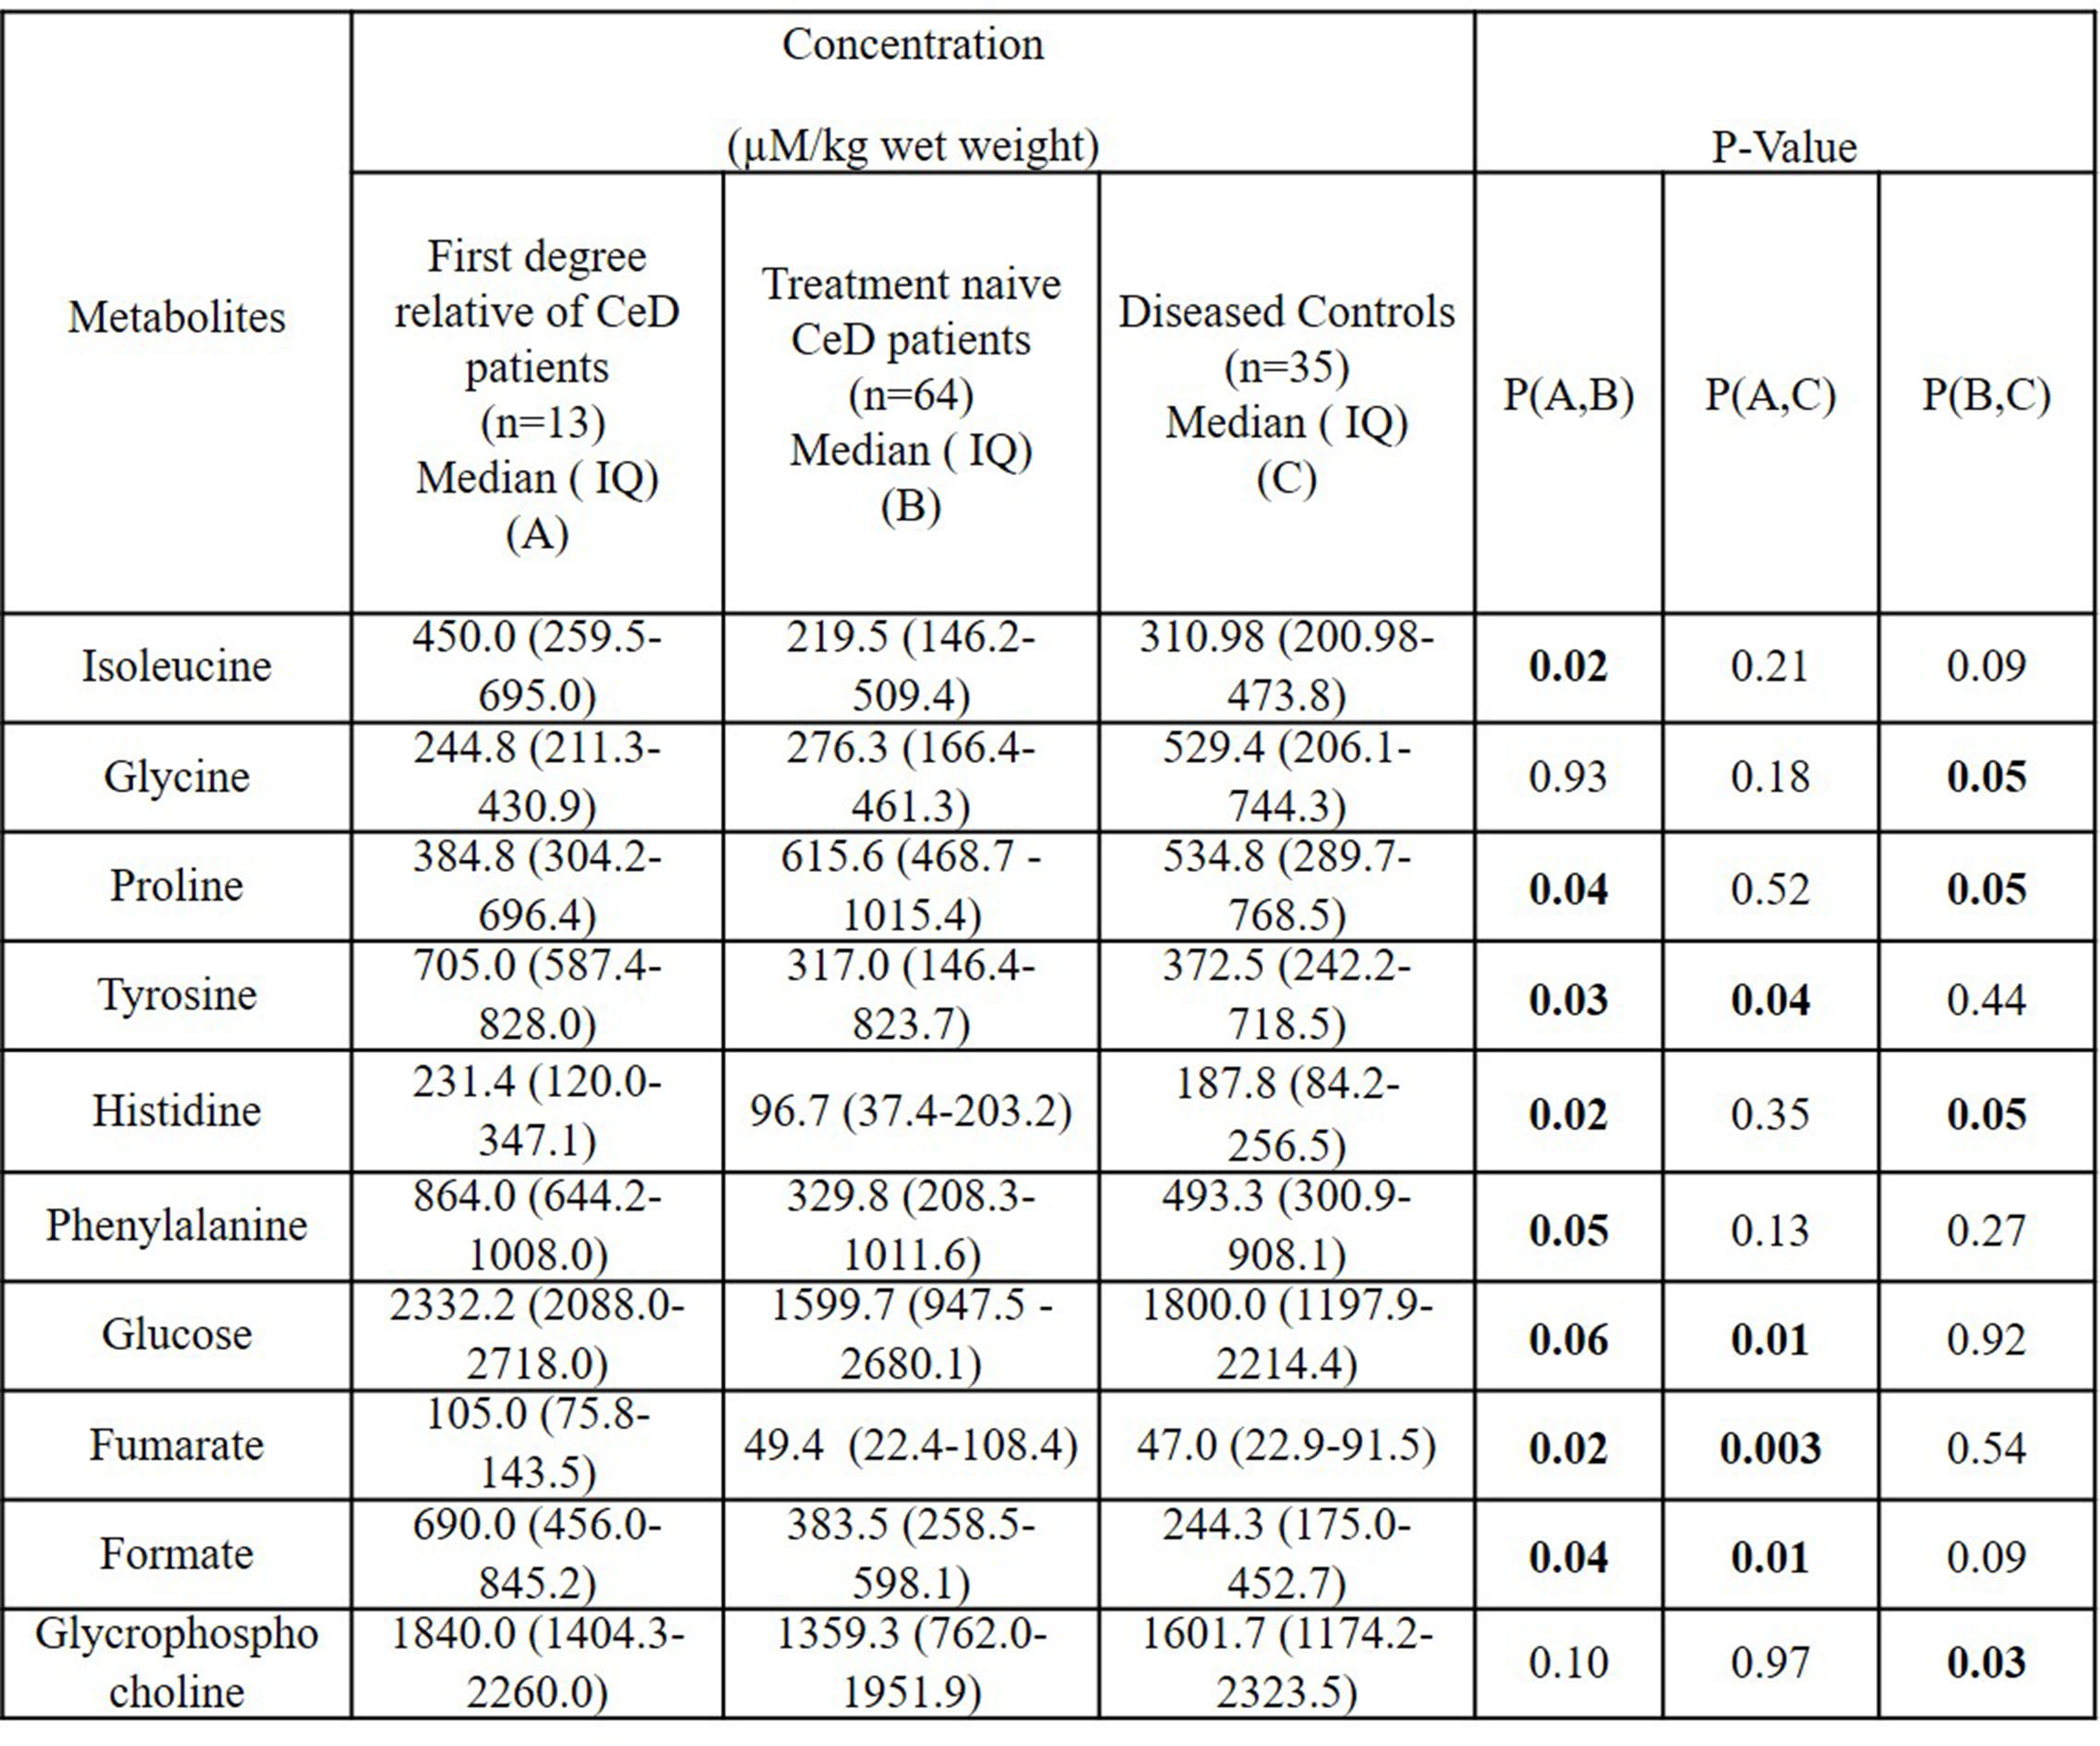
Table 1: Concentration (µM/Kg wet
weight) of metabolites in the intestinal mucosa obtained from first-degree relatives of CeD patients, treatment naïve CeD
patients, and diseased controls.
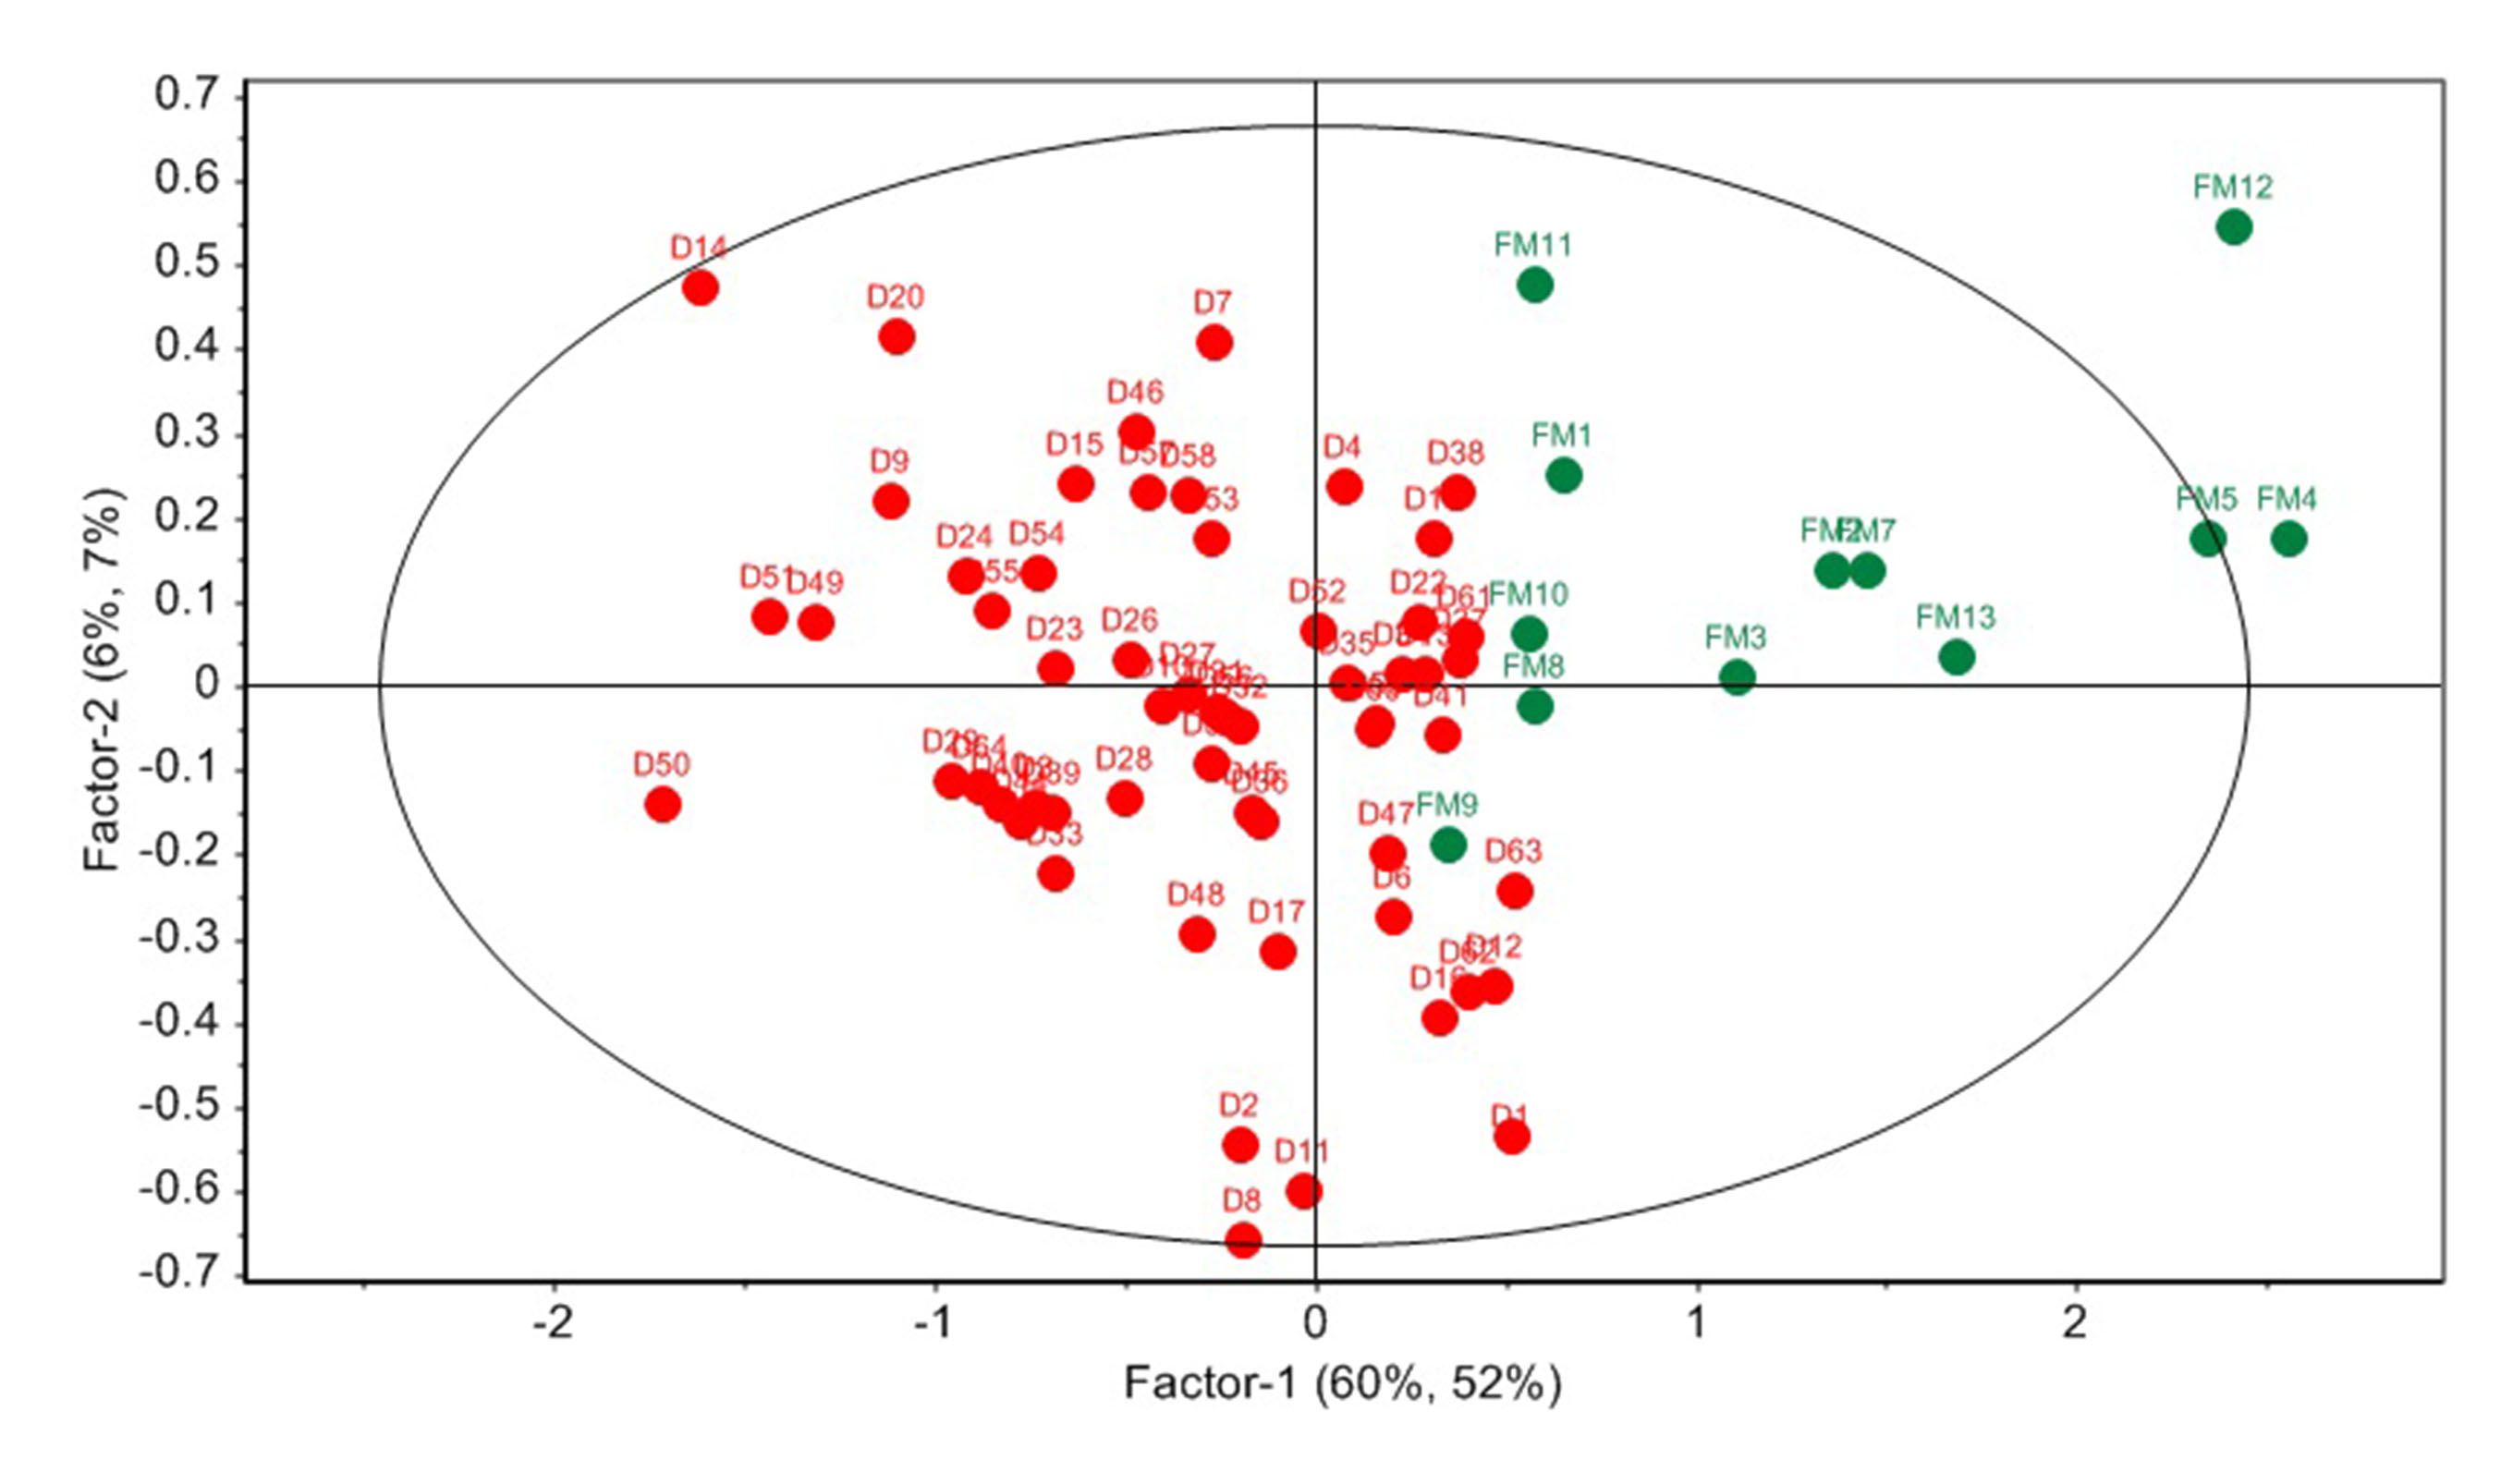
Figure 1: PLS-DA score plot showing separation
of FDRs (FM) and patients with CeD (D).
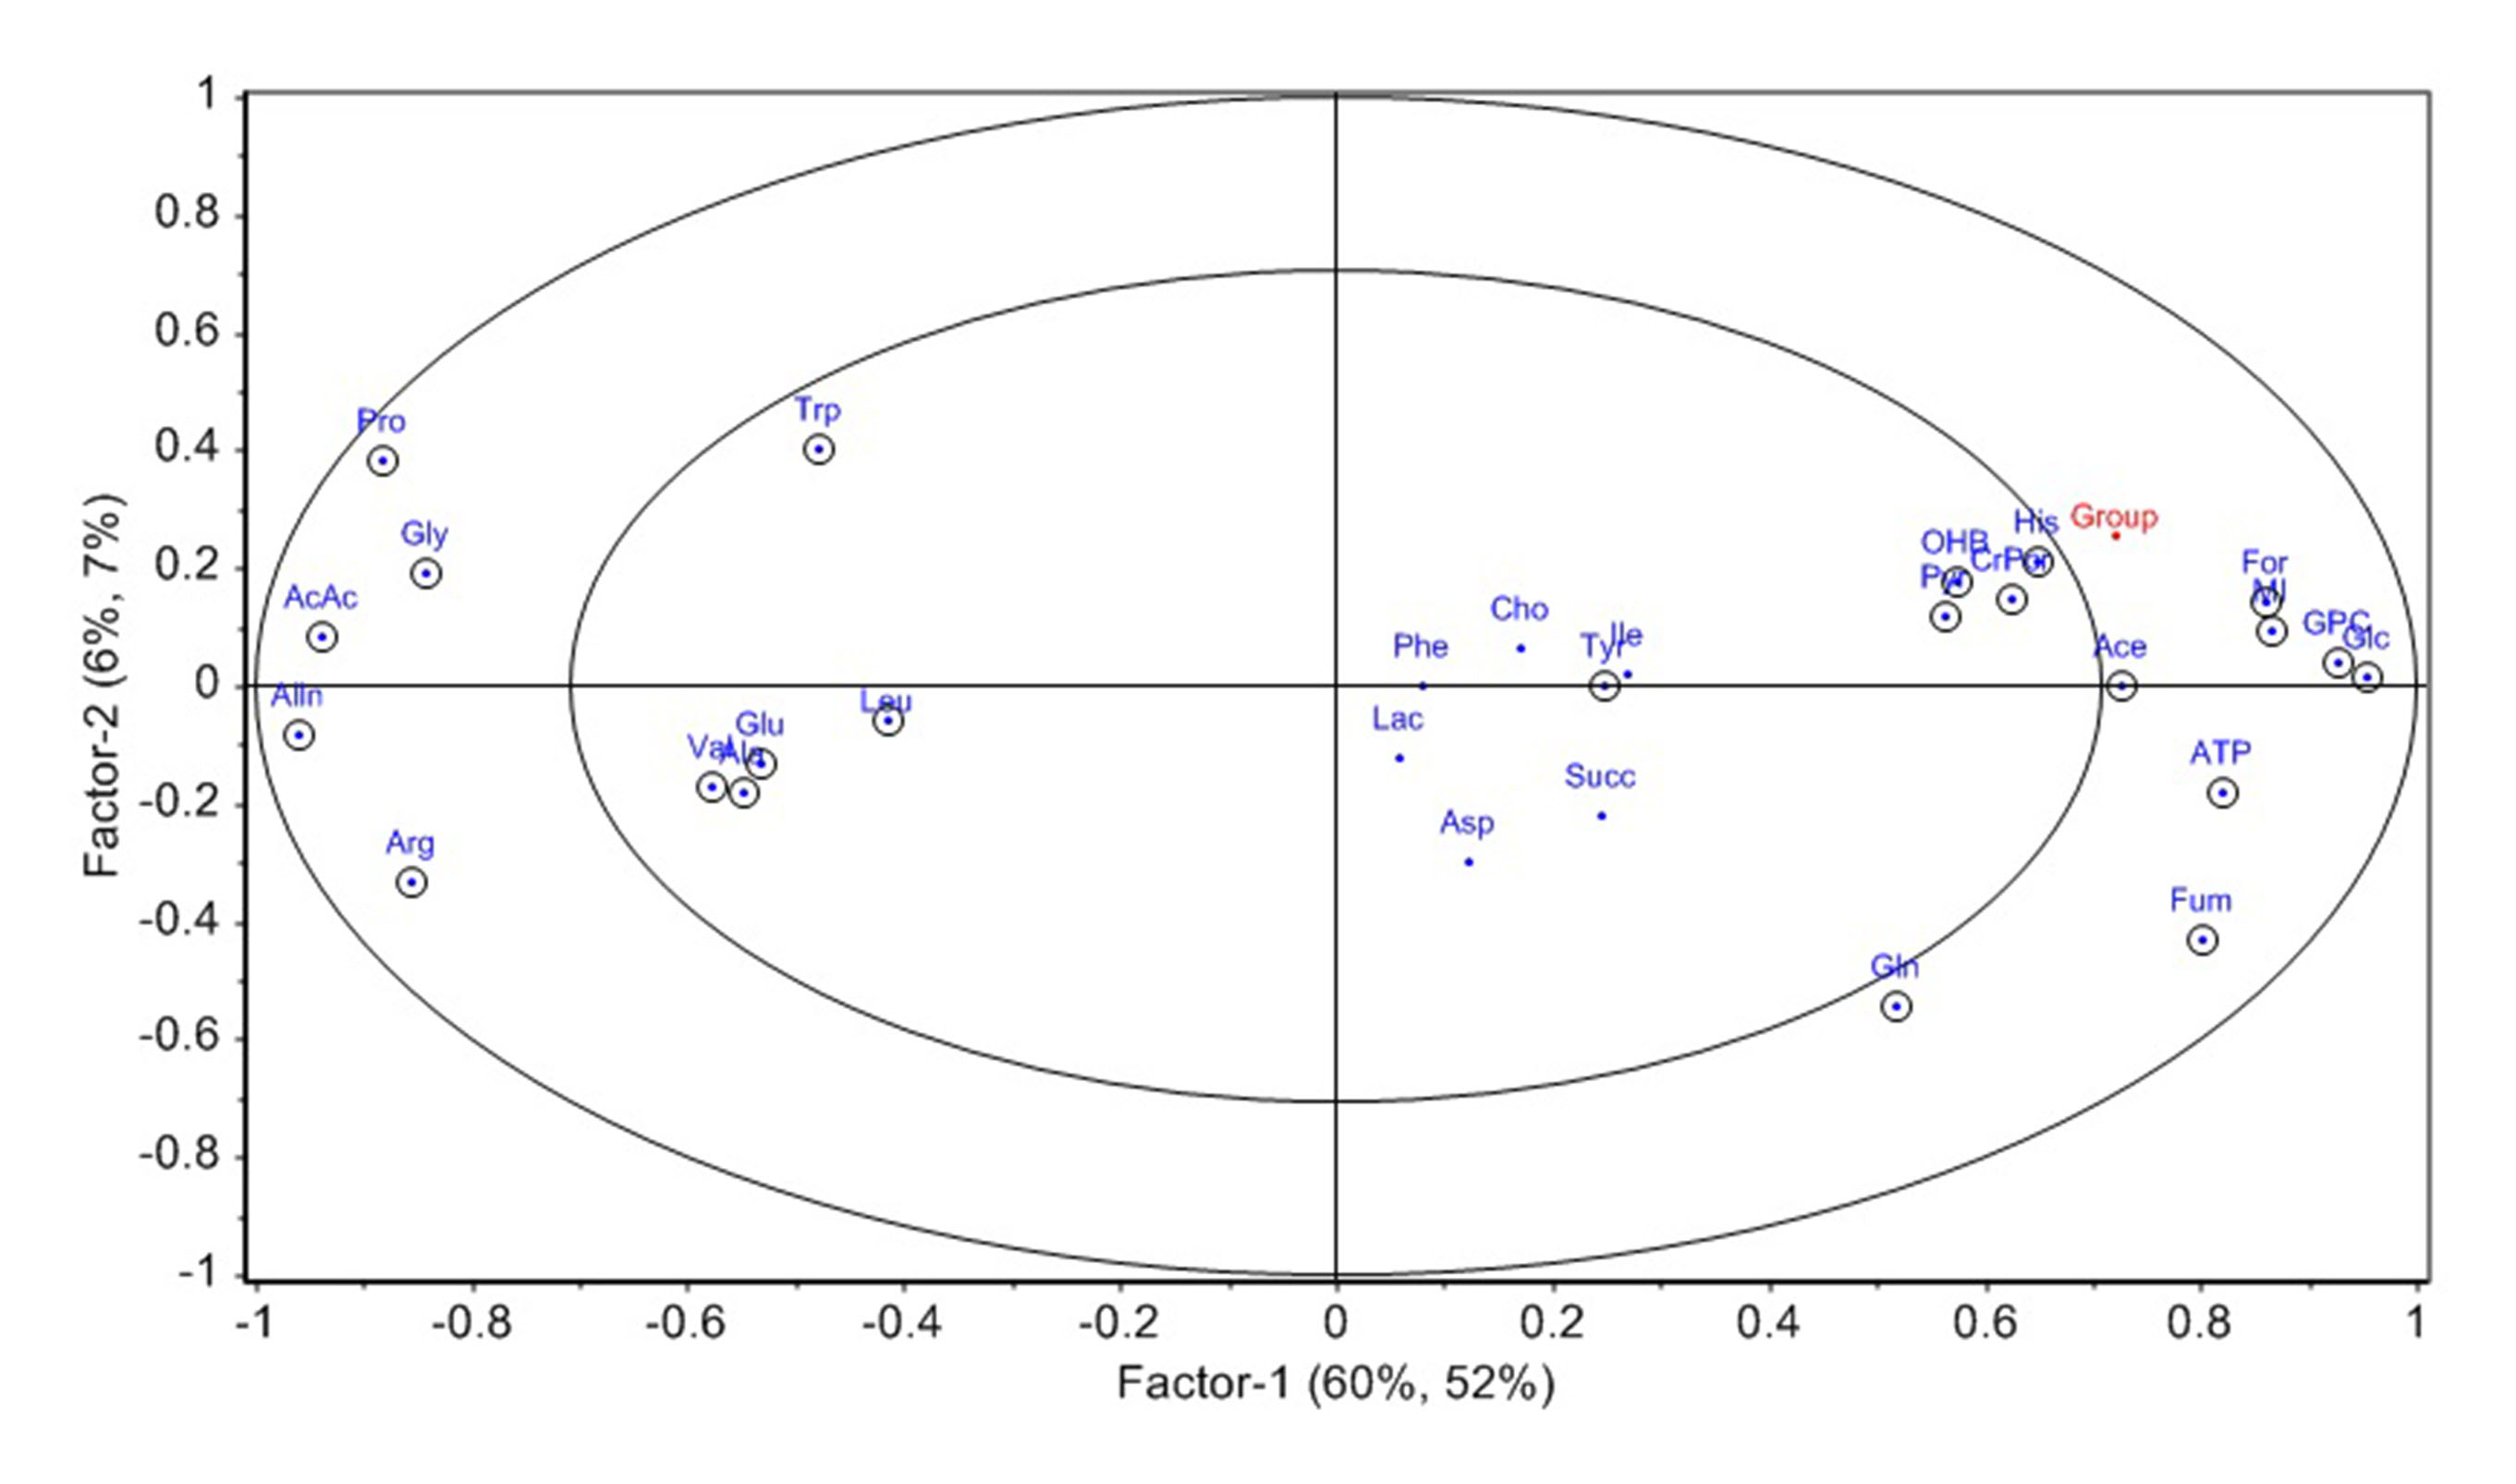
Figure 2:
PLS-DA loading plot showing metabolites contributing to separation of FDRs from
CeD patients.
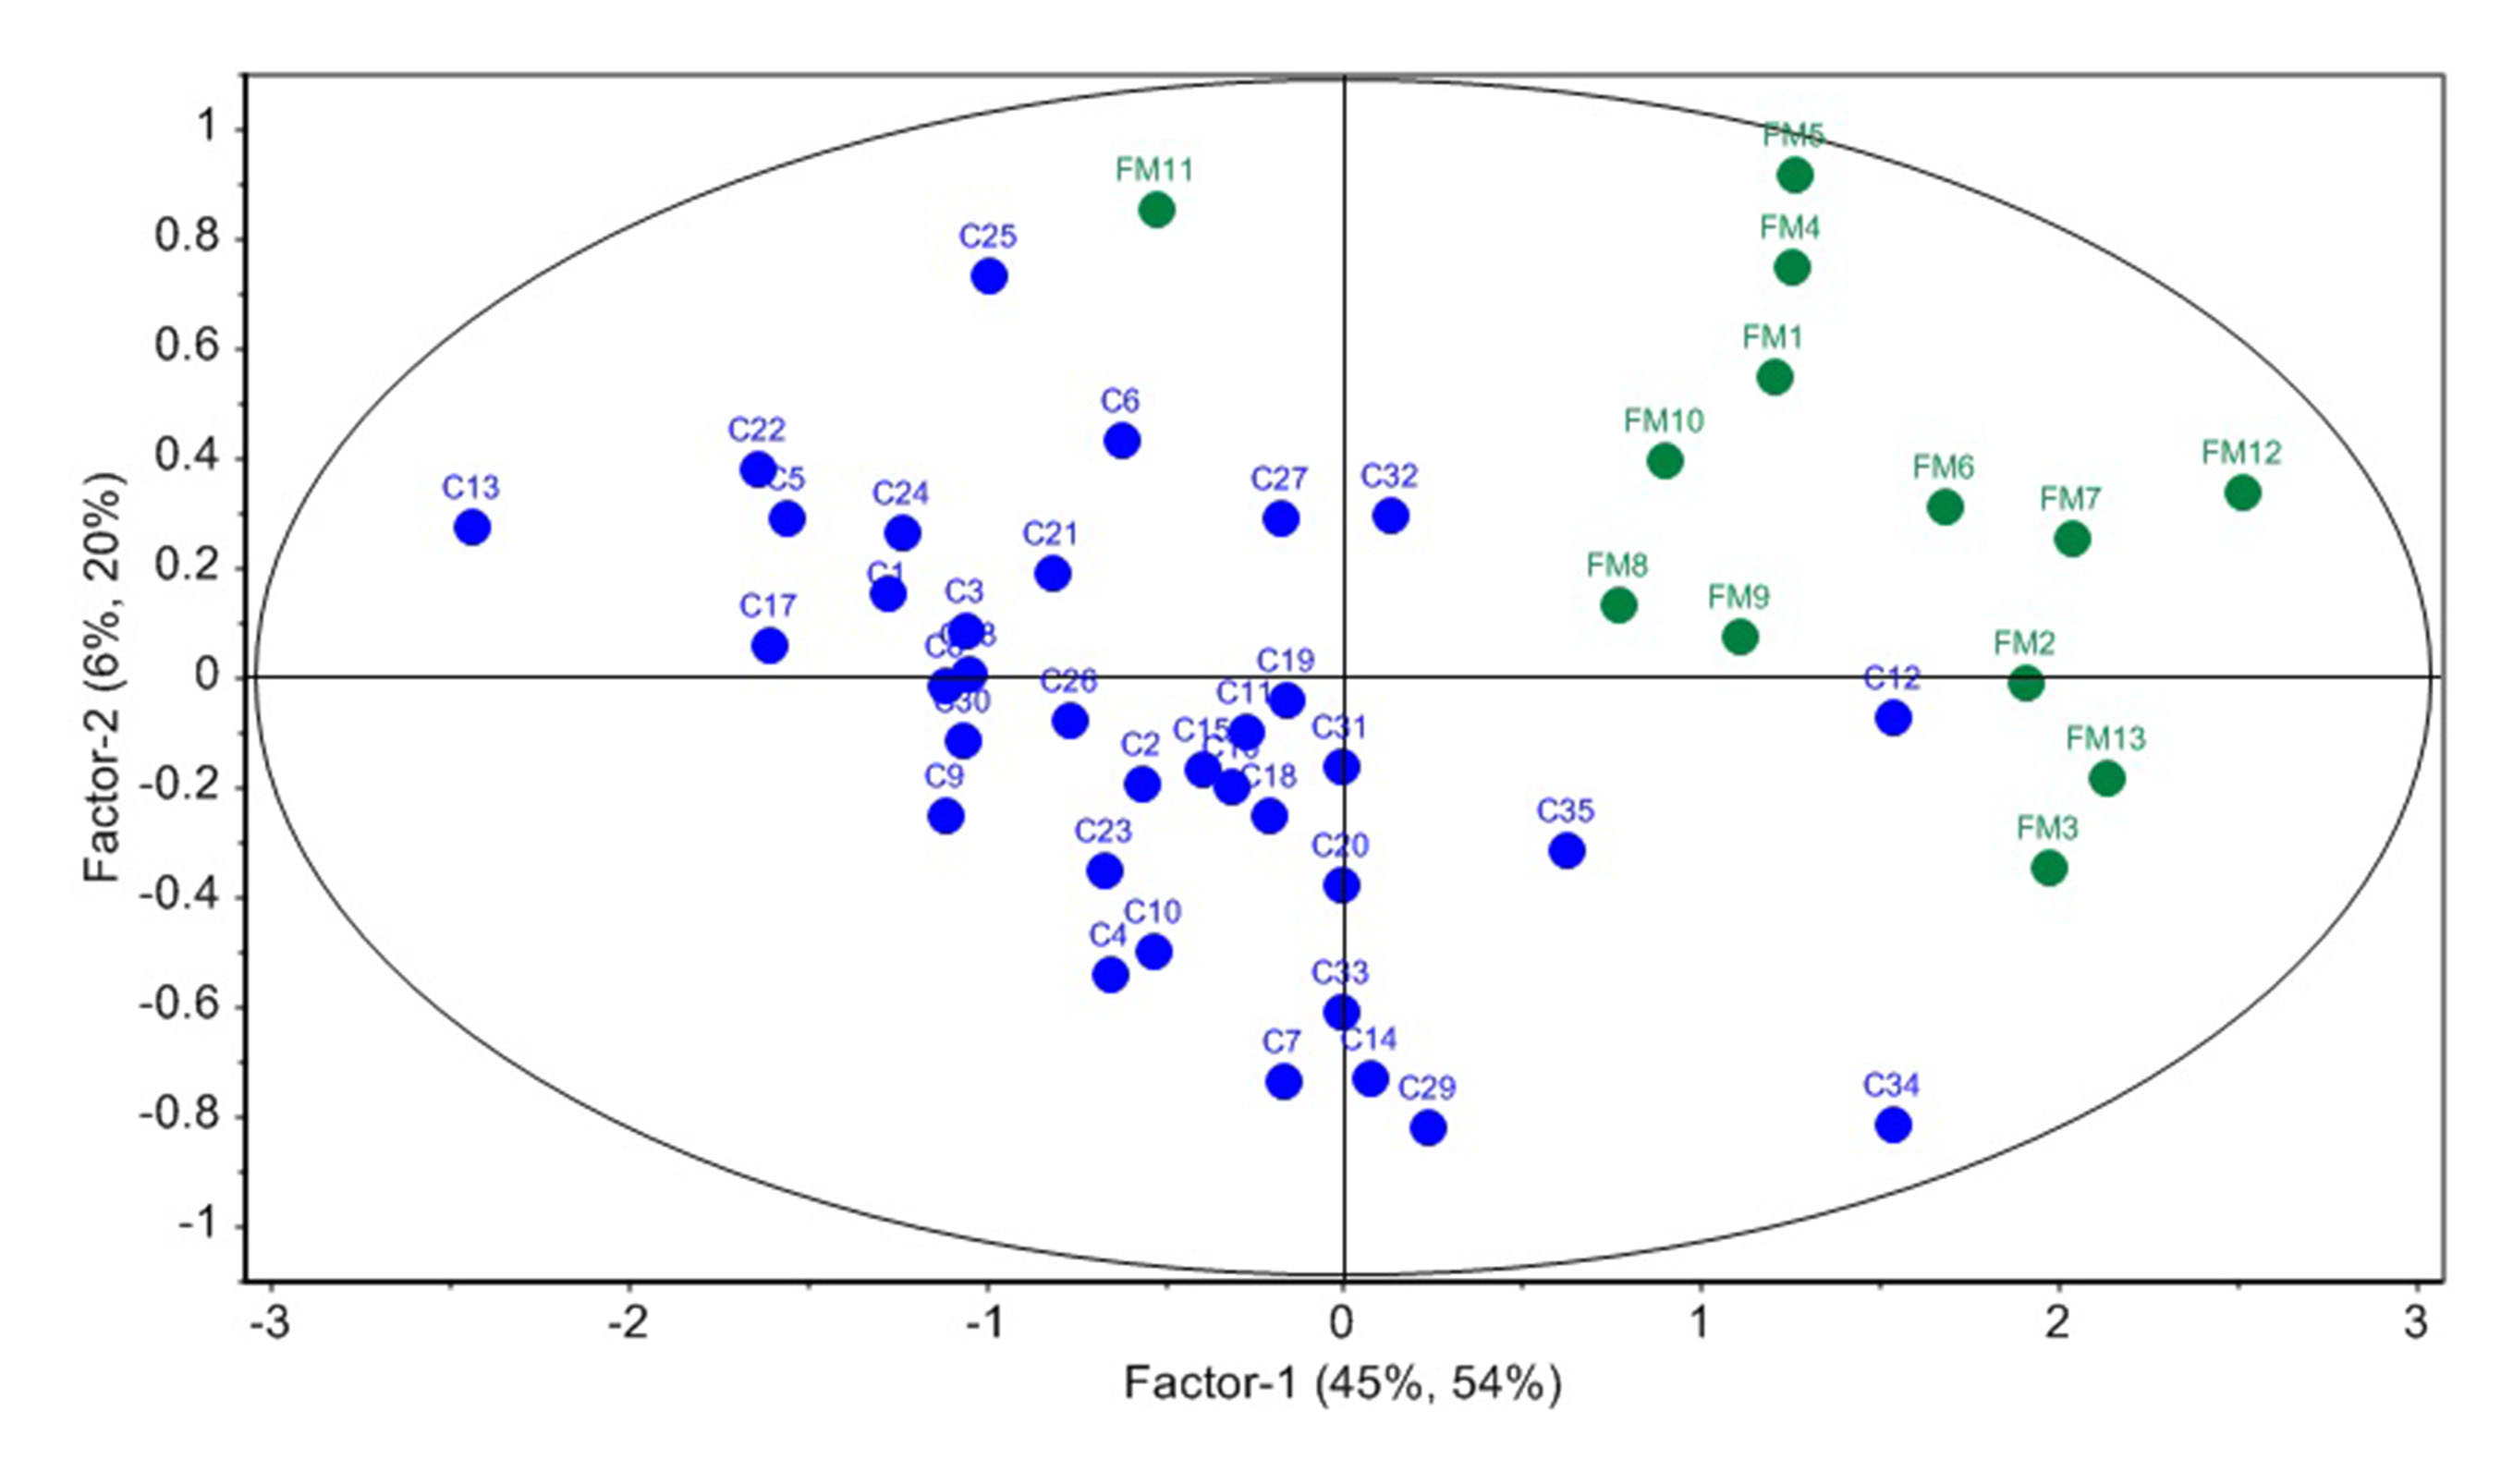
Figure 3: PLS-DA score plot showing separation
of FDRs (FM) and disease controls (C).
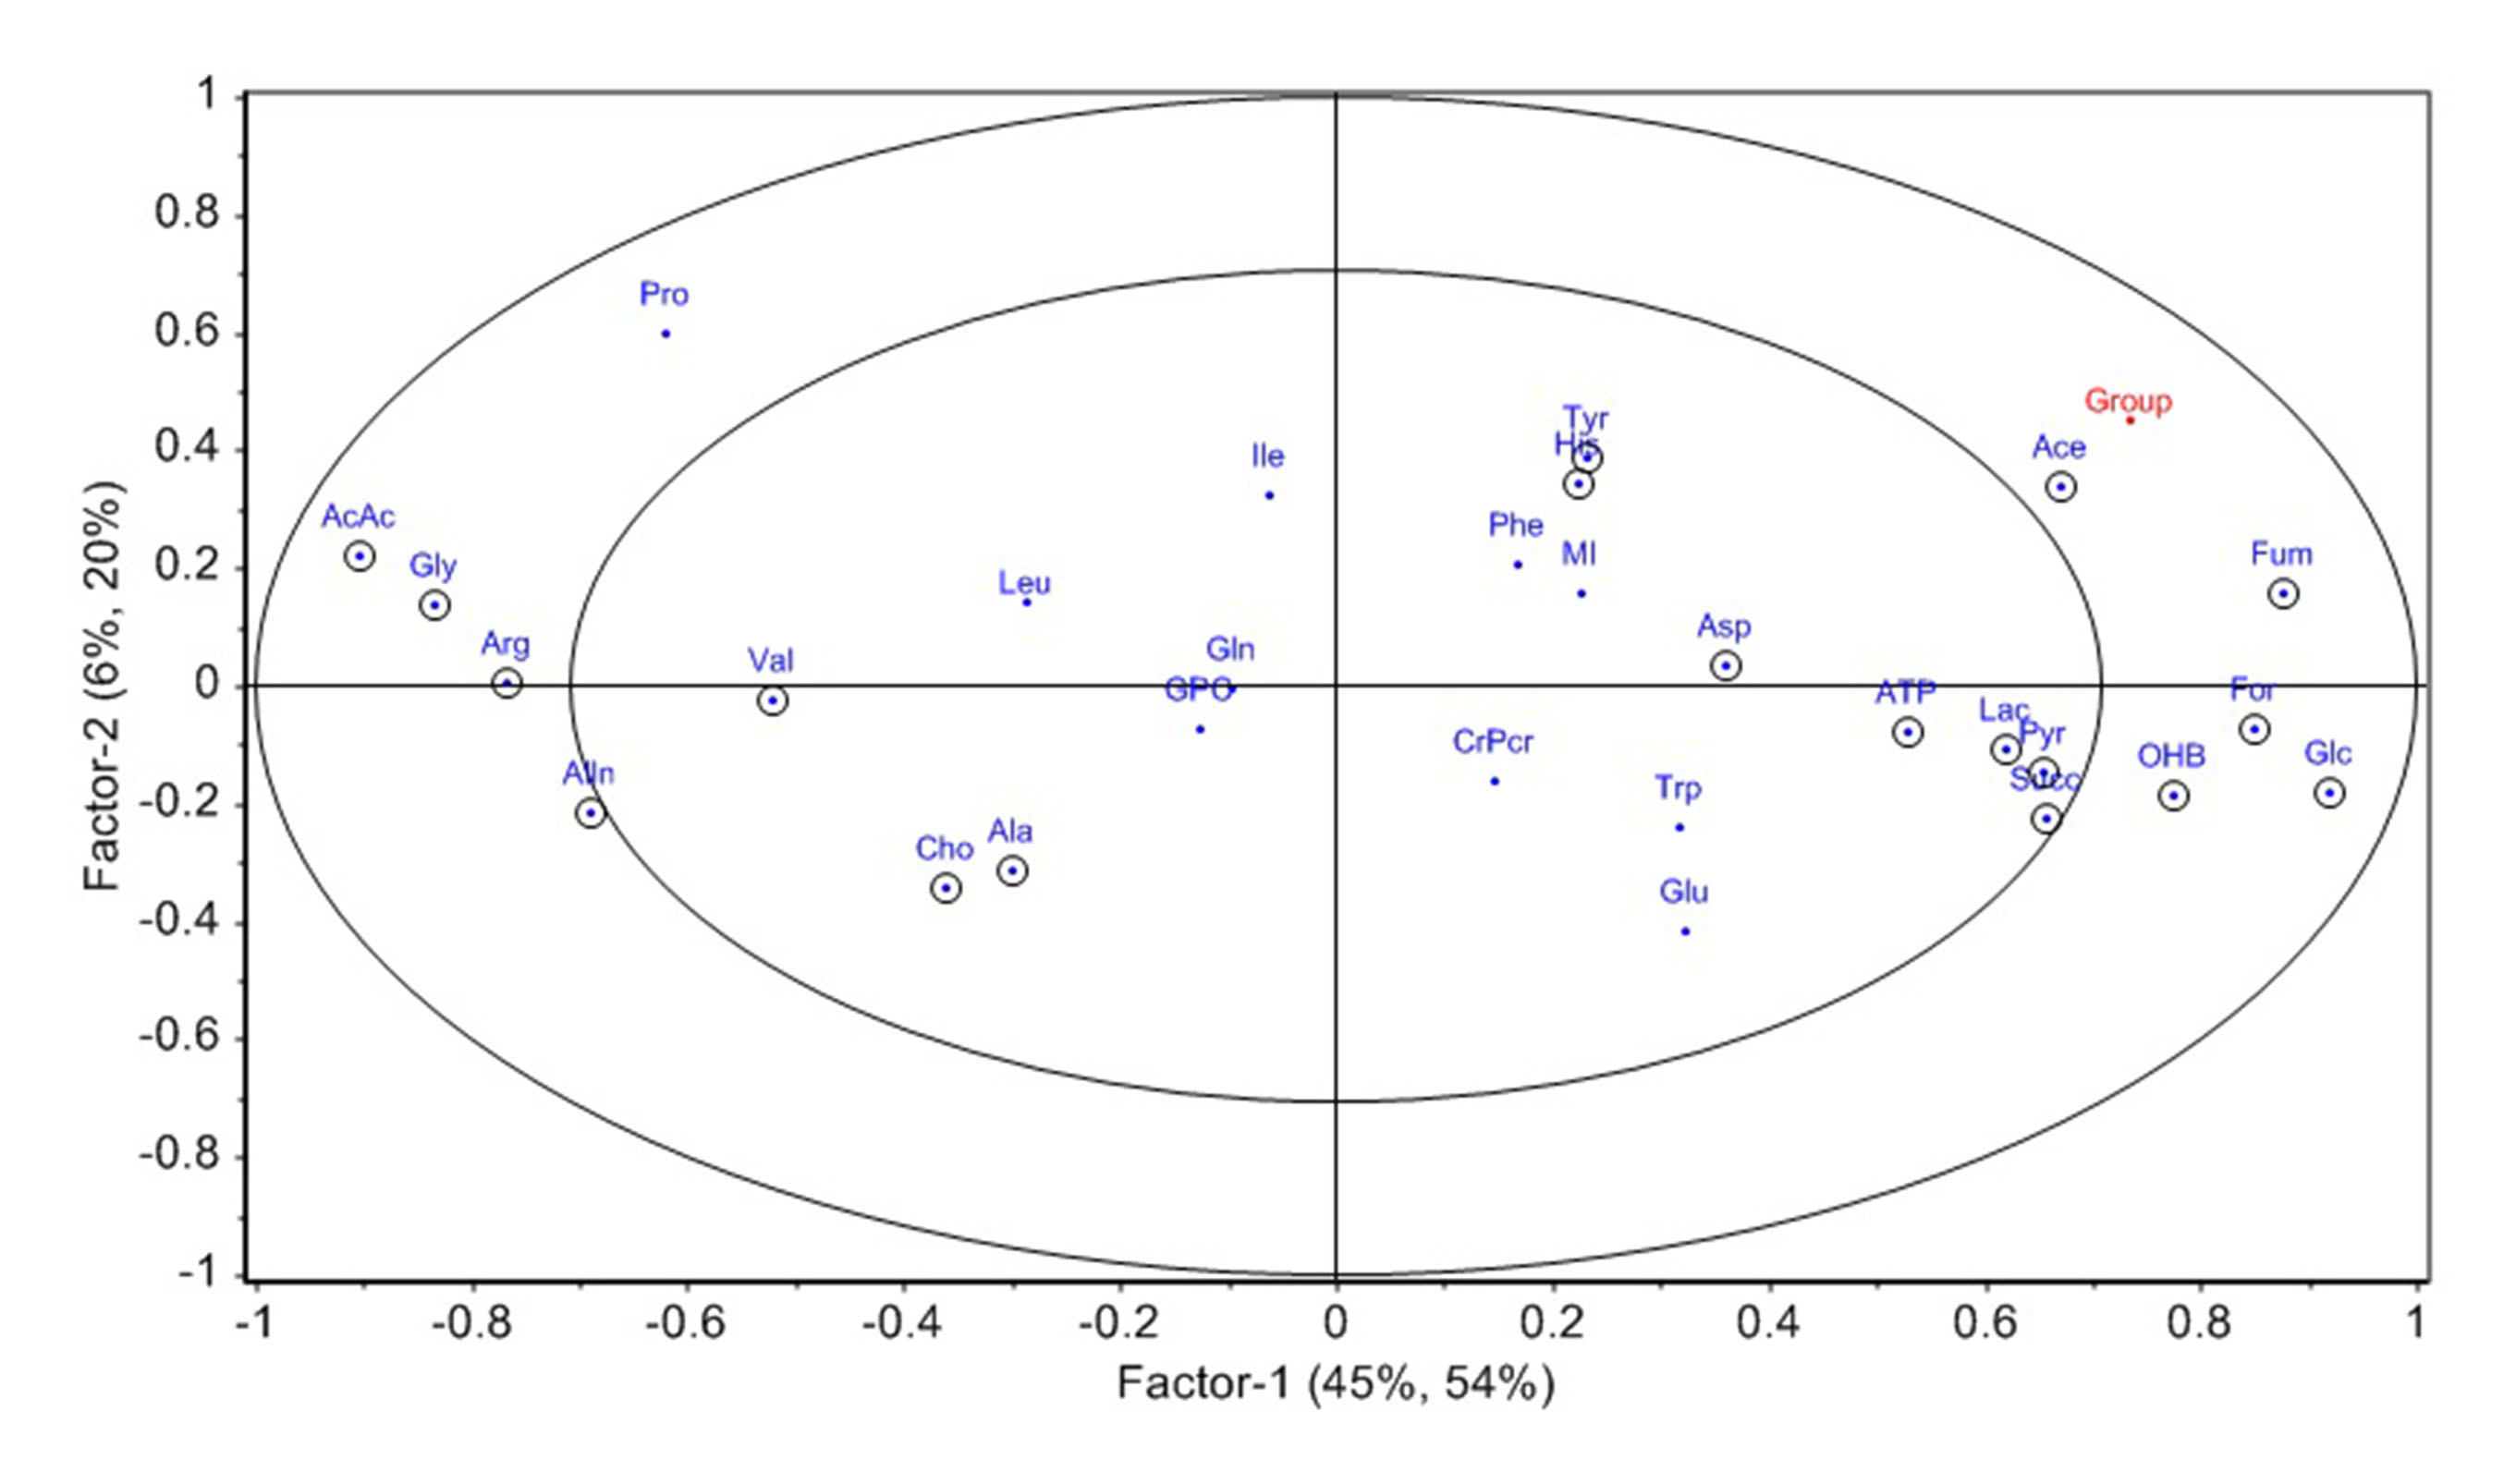
Figure 4:
PLS-DA loading plot showing metabolites contributing to separation of FDRs and disease
controls (C).
DOI: https://doi.org/10.58530/2023/4112